LAO Contact

January 21, 2020
The 2020-21 Budget:
School District Budget Trends
- Introduction
- Overview of District Budgets
- Core Cost Drivers
- Districts in Fiscal Distress
- Options for Addressing Cost Pressures
Executive Summary
Report Focuses on Addressing School Districts’ Cost Pressures. From 2013‑14 through 2019‑20, per‑student funding grew significantly. Under the Governor’s recently released budget plan, per‑student funding remains strong—projected to grow 4.1 percent in 2020‑21. With such strong growth in funding, the vast majority of districts are on a positive fiscal footing and have found ways to address the myriad cost pressures they face. A few districts, however, are on a precarious footing. In this report, we examine school districts’ key cost drivers and fiscal health. As part of our analysis, we look back at school districts’ actual experiences to date and look ahead at what districts’ experiences could be over the next few years. We end the report by identifying a few options for helping districts address their cost pressures moving forward.
Trends in Cost Drivers
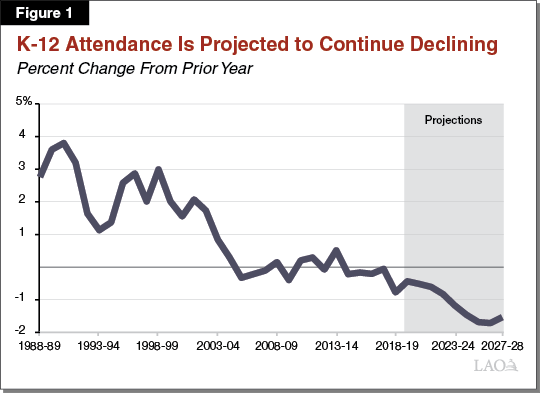
Overall School Attendance Has Been Declining, Projected to Continue Declining. Student attendance in California has declined every year since 2013‑14. The decline is partly attributable to a drop in the number of births in California and partly to a net out‑migration of school‑aged children. We project that student attendance will continue declining throughout the coming decade. Some areas of the state, including Los Angeles, Orange, and Santa Clara Counties have been, and are expected to continue, experiencing particularly large declines. Other areas of the state, however, have been growing. For example, Kern, Fresno, Sacramento, Placer, El Dorado, and San Francisco Counties have seen their attendance increase. Given demographic projections, some of these counties may see slower growth or even declines over the next decade.
Likely Less Pressure to Increase Teacher Workforce, More Pressure to Increase Support Staff. The statewide student‑to‑teacher ratio has been dropping over the past several years. In 2018‑19, it stood at about 21:1—comparable to the level prior to the Great Recession. With declining student enrollment also occurring, the pressure to hire additional teachers and reduce class sizes is likely to subside over the coming years. Whereas school districts increased their teacher workforce by 6.4 percent since 2013‑14, they increased their support staff by 21 percent, with notable increases in teacher aides, counselors, and psychologists. Some of this increase likely is a response to the growing share of students with disabilities. Given the growth trend in students with disabilities, pressure to increase support staff is likely to remain, at least over the next several years.
Pressure to Increase Compensation Likely to Remain Significant. Districts have been increasing staff salaries, and we expect them to continue facing pressure in this area given increases in the cost of living in California. Regarding health care benefits, districts have been taking actions, such as capping employer contributions, that have helped contain their rising costs. Pension costs have been the most significant compensation pressure facing districts. Since 2013‑14, districts’ pension costs have increased by $4.7 billion—more than doubling. For 2020‑21, we expect total school district pension costs to increase by at least another $800 million. Looking beyond the budget year, district contributions to teacher pensions are scheduled to level off, whereas pension costs for other school staff are expected to continue increasing.
Most School Districts Have Positive Budget Ratings, a Few Are Fiscally Distressed. The vast majority of districts in California currently have positive budget ratings. Of the nearly 1,000 districts currently operating, the number with poor budget ratings is near a historic low. We identified 30 districts, however, as being in fiscal distress. Most of the county officials and superintendents we interviewed indicated that governance and management issues are common among these fiscally distressed districts. Breakdowns in governance, management, and contract negotiations generally are exacerbating these districts’ ability to respond to fiscal challenges.
Options for Addressing Cost Pressures
Notable Growth Projected in School Funding in 2020‑21. The Governor’s budget plan contains a total of $3.3 billion in new Proposition 98 (1988) funding for school districts ($1.4 billion ongoing and $1.9 billion one time). The Governor uses most of the ongoing funding increase to provide a cost‑of‑living adjustment (COLA) for the Local Control Funding Formula (LCFF). The Governor has many one‑time initiatives, but the largest are focused on addressing longstanding workforce shortages, student poverty, and student achievement gaps. We think the Governor’s proposed overall split of new ongoing and one‑time Proposition 98 spending in 2020‑21 is reasonable, but we think the Legislature has alternatives it could consider for addressing school districts’ cost pressures. Though the options we cover in this report are not exhaustive, they link to many of the core cost pressures districts are facing.
Options for Using New Ongoing Funding to Help Districts Address Cost Pressures. One option the Legislature could consider is funding a higher COLA for LCFF. This action would help all districts address ongoing compensation‑related pressures. It also would be simple to administer—avoiding the extra layer of start‑up costs associated with creating new ongoing programs. Another more targeted option would be for the Legislature to dedicate a portion of new ongoing funding to help districts address increases in their special education costs. A first step would be to “level up” funding rates for the lowest funded Special Education Local Plan Areas. (The Governor has a proposal in this area that we are in the midst of analyzing.)
Options for Using One‑Time Funding to Help Address Cost Pressures. Of all the Legislature’s options for one‑time initiatives, we believe making supplemental pension payments would provide the greatest sustained fiscal benefit for districts. The Legislature, however, has other options. One would be to provide one‑time grants conditioned on districts using them for unfunded retiree liabilities. Another would be to use one‑time funding to smooth out pension rate increases over the near term. Though inferior to the supplemental pension payment option, these other options would still help districts address existing liabilities and, in some cases, could improve district fiscal health. By comparison, most of the Governor’s one‑time Proposition 98 proposals would require districts to implement new programs or expand existing services. Lastly, we discourage the Legislature from using one‑time funding to provide special aid to fiscally distressed districts, as we believe a more effective strategy would be for the state and county offices of education to continue working with these districts to improve their budget practices.
Introduction
School Funding Projected to Grow Moderately Over Next Few Years. From 2013‑14 through 2018‑19, school funding in California grew significantly by historical standards. Over this period, annual growth in per‑pupil funding averaged 5.9 percent—substantially higher than the long‑run average of 3.8 percent (dating back to 1988‑89). In 2018‑19, funding per student was at an all‑time high of $11,690—$2,125 (22 percent) higher than 30 years earlier (after adjusting for inflation). As detailed in our report, The 2020‑21 Budget: The Fiscal Outlook for Schools and Community Colleges, we project somewhat slower growth in school funding moving forward. From 2019‑20 through 2023‑24, we project per‑pupil funding to grow at an average annual rate of 4.6 percent—slower than the past several years but still higher than the historical growth rate.
Report Focuses on School Districts’ Cost Pressures. Even with the exceptional growth in school funding in recent years, a few school districts have shown signs of fiscal distress. Were growth in school funding to slow in the coming years, more districts would face greater challenges balancing their budgets. In this report, we examine district budgets—both looking back at actual experiences to date and looking ahead at what experiences could be over the next few years. This report has four sections. First, we provide background on districts and their budgets. We then discuss trends in districts’ main cost drivers. Next, we examine overall district fiscal health, with a particular focus on districts in fiscal distress. In the final section, we identify some ways the Legislature could help school districts address their cost pressures moving forward. The primary objective of this report is to provide the Legislature with important context as it builds the 2020‑21 state budget.
Overview of District Budgets
Schools Rely Heavily on Proposition 98 Funding. In 2018‑19, schools received $101 billion in total funding, accounting for all fund sources. Proposition 98 funding—a combination of state General Fund and local property tax revenue—comprised almost 70 percent of that funding. Proposition 98 (1988) established a minimum annual funding level for schools and community colleges commonly known as the minimum guarantee. In most years, the state funds schools at or near the guarantee.
Other Funding Sources Have Grown Somewhat in Importance. In 2018‑19, the remainder of school funding came in roughly even shares from other state sources (notably, non‑Proposition 98 General Fund and special fund monies such as lottery revenue), other local sources (such as parcel tax revenue), and the federal government. Though schools rely heavily on Proposition 98 funding, the share of funding from other sources over the past several decades has increased. Thirty years ago, Proposition 98 accounted for nearly 80 percent of total funding. Key developments explaining the growth in non‑Proposition 98 funding include (1) the state’s increasing contributions to school pension and facility costs (both funded outside of Proposition 98), (2) the reduced vote threshold and additional authority school districts gained in the early 2000s to raise certain local revenues, and (3) a higher level of federal involvement in education as compared with the 1980s.
School District Attendance Ranges From Very Low to Very High. In 2018‑19, California had 944 public school districts serving 5.9 million students. School districts vary greatly in terms of student attendance, with the smallest district (Lincoln Elementary) serving 4 students and the largest district (Los Angeles Unified School District [LAUSD]) serving more than 400,000 students. A total of 553 districts are relatively small—each serving fewer than 2,500 students. By comparison, the largest 35 districts in the state each serve more than 25,000 students and together educate nearly 30 percent of all public school students in California. (These numbers exclude charter schools, as discussed below.)
Charter School Attendance Has Increased Significantly. Charter schools are public schools that operate under locally developed agreements (or “charters”) that determine what educational programs they will provide to students. In exchange for following these agreements, they are exempt from many of the state laws governing school districts. Most charter schools have their charters authorized by their local school district, though some charter schools are authorized by their county office of education (COE) or the State Board of Education. Charter schools have operated in California since 1992‑93. Currently, California has 1,299 charter schools. Charter school attendance has grown over time—reaching nearly 11 percent of total public school attendance in 2018‑19.
Most School Funding Is Linked to Student Attendance. School districts and charter schools receive the bulk of their funding through the state’s Local Control Funding Formula (LCFF). The formula provides districts and charter schools with a certain amount of funding per student. Each student generates base funding. Base per‑student funding rates generally increase across the grade spans, with high school students generating the highest rate. Students who are English learners (EL), low income (LI), foster youth, or homeless generate an additional 20 percent of the base rate. Districts with more than 55 percent of their enrollment EL/LI also receive 50 percent of the base rate for each EL/LI student above that threshold. Because most district funding is tied to student attendance, district budgets are particularly sensitive to fluctuations in attendance. To help school districts adjust to declining student attendance, the state funds districts at the higher of their current‑ or prior‑year attendance levels.
Special Education Is a Notable Part of School District Budgets. After LCFF, special education is the next largest state‑funded K‑12 program. The state allocates funding to Special Education Local Plan Areas (SELPAs) on a per‑student basis. Currently, the state has 132 SELPAs—consisting of 81 regional SELPAs (typically collaboratives of small and medium‑sized districts), 45 single‑district SELPAs, 5 SELPAs consisting exclusively of charter schools, and 1 unique SELPA serving students in Los Angeles County court schools. Unlike LCFF, special education funding rates are not consistent across the state, with rates in 2018‑19 ranging from $481 to $928 per student. Rates vary for historical reasons. Periodically, the state has provided funding to increase the rates of the lowest funded SELPAs.
Geography Also Affects School District Budgets. In California, some school districts are located in remote areas, whereas others are in highly urbanized areas. Some are located in hot desert areas, whereas others are in cold mountainous areas. Eastern Sierra Unified in Mono County, for example, covers 2,700 square miles with a total student population of less than 400. By comparison, Bellflower Unified in Los Angeles County covers only 7 square miles, has a total student population of nearly 12,000 and is surrounded by more than a dozen other school districts within a 10‑mile radius. These types of geographic attributes can affect districts’ (1) student attendance rates; (2) costs for home‑to‑school transportation, utilities, and internet connectivity; and (3) teacher recruitment, retention, and compensation. Compared to rural districts, urban districts can have lower per‑student costs in some budget areas, such as transportation and internet connectivity. They can have higher costs in other areas, such as teacher pay, given urban zones tend to have more competing job opportunities and higher living costs. Various factors, including pay, climate, and remoteness, can, in turn, affect teachers’ willingness to work in certain areas of the state, with rural areas and high‑poverty areas typically having a more difficult time finding teachers than other areas of the state.
Districts Are Responsible for Making Key Staffing Decisions. Each school district in California is governed by a locally elected board. Local governing boards set key district policies, including their staffing terms that can have a big impact on district budgets. In developing staffing terms, school districts (typically represented by the district superintendent, chief business officer, and other senior administrators) negotiate with employee unions. They negotiate staffing levels, class size, salaries, health care benefits, work year, and professional development days, among other items. Staffing and salary decisions, in turn, affect pension costs which are set as a percentage of payroll.
Charter Schools Usually Set Their Own Staffing Terms. When they open, charter schools decide their governance structure, which affects the level of autonomy they have from the school districts that authorize them. Nearly 75 percent of charter schools are incorporated as independent nonprofit organizations. These charter schools receive funding directly from the state and operate with a large measure of autonomy. Most of these charter schools are not unionized, with the management of these schools determining salaries and other terms of employment. In contrast, the remaining 25 percent of charter schools have a closer relationship to their authorizing school districts. In some of these cases, charter schools receive their funding directly from their authorizing district and adhere to the same collective bargaining agreements.
School Employees Are Part of One of Two Pension Systems. The California State Teachers’ Retirement System (CalSTRS) administers pension benefits for school teachers, administrators, and other certificated employees (such as nurses, librarians, and counselors), whereas the California Public Employees’ Retirement System (CalPERS) administers pension benefits for noncertificated employees (such as clerical staff). Of school employees in these pension systems, about 60 percent are members of CalSTRS, with the remainder members of CalPERS. CalSTRS members generally are not part of the federal Social Security retirement system, whereas CalPERS members generally are a part of that system. Some part‑time and charter school employees do not receive pension benefits through CalSTRS or CalPERS, but they may be part of Social Security.
Most School Employees Receive Health Benefits. In addition to pension benefits, active school employees typically receive health benefits (specifically medical, vision, and dental care) as part of their compensation. School districts vary, however, in terms of the share of cost they cover. Approximately half of teachers and other certificated employees participate in a health plan for which the district pays 100 percent of the premium. (Employees covered by these plans still pay some costs out of pocket, including copays.) Approximately 30 percent of teachers participate in plans for which the district pays between 80 percent and 99 percent of the premium. The remaining 20 percent of teachers participate in plans where the district pays a smaller share.
Most School Employees Are Eligible for Retiree Health Benefits. Most medium and large school districts and about one‑third of small school districts provide health benefits to retirees. Typically, the district provides retiree health benefits if the employee has (1) worked in the district for a minimum number of years (typically 10 to 15) and (2) reached a minimum age (typically 55). Districts generally provide health benefits until the retiree reaches age 65 and qualifies for Medicare. A few districts, however, provide lifetime health benefits. Most districts cover the cost of these benefits on a pay‑as‑you‑go basis, with only a few districts pre‑funding benefits as employees earn them. As a result, some districts have very large unfunded retiree health liabilities. Charter schools rarely provide retiree health benefits unless they have a close relationship with their authorizing school districts.
State Sets Minimum and Maximum Local Reserve Levels. The state expects districts to keep a minimum level of local reserves. The minimum local reserve level varies based on district size. Specifically, the minimum reserve ranges from 1 percent of total annual expenditures for the state’s largest school districts to 5 percent for the smallest school districts. In 2014, Proposition 2 established a state‑level Proposition 98 reserve. The state also for the first time set a maximum local reserve level. Local reserves are capped the year after the balance in the state Proposition 98 reserve equals at least 3 percent of total annual Proposition 98 school funding. When this threshold is met, medium and large school districts (those with 2,500 or more students) are limited to having local reserves that amount to no more than 10 percent of their annual expenditures. Smaller districts, districts that receive most of their funding from local property tax revenue (“basic aid” districts), and districts that can demonstrate “extraordinary fiscal circumstances” are exempt from the cap. (About 60 percent of districts fall into the first or second of these exemption categories.) To date, the cap has not been operative.
Core Cost Drivers
Below, we discuss trends in districts’ main cost drivers: student attendance, staffing levels, and staff compensation (salaries, pensions, and health care).
Student Attendance
Overall Attendance Has Been Declining. Student attendance grew at an average annual rate of 2.4 percent from the late 1980s to early 2000s, remained essentially flat from 2004‑05 through 2013‑14, and began declining in 2014‑15. A drop in the number of births (and underlying birth rates) has been one factor driving declines in the state’s school‑aged population. Total births in the state fell from 550,000 in 2008 to 500,000 in 2014 to 450,000 in 2018. Another factor that has driven declines is migration patterns. California has experienced net out‑migration of school‑aged children every year since 2013, with the annual decline deepening almost every year from 2013 through 2018.
Overall Attendance Is Projected to Continue Declining. Our projections have student attendance declining throughout the coming decade (Figure 1). Our projections assume that birth rates in California remain at historically low levels. In addition, we assume the state continues to experience a net out‑migration of school‑aged children at levels consistent with the past few years.
Attendance Trends Vary Among Counties. The overall trend in student attendance masks significant regional variation. In some parts of the state, student attendance has been decreasing notably. The most pronounced attendance declines in numerical terms have been in Los Angeles County, which had about 100,000 fewer students in 2018‑19 compared to 2013‑14 (a 7.4 percent decline); Orange County, which declined by about 20,000 students (4.7 percent); and Santa Clara County, which declined by about 10,000 students (4 percent). In other parts of the state, student attendance has been growing notably. The most pronounced growth in numerical terms has been in Kern County, which had about 15,000 more students (8.3 percent) in 2018‑19 compared to 2013‑14, and in San Joaquin County, which had about 10,000 more students (7.4 percent).
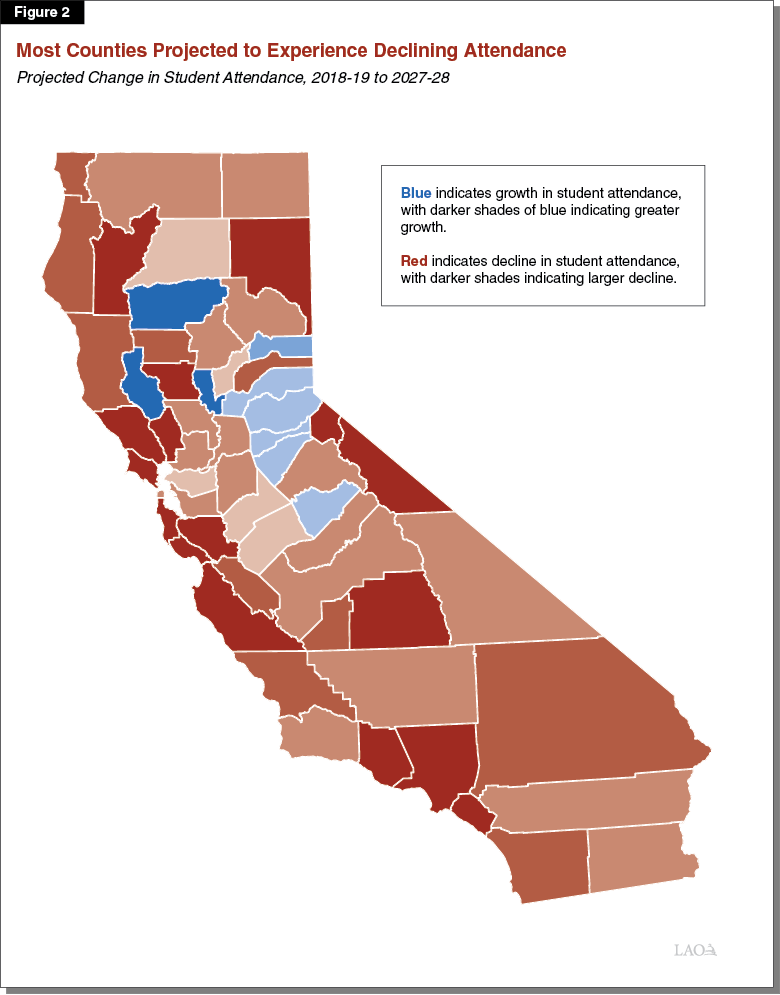
More Counties Projected to Decline Over the Next Decade. Under our projections, most counties that have been declining in recent years would experience even greater declines in the future, and many counties that have been growing would begin to experience small declines (Figure 2). For example, we project student attendance in Los Angeles County in 2027‑28 to be approximately 210,000 students (15 percent) lower compared to 2018‑19. Orange and Santa Clara Counties likewise experience large declines—dropping 66,000 students (14 percent) and 34,000 students (13 percent), respectively. In contrast to their recent growth trends, Kern and San Joaquin Counties also begin experiencing declines, though at much slower rates than other counties. (Demographic projections extending a decade into the future are subject to a relatively high level of uncertainty. Under alternative assumptions, such as those the Department of Finance makes for its projections, enrollment does not decline as quickly and a higher share of counties experience growth.)
Some Districts Have Seen Large Changes in Attendance. Consistent with county‑level attendance trends, the district with the largest attendance decline is LAUSD, which had about 77,000 fewer students in 2018‑19 compared to 2013‑14 (Figure 3). During the same time, San Diego Unified and Long Beach Unified each declined around 8,000 students. Whereas the districts that had the greatest declines were located in urban areas mostly in and around Los Angeles, the districts with the largest growth were spread across several areas of the state. (The counts shown in Figure 3 exclude all charter school attendance, even for the charter schools that receive funding directly from their authorizing district. We discuss charter attendance below.)
Figure 3
Certain School Districts Have Experienced
Notable Changes in Student Attendance
2018‑19 Attendance Relative to the 2013‑14 Level
|
School District |
County |
Overall Change |
|
Largest Declines |
||
|
Los Angeles Unified |
Los Angeles |
‑76,995 |
|
San Diego Unified |
San Diego |
‑8,107 |
|
Long Beach Unified |
Los Angeles |
‑7,919 |
|
Santa Ana Unified |
Orange |
‑6,754 |
|
Garden Grove Unified |
Orange |
‑4,782 |
|
Montebello Unified |
Los Angeles |
‑4,651 |
|
Fontana Unified |
San Bernardino |
‑3,767 |
|
Compton Unified |
Los Angeles |
‑3,686 |
|
Pomona Unified |
Los Angeles |
‑3,268 |
|
Capistrano Unified |
Orange |
‑3,105 |
|
Largest Increases |
||
|
Irvine Unified |
Orange |
4,823 |
|
Dublin Unified |
Alameda |
3,628 |
|
Kern High |
Kern |
3,284 |
|
Lammersville Joint Unified |
San Joaquin |
2,551 |
|
Clovis Unified |
Fresno |
2,446 |
|
Salinas Union High |
Monterey |
2,313 |
|
Beaumont Unified |
Riverside |
2,207 |
|
Ceres Unified |
Stanislaus |
1,829 |
|
Fremont Unified |
Alameda |
1,501 |
|
Santa Maria‑Bonita |
Santa Barbara |
1,428 |
In Some Districts, Charter School Attendance Is Growing. The district trends noted above mask intradistrict attendance shifts from district‑run schools to charter schools. Since 2013‑14, slightly more than a quarter of districts (26 percent) have experienced increases in charter school attendance. Overall charter school attendance in the state increased by 143,000 students from 2013‑14 through 2018‑19—raising charter school attendance from 8 percent to 10.5 percent of overall public school attendance. Despite the overall growth in charter attendance, 10 percent of districts saw a decline in charter school attendance, and 65 percent of districts still do not have a single charter school located within their boundaries.
Statewide Special Education Identification Rates Have Been Increasing. School districts are not only affected by overall student attendance but by the share of students identified for special education. Over the past ten years, the share of students statewide identified for special education services has increased from 11 percent to 13 percent. Much of this increase is attributable to the growing prevalence of autism, a disability that typically requires districts to provide intensive support, often with aides and specialists. The share of students identified with autism has increased from 1 in 600 students in 1997‑98 to about 1 in 50 students in 2018‑19. Many medical experts expect autism rates to continue increasing, thereby placing continued cost pressure on schools.
Identification Rates Vary Notably Among SELPAs. Overall special education identification rates among SELPAs range from 4.5 percent to almost 20 percent. The range is large for the incidence of students with mild disabilities and the incidence of students with severe disabilities. Whereas the incidence of students with relatively mild disabilities (such as stuttering and dyslexia) ranges across SELPAs from 4 percent to 15 percent, the incidence of students with relatively severe disabilities (such as having multiple disabilities, including autism) ranges from less than 0.5 percent to 5 percent.
Staffing Levels
Overall Teacher Workforce Has Been Increasing. School districts had about 295,000 full‑time equivalent (FTE) teachers in 2018‑19, an increase of about 18,000 (6.4 percent) over the 2013‑14 level. Coupled with the effects of declining student attendance, the statewide student‑to‑teacher ratio, in turn, has been dropping over the past several years. In 2018‑19, it stood at about 21:1—comparable to the level prior to the Great Recession. Similarly, by 2018‑19, the statewide student‑to‑administrator ratio (237:1) had dropped below pre‑recession levels. Given the return of staffing levels to pre‑recession levels, coupled with declining student attendance, the pressure to hire additional teachers and reduce class sizes is likely to subside over the coming years.
Greatest Growth Has Been in School Support Staff, Pressure Likely to Remain. The levels of school support staff, which include teacher aides, counselors, psychologists, social workers, nurses, office staff, and custodians, is at a historic high. School districts had about 242,000 FTE support staff in 2013‑14, compared to 294,000 in 2018‑19—a 21 percent increase. This increase includes about 19,000 more teacher aides, 7,300 more office staff, 2,600 more counselors, and 1,300 more psychologists. Some of the increase in support staff likely is due to adding back staff positions eliminated during the Great Recession. Some of the increase also is likely a response to a growing share of students with disabilities. Districts tend to hire additional teacher aides and specialists to support these students. Given the recent growth trend in special education, this staffing cost pressure is likely to remain, at least over the next few years.
Staff Compensation
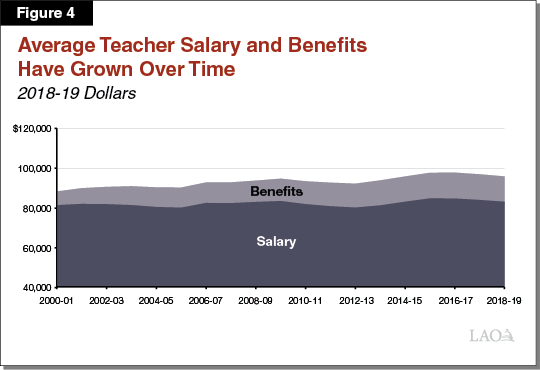
Average Teacher Salary Has Been on the Rise. In addition to hiring more teachers, most districts have been increasing staff salaries. We estimate that the average salary of a school district teacher in 2018‑19 was approximately $82,000, an increase of about $4,000 (5 percent) over the inflation‑adjusted 2013‑14 level (Figure 4). In 2017‑18 (the most recent year for which cross‑state data are available), California had the second highest average teacher salary in the nation—topped only by New York. (California’s ranking drops if adjusted for cost of living. Using the federal Bureau of Economic Analysis cost‑of‑living adjustments [COLAs], California ranks as the tenth highest state.)
Salary Changes Have Varied Among Districts, but Pressure Likely to Remain for All. About two‑thirds of districts experienced growth in teacher salaries between 2013‑14 and 2018‑19 (after accounting for inflation). The smallest districts, especially those with fewer than 12 teachers, were prone to the largest fluctuations. Inflation‑adjusted salary changes in these small districts ranged from a 38 percent increase to a 24 percent decline. Changes in larger districts during this time were more moderate but still notable. For example, among the 25 largest school districts, inflation‑adjusted salary changes ranged from a 9 percent increase to a 5 percent decline. Despite these variations in recent salary trends among districts, we expect most, if not all, districts to face pressure moving forward to increase teacher (and other staff) salaries because housing and other personal costs of living in California are likely to remain relatively high.
School Districts Have Been Taking Actions to Contain Rising Health Care Costs. Two decades ago, the cost of health benefits was one of the biggest cost pressures facing districts. Between 2000‑01 and 2003‑04, districts’ average benefit costs rose by 10 percent each year after inflation. Between 2004‑05 and 2012‑13, districts’ cost increases slowed to an average annual increase of 2.5 percent after inflation. Between 2013‑14 and 2018‑19, districts’ cost increases slowed further to 1 percent after inflation. Some districts have moderated their spending on health benefits by implementing certain cost‑containment measures, including capping employer contributions. In recent years, districts’ health care cost increases have been about 1 percentage point lower than the increase in total statewide spending on health care—indicating their cost‑containment measures are having some effect.
Districts Face Retiree Health Liabilities. Because most districts have not set aside money during their employees’ working careers to cover their retiree health costs, they have unfunded retiree health liabilities. By deferring these payments, we estimate school districts have accrued an unfunded liability exceeding $24 billion statewide. Though the majority of this liability is attributable to approximately a dozen large school districts, nearly all districts that offer retiree health benefits have at least some unfunded liability. In 2017‑18, the latest year for which data are available, school districts spent more than $1 billion on retiree health benefits. This amount is likely to grow more quickly than inflation moving forward as districts pay the obligations associated with their unfunded liability. The few districts that have prefunded their retiree health benefits, by contrast, are expected to face smaller cost increases moving forward.
Pension Costs Have Been Growing, but Slower Growth Expected Over Next Few Years. Like many other pension systems around the country, CalSTRS and CalPERS have unfunded liabilities. As with retiree health liabilities, unfunded pension liabilities occur when assets on hand are less than the estimated cost of benefits earned to date. In 2013‑14, the Legislature enacted a plan to pay down the CalSTRS unfunded liability within about 30 years by ramping up pension contributions from districts, teachers, and the state. Over the same period, district contributions to CalPERS also have increased to address unfunded liabilities. For 2019‑20, we estimate total school district pension contributions will be approximately $7.9 billion, an increase of $4.7 billion over the 2013‑14 level. For 2020‑21, we expect total school district pension costs to increase by another $800 million to $1 billion. The exact amount depends on various factors, including districts’ salary decisions and future investment returns. Looking beyond the budget year, district contribution rates to CalSTRS are scheduled under current law to level off. District contributions to CalPERS, however, are likely to continue increasing at a steady pace for the next several years—likely in the range of a few hundred million dollars per year. (These estimates account for the additional pension payments the state made on districts’ behalf as part of the 2019‑20 budget plan.)
Districts in Fiscal Distress
School Districts Have Budgets Reviewed and Rated. Before the start of each fiscal year, districts are required to submit their locally developed budget plans to their respective COEs for review. COEs are tasked with approving, conditionally approving, or disapproving these budgets. In making their determinations, COEs consider ten core indicators of district fiscal health, including reserve levels and changes in salary and benefit costs. During the fiscal year, districts are required to submit two budget updates (or “interim reports”) to their COE—one in the fall and the other in the spring. For each of these budget updates, COEs assign a positive, qualified, or negative certification. A positive rating indicates a district will meet its financial obligations in the current year and subsequent two years. A qualified rating indicates a district might not meet its obligations over this period, whereas a negative rating indicates a district will be unable to meet its obligations in the current year or following year.
Districts With Poor Budget Ratings Receive Intensified COE Support and Intervention. Districts with qualified and negative budget ratings are subject to escalating COE oversight and intervention. If a district ultimately is unable to pay its bills, its local school board may request an emergency state loan. If the Legislature and Governor decide to approve the request, the loan is authorized through a state appropriations bill. Upon receiving a state loan, the local governing board loses its authority and an administrator is appointed to run the district. The applicable county superintendent of schools, with the concurrence of the state Superintendent of Public Instruction and the president of the State Board of Education, appoints the administrator. The administrator typically cedes power back to the district gradually over several years after the local board has demonstrated good management in five specified areas (including financial management and facilities management).
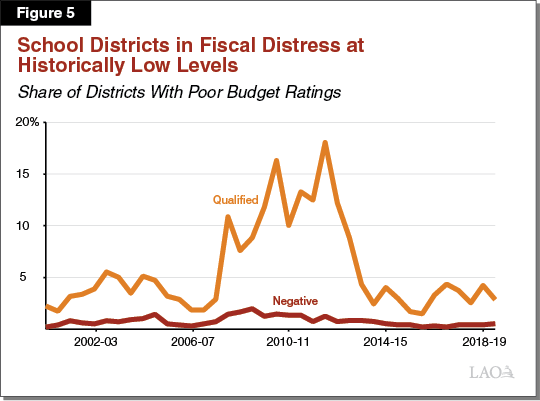
School Districts With Poor Budget Ratings Are at Historically Low Levels. The vast majority of districts in California have positive budget ratings. Of the nearly 1,000 districts currently operating, only five received a negative fiscal rating in the spring 2018‑19 reporting cycle. An additional 27 received qualified ratings. As Figure 5 shows, the share of districts currently in distress is near a historic low and significantly below the peak during the Great Recession. The historically strong growth in school funding since 2013‑14 likely is one reason so few districts have poor budget ratings today. Another reason is likely that many districts are well managed, with a consistent focus on good management practices. Most districts, for example, have accurate budget projections and deliberately plan for cost increases in key areas such as pensions and special education.
Only a Few Districts Are Chronically Distressed. Though more than 150 districts have received a negative or qualified rating at least once since 2013‑14, few districts receive poor ratings consistently. Several consecutive poor budget ratings, however, can signal substantial district problems and potentially even have implications for the state budget were one of these districts to require an emergency state loan. For these reasons, we undertook a deeper analysis of “chronically distressed” districts. We defined a chronically distressed district as one that received (1) two or more qualified or negative ratings since the first interim report of 2016‑17 or (2) two consecutive negative ratings in 2018‑19. Figure 6 shows the 30 districts meeting one of these criteria.
Figure 6
A Profile of 30 Chronically
Distressed Districts
|
District Name |
Average Daily |
|
Elementary School Districts |
|
|
Feather Falls Union Elementary |
9 |
|
Bangor Union Elementary |
99 |
|
Sausalito Elementary |
108 |
|
San Miguel Joint Union Elementary |
590 |
|
Gold Trail Union Elementary |
629 |
|
Cascade Union Elementary |
990 |
|
Santa Rosa Elementary |
3,424 |
|
Alum Rock Union Elementary |
8,835 |
|
High School Districts |
|
|
West Sonoma County Union High |
1,703 |
|
Santa Rosa High |
10,101 |
|
Sweetwater Union High |
36,930 |
|
Unified School Districts |
|
|
Klamath‑Trinity Joint Unified |
899 |
|
Black Oak Mine Unified |
976 |
|
Yosemite Unified |
1,464 |
|
Mountain Empire Unified |
1,617 |
|
Gateway Unified |
2,101 |
|
Bonsall Unified |
2,311 |
|
Calaveras Unified |
2,648 |
|
Southern Kern Unified |
3,343 |
|
Newark Unified |
5,549 |
|
Inglewood Unified |
7,407 |
|
Vallejo City Unified |
10,877 |
|
Burbank Unified |
14,540 |
|
Oceanside Unified |
16,697 |
|
Coachella Valley Unified |
16,916 |
|
San Marcos Unified |
20,086 |
|
Temecula Valley Unified |
26,649 |
|
Oakland Unified |
32,513 |
|
Sacramento City Unified |
38,190 |
|
Los Angeles Unified |
410,133 |
Chronically Distressed Districts Come in All Sizes. As Figure 6 shows, among the 30 chronically distressed districts are the state’s largest district and some of its smallest. Chronically distressed districts, however, tend to be relatively large. In 2018‑19, student attendance in the median chronically distressed district was 3,383, compared to 1,525 for all other districts. About one‑third of chronically distressed districts enrolled more than 10,000 students, compared to 15 percent of all other districts. Of all public school students in the state, 13 percent attend chronically distressed districts.
Chronically Distressed Districts Have Two Other Common Student Characteristics. Whereas about 60 percent of all districts in California are experiencing declining student attendance, more than 80 percent of chronically distressed districts are declining. Excluding LAUSD, chronically distressed districts, however, tend to decline at rates similar to other declining districts. In 2018‑19, student attendance in the 24 chronically distressed districts with declining attendance (apart from LAUSD) was an average of 11 percent smaller compared to 2013‑14 levels, almost identical to the drop among all other declining districts in the state. (LAUSD declined by 16 percent over this period.) In addition to being more likely to have declining student attendance, chronically distressed districts tend to have slightly larger shares of EL/LI students and foster youth than other districts. In 2018‑19, 64 percent of students in chronically distressed districts fell into at least one of these categories, compared to 60 percent of students in all other districts.
Governance and Management Are Key Issues in Chronically Distressed Districts. Most of the county officials and superintendents we interviewed over the past several months indicated that governance and management issues are common among chronically distressed districts. One notable issue is high turnover among executive staff and poor executive relations. In a review of the most recent available interim reports from 23 chronically distressed districts, nearly half reported turnover in their district superintendent or chief business officer within the past 12 months. Another common characteristic is a lack of fiscal expertise. Chronically distressed districts often make poor budget projections—overestimating their enrollment and underestimating their costs—and sometimes enter into labor agreements that they cannot sustain on an ongoing basis. Although all districts in the state face fiscal pressures, chronically distressed districts—with deadlocked, inconsistent, or otherwise ineffective leadership—are less likely to have the tools needed to respond to these challenges.
Options for Addressing Cost Pressures
Governor’s Budget Takes Certain Approaches to Addressing School Districts’ Cost Pressures. The Newsom Administration recently released its 2020‑21 budget plan for school districts. The plan contains a total of $3.3 billion in new Proposition 98 funding for school districts. Of this amount, the Governor proposes using $1.4 billion for ongoing purposes and $1.9 billion for one‑time initiatives. The Governor uses most of the ongoing funding increase to provide a COLA for LCFF. The Governor has many one‑time initiatives but the largest are focused on addressing longstanding workforce shortages, student poverty, and student achievement gaps. Under the Governor’s budget plan, per‑student funding reaches $12,619—increasing about $500 (4.1 percent) from the previous year. Over the coming months, the Legislature will hear from many school groups in response to the Governor’s proposals. The information provided in this report is intended to help legislators have a better foundation of knowledge that they can draw upon in responding both to the Governor’s and school groups’ funding requests. This report also is intended to help the Legislature be proactive in considering its highest budget priorities for school districts.
A Few Options the Legislature Could Begin Considering. We dedicate the rest of this report to identifying a few options the Legislature could begin considering for using new Proposition 98 funding in ways that help address school districts’ cost pressures in 2020‑21. Consistent with the guidance we offered in our November report, The 2020‑21 Budget: The Fiscal Outlook for Schools and Community Colleges, we think the Governor’s proposed overall split of new ongoing and one‑time Proposition 98 spending is reasonable. Below, we discuss options for new ongoing spending, as well as new one‑time spending. Though the options are not exhaustive, they link to many of the core cost pressures we discussed earlier in this report. In the weeks to come, our office will provide more detailed analysis to help the Legislature in making its specific 2020‑21 budget decisions.
Allocating New Funding Through LCFF Would Help All Districts Address Compensation Pressures. Given that additional ongoing Proposition 98 funding is available, one key decision the Legislature faces is how much of the new funding to provide through LCFF. Allocating more funding through LCFF would help all districts address some of their key cost pressures, including their salary, health care, and pension costs. The lower the statutory COLA for LCFF, the more difficulty districts will have covering these pressures. Pension costs alone, for example, are estimated to increase by at least $800 million in 2020‑21. If the statutory COLA were low and Legislature were to provide no other ongoing increase in general purpose funding, most school districts likely would need to dedicate nearly all of their additional LCFF funding to covering higher pension costs. Providing additional funding for LCFF would ease some of this pressure. Providing funding through LCFF also gives districts some flexibility to use funding in ways that best fit their local budget‑balancing strategies, whether that be, for example, increasing salaries, renegotiating health premiums, or beginning to prefund retiree health liabilities. It also would be simple to administer—avoiding the extra layer of start‑up costs associated with creating new ongoing programs.
Increasing Special Education Funding Rates Helps Address Cost Pressures Too. In addition to rising pension costs, many school districts have expressed concern with increases in their special education identification rates and associated costs. The first step in addressing this issue would be targeting a portion of new ongoing funding for special education equalization. To address historical inequities, the Legislature typically “levels up” funding rates to a certain percentile of district rates. We estimate that funding all districts at the 90th percentile of existing per‑pupil rates would cost about $150 million. The advantage of equalization is that most districts in the state would benefit, but those with the lowest per‑pupil rates would benefit the most. Such an approach builds upon actions the state took in 2019‑20. (The Governor has a 2020‑21 proposal to create a new special education funding formula that would increase rates for most SELPAs. We are in the midst of evaluating this proposal and plan to release an assessment of it in our forthcoming February report, the “Proposition 98 Education Analysis.”)
Supplemental Pension Payments Also Would Help All Districts Address Compensation Pressures. Many school districts regard higher pension costs as their most significant fiscal challenge. To further address this issue, the Legislature could set aside a portion of new one‑time Proposition 98 funding for paying down districts’ unfunded pension liabilities more quickly. To accomplish such acceleration, the payments would need to supplement the previously scheduled increases in district and state contributions for 2020‑21. Supplemental payments would both improve the funding status of the pension systems and tend to lower district pension contributions over the next few decades—making district budgets easier to balance on a sustained basis. Moreover, supplemental payments would build upon state actions taken in 2019‑20. Of all the Legislature’s one‑time district spending options, we believe supplemental pension payments would provide the greatest sustained fiscal benefit to districts.
Other Options for Helping Districts With Unfunded Liabilities. The Legislature, however, has secondary options it could consider. One of these options is to provide districts with one‑time grants conditioned on them using the funds for any unfunded retiree liabilities or future pension rate increases (potentially resulting from a temporary economic downturn that has lowered investment returns). Under this option, the Legislature does not provide relief directly but creates a structure for districts to achieve such relief locally. Another option the Legislature could consider is using one‑time funding directly to smooth out pension rate increases over the near term. CalSTRS rates, for example, are projected to rise from 17.1 percent in 2019‑20 to 18.4 percent in 2020‑21, before dropping to 18.1 percent in 2021‑22. Though we believe these secondary options are inferior to using one‑time Proposition 98 funding for supplemental pension payments, they still would help districts address existing liabilities and, in some cases, could improve district fiscal health. By comparison, most of the one‑time proposals in the Governor’s budget would require districts to implement new programs or expand existing services.
State Efforts to Address Cost Pressures Should Reinforce Good Fiscal Practices. In making its allocation decisions, we advise the Legislature to maintain strong incentives for local governing boards to remain responsible for district fiscal health. School funding has grown at historically high rates since 2013‑14, and growth is projected to remain above average in 2020‑21. The vast majority of districts continue to have positive budget ratings. As this report has shown, all districts face cost pressures. The key tends to be in how districts respond to and manage those pressures. Whereas most districts are making the decisions necessary to maintain balanced budgets, a few districts are in poor fiscal condition. These districts tend to have poor budgeting practices, typically linked with governance and management problems. Rather than providing state funding targeted to these districts, we believe a more effective strategy would be for the state and COEs to continue working with these districts to improve their budget practices.