LAO Contact

February 15, 2023
The 2023-24 Budget
Department of Developmental Services
Summary
The Department of Developmental Services (DDS) coordinates a wide variety of services for about 400,000 Californians with intellectual or developmental disabilities or similar conditions. In this brief, we provide some basic background on DDS before describing and assessing the Governor’s 2023‑24 budget proposals for the department. Relative to other recent budgets, the Governor’s proposal contains relatively fewer major new initiatives and we do not find major issues with these or with the administration’s underlying caseload assumptions.
Recognizing that the state has in recent years undertaken a wide variety of policy initiatives related to DDS, we dedicate the majority of this brief to ongoing oversight and implementation issues. In particular, we provide background and issues for legislative consideration on the following six issues: (1) implementing service provider rate reform, (2) addressing racial/ethnic and other disparities in the per‑person amounts spent on services, (3) complying with the federal Home‑ and Community‑Based Services (HCBS) final rule, (4) complying with required service coordinator caseload ratios, (5) encouraging employment opportunities for DDS consumers, and (6) rolling out the Self‑Determination Program (SDP).
Background
Lanterman Act Lays Foundation for “Statutory Entitlement.” California’s Lanterman Developmental Disabilities Services Act (Lanterman Act) originally was passed in 1969 and substantially revised in 1977. It amounts to a statutory entitlement to services and supports for individuals ages three and older who have a qualifying developmental disability. Qualifying disabilities include autism, epilepsy, cerebral palsy, intellectual disabilities, and other conditions closely related to intellectual disabilities that require similar treatment, such as traumatic brain injuries. To qualify, an individual must have a disability that is substantial, expected to continue indefinitely, and which began before the age of 18. There are no income‑related eligibility criteria. As of December 2022, DDS serves about 330,000 Lanterman‑eligible individuals and another 2,900 children ages three and four who are provisionally eligible.
California Early Intervention Services Act Ensures Services for Eligible Infants and Toddlers. DDS also provides services via its Early Start program to any infant or toddler under the age of three with a qualifying developmental delay or who are at risk of developmental disability. There are no income‑related eligibility criteria. As of December 2022, DDS serves about 50,000 infants and toddlers in the Early Start program.
Regional Centers (RCs) Coordinate and Pay for Individuals’ Services. DDS contracts with 21 nonprofit RCs, which coordinate and pay for the direct services provided to “consumers” (the term used in statute). Services are delivered by a large network of private for‑profit and nonprofit providers. In addition to state General Fund and some smaller funding sources, these services are purchased in part through federal funding obtained through the Medicaid HCBS waiver, described below.
Governor’s Budget
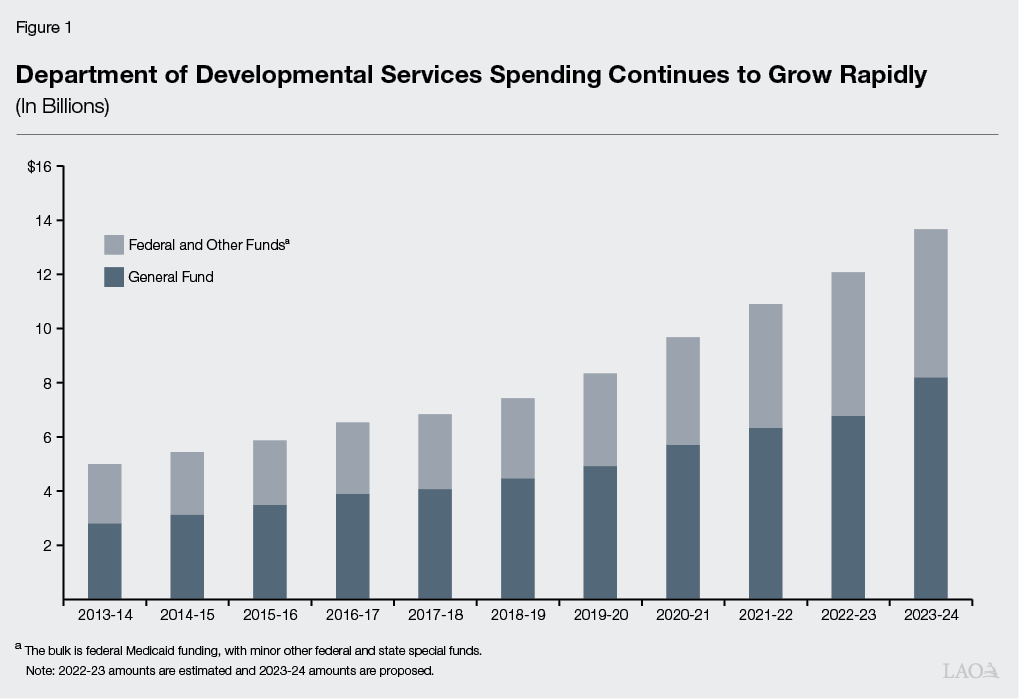
Proposed Budget Reflects Significant Growth. The Governor’s budget proposal includes $13.6 billion total funds in 2023‑24, up $1.6 billion (13 percent) over the revised 2022‑23 level ($12.1 billion). Of the proposed 2023‑24 total, $8.2 billion is from the General Fund, up $1.4 billion (21 percent) over the revised 2022‑23 level ($6.7 billion General Fund). This significant year‑over‑year growth in DDS spending follows the spending growth trend over the past ten years, as shown in Figure 1. Primary drivers of the year‑over‑year General Fund growth include: growth in caseload, increased utilization of services, additional costs for ramping up 2022‑23 initiatives, and the expiration of a temporary 6.2 percentage point increase in federal Medicaid funding. (The proposed budget assumes this temporary increase, which was initially tied to the federal public health emergency declaration, ends June 30, resulting in General Fund costs beginning at the start of 2023‑24. However, based on recent federal actions, we now expect this increase to gradually wind down throughout 2023, before being phased out completely by January 2024. We estimate this change will increase General Fund costs by about $20 million in 2022‑23 and decrease them by about $60 million in 2023‑24 relative to the Governor’s budget.) The administration’s caseload projection is consistent both with our office’s projection and with longstanding trends.
Includes Relatively Few Proposals for New Spending. Relative to recent years, the proposed budget contains fewer major initiatives. Among the most notable proposals for new spending are:
- Enhancing the Safety Net for Consumers With Relatively Severe Needs. The budget contains several related proposals—including $15.9 million ($9.8 General Fund) one time to convert some care facilities to a higher level of intensity and $1.6 million ($1.1 million General Fund) ongoing to better support foster children in DDS—intended to enhance the state’s service options for consumers with relatively severe needs. These proposals are consistent with a broader effort to serve these individuals in more integrated settings following the closure of most of the state’s Developmental Centers (DCs).
- Establishing an Autism Services Branch Within DDS. The budget provides $1 million ($800,000 General Fund) ongoing for six state‑level positions focused on autism. This proposal is intended to help the state better track current science so as to better serve its most rapidly growing subpopulation of DDS consumers.
Proposes Delaying Preschool Inclusion Grants by Two Years as a Budget Solution. The 2022‑23 budget package included $20 million General Fund over two years for grants to enable preschool programs to include more children with exceptional needs. The Governor proposes delaying the implementation of this two‑year program until 2024‑25. In last year’s analysis, we raised several issues with the design of these grants—all of these concerns still apply. Given the Governor’s budget projects multiyear deficits (in addition to the current budget problem), the Legislature may wish to consider eliminating this program.
Proposals Generally Reasonable. Aside from our ongoing reservations about the preschool inclusion grant program (noted above), we do not have any serious concerns or questions about the Governor’s proposals at this time.
DDS Oversight Issues
In recent years, the DDS system has undergone some significant changes that warrant continued legislative oversight. Below, we highlight six areas of particular interest for the Legislature: (1) implementing service provider rate reform, (2) addressing racial/ethnic and other disparities in the per‑person amounts spent on services, (3) complying with the federal HCBS final rule, (4) complying with required service coordinator caseload ratios, (5) encouraging employment opportunities for DDS consumers, and (6) rolling out SDP. For each, we provide some general background and updates on the implementation of recent policy or spending initiatives. We also raise issues for legislative consideration.
Implementing Service Provider Rate Reform
Background
State Recently Began Implementing a Major Overhaul of Service Provider Rates. For decades, the state paid DDS service providers according to an outdated and overly complicated rate structure. In an attempt to modernize and rationalize this structure, the state commissioned a study of service provider costs. This study was published in January 2020. The 2021‑22 budget initiated a five‑year plan to phase in that study’s rate models. The 2022‑23 budget accelerated this phase‑in to become a four‑year plan. The Governor’s budget proposal maintains the accelerated time line, including $1.2 billion total funds ($230 million General Fund) in 2023‑24 for further implementation of the rate study. Full implementation of the new rate system is expected by July 1, 2024.
Once Fully Implemented, Rate Reform Must Include New Quality Incentive Structure. Following full implementation of the new rate system, statute requires that 10 percent of each service provider rate be reserved for a “quality incentive payment.” These payments are to be tied to performance metrics specific to each category of provider. These metrics and associated standards are to be determined by a workgroup of stakeholders led by DDS. (Prior to the full implementation of the quality incentive payment as 10 percent of the total rate, the state began providing some smaller quality incentive payments on top of providers’ typical rates in 2022‑23.)
Issues
State Still Faces Major Questions About Quality Incentive Structure. Developing the incentive structure poses significant challenges. These include determining appropriate measures for each provider category and developing a reasonable plan for collecting relevant data. Although the administration has voiced confidence in the workgroup’s ability to meet the time line to develop the incentive structure, we have heard concerns from stakeholders that meeting the time line (which has been accelerated by one year relative to the initial rate study implementation plan) will prove difficult. In particular, we have heard concerns that providers will have insufficient time to familiarize themselves with new outcome measurements and performance standards before being subject to potential downward adjustments in their rates received.
In addition, many service providers have expressed concerns about the size of the proposed incentive payments. In some cases, the 10 percent reserved for incentive payments would exceed the difference between old and new provider rates, meaning providers who do not meet quality standards may see their rates adjusted to below the level they saw pre‑reform. As providers do not yet know the standards they will be asked to meet, the risk of an overall downward adjustment in rates causes considerable concern. Given these challenges, the Legislature may wish to reconsider the time line or structure of the quality incentive program to provide the workgroup additional time to review all potential options and providers additional time to familiarize themselves with new measurements and standards. (We raised significant concerns about the quality incentive program in a previous analysis, and this analysis could help inform some current policy discussions.)
Additional Questions About Underlying Rate Models. In addition to concerns about the quality incentive program being developed, we have heard several concerns about the underlying rate models. For example, we have heard that the inputs used in some rate models may be inappropriate. This is most evident in the rate for Independent Living Services, which assumes staffing costs equivalent to Supported Living Services despite the former being a much more intensive service model. In addition, we have heard concerns about the lack of ongoing inflation adjustments. In a recent report, we provide a framework for the Legislature to weigh such inflation‑related concerns against the state’s broader fiscal interests.
Addressing Spending Disparities
Background
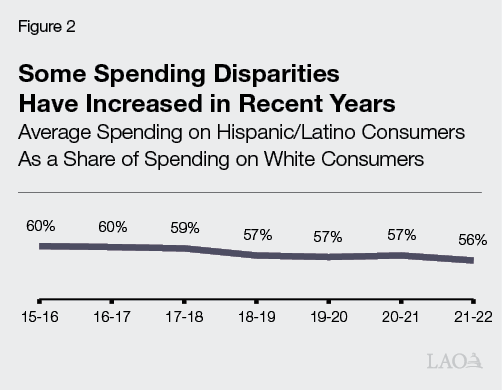
Longstanding Interest in Disparities in the Amount of Spending on Services Among Racial/Ethnic Groups. Starting in 2011‑12, state law requires all RCs to annually publish data on the amount spent on services for consumers disaggregated by the race/ethnicity of these consumers. These data consistently have shown large disparities in the average amounts spent among these groups. In particular, spending for Hispanic/Latino consumers is about half that for white consumers on average.
State Provides Ongoing Grants to Address Spending Disparities. The state has allocated $11 million annually since 2016‑17 ($77 million to date) for “equity grants” to help close disparities in spending. As part of the 2021‑22 spending plan, the state also required DDS to contract with a research entity to evaluate the effectiveness of these grants. The state recently contracted with a team from Georgetown University to develop that study.
Issues
In Spite of Funding for Equity Grants, Racial/Ethnic Spending Disparities Persist. Unfortunately, the available data suggest relatively little movement in terms of reducing spending disparities since equity grants were first introduced. In fact, Figure 2 shows the disparity in average spending per Hispanic/Latino consumer as a share of the average spending per white consumer has actually widened since 2015‑16.
State Lacks Insight Into Drivers of These Disparities in Spending. One potential reason the ongoing equity grants have not yet addressed spending disparities is that they are not guided by a clear understanding of why such disparities exist. Although the administration has pointed to some factors which explain a share of the overall disparities (most notably, that Latino/Hispanic consumers are more likely than white consumers to live with their parents and thus consume fewer residential services), to date, no attempt has been made to document comprehensively the drivers of disparities and to quantify their likely effects. The Legislature may wish to consider its options for developing such a study, which could be used as the basis for a more coordinated effort to address disparities.
Compliance With HCBS Final Rule
Background
Nearly All Types of RC‑Coordinated HCBS Services Are Eligible for Federal Funding. HCBS services are considered services and supports that allow an individual to live in community‑based settings, rather than in institutional settings. They include residential services, independent and supported living services, day programs, transportation, supported employment, and respite. Nearly all types of RC‑coordinated services are considered HCBS and are eligible to receive federal HCBS funding (when provided to a consumer enrolled in Medi‑Cal, the state’s Medicaid program).
Service Provider Compliance With New Federal Rule Required to Draw Down Federal Medicaid Funding. The federal Centers for Medicare and Medicaid Services approved a new rule in 2014 that requires states to ensure that any Medicaid‑funded HCBS services promote person‑centered planning, individual choice, and increased independence and are provided in the most integrated setting possible. The rule, originally set to take effect in 2019, has been pushed back twice, with the first key date set for March 17, 2023, when all service providers must have adopted policies consistent with the final rule.
State Provides Grants to Assist Providers in Reaching Compliance. Chapter 3 of 2016 (AB X2 1, Thurmond.) provided DDS $11 million General Fund annually to support grants for service providers to modify their programs and services to make them compliant with the final HCBS rule.
Issues
Many Providers Still Are Not in Compliance With HCBS Final Rule Set to Take Effect in March. Figure 3 shows the share of providers (broken out by service category) who have compliant policies set in place as of December 29, 2022. (The figure also shows that almost all service providers required by DDS to have an assessment of their level of compliance with the federal HCBS requirements have done so.) Although a large number of providers remain out of compliance, DDS indicates that they are providing outreach and technical assistance to these providers and are seeing compliance rates consistently improve. (The department indicates they will have updated compliance data to share in the coming weeks.) A recent communication from DDS to RCs stated that noncompliant providers could no longer receive new referrals as of March 17, providing an additional incentive for providers to develop new policies.
Figure 3
Many Services Providers Not Yet in Full Compliance With
Home‑ and Community‑Based Services Final Rule
As of December 29, 2022
|
Service Type |
Completed Assessment? |
Have Compliant Policies? |
|||
|
Identified for |
Completed |
Yes (%) |
Not At All or |
||
|
Residential |
5,006 |
96% |
47% |
53% |
|
|
Day Service |
1,907 |
98 |
58 |
42 |
|
|
Supported Employment |
134 |
99 |
70 |
30 |
|
|
Work Activity Program |
40 |
100 |
70 |
30 |
|
|
Overall |
7,087 |
97% |
50% |
50% |
|
Compliance With Caseload Ratios
Background
Statute Stipulates Caseload Size for RCs’ Service Coordinators. Statute sets the following average service coordinator‑to‑consumer ratios for RCs:
- 1:62 for consumers enrolled in Medicaid HCBS waiver programs.
- 1:40 for children five years of age or younger.
- 1:25 for consumers who have complex needs.
- 1:66 for all others.
The state also still requires specific caseload ratios for consumers who recently transitioned out of a DC, but these ratios were largely rendered obsolete when the state closed its last large DC in January 2020. In addition, the 2021‑22 budget included $10 million ongoing to implement service coordinator‑to‑consumer ratios of 1:40 for consumers who have a low level or no services purchased by RCs (on the basis that these consumers may be underserved). However, this caseload ratio was not stipulated in statute.
Issues
All RCs Still Working to Meet New Caseload Ratios for Young Children. Figure 4 shows the average caseload ratios for young children at each of the RCs. As of October 2022, no RC was meeting the new 1:40 standard, suggesting all likely will have to hire additional service coordinators to reach compliance.
.png)
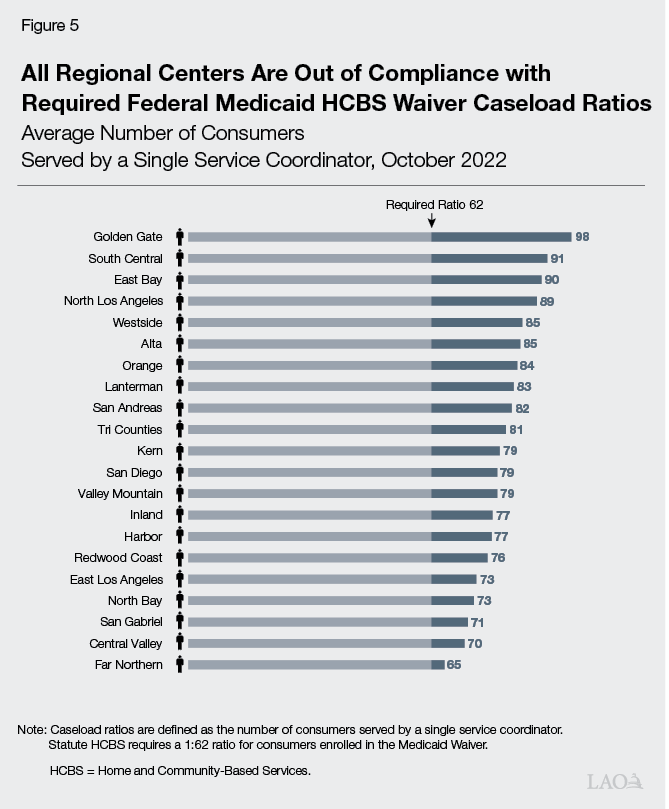
Current HCBS Caseload Ratios Risk Loss of Federal Funding. The state’s funding agreement with the federal government caps caseloads for consumers on the HCBS waiver at 62 per service coordinator, but Figure 5 shows that no RC was in compliance with this ratio as of October 2022. This is not an anomaly—HCBS caseload ratios have been out of compliance for multiple years. Although the federal government has not taken any action against California as of yet, history suggests these out‑of‑compliance ratios put federal funding at risk. For example, in 1997, the federal government found that RCs had numerous quality problems. In response, the federal government froze enrollment in the HCBS waiver program until RCs implemented agreed‑upon changes, which meant the state could not access federal matching funds for services provided to consumers who otherwise would have been new waiver enrollees. When the freeze was fully lifted several years later, DDS estimated the state had foregone nearly $1 billion in federal funding. At that time, the federal government and California agreed to limit the size of caseloads as one way to avoid compromising the quality of RC services.
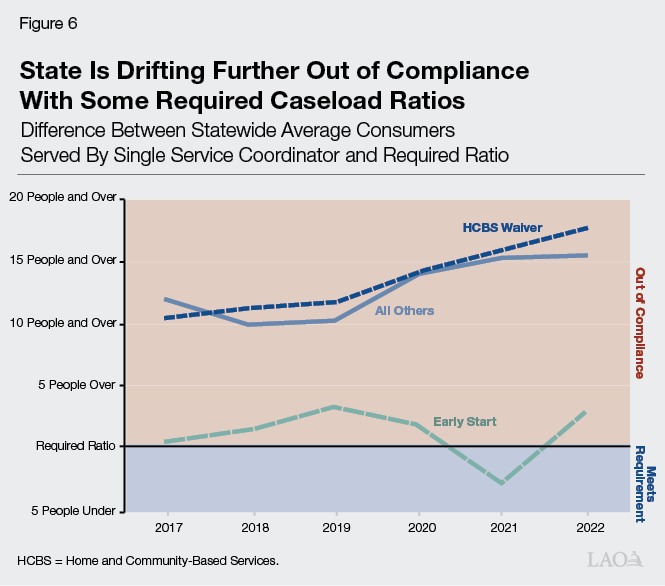
State Has Not Made Progress in Reaching Required Caseload Ratios in Recent Years. Figure 6 shows the number of people above the required statutory ratios for three service categories between 2017 and 2022 (these categories were selected because they maintained a consistent definition and required ratio over that time period). Of these three categories, the state was closest to reaching compliance for Early Start, but the previously required ratio of 1:62 for this population was superseded in late 2022 by the new 1:40 required ratio for any consumer under the age of six.
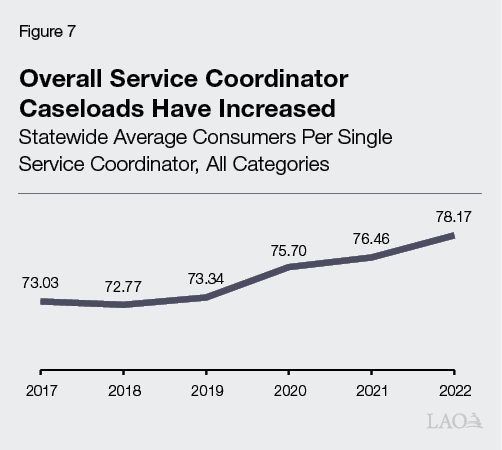
Increasingly Out‑of‑Compliance Caseload Ratios Suggest Case for Revisiting Core Staffing Formula. The state allocates funding for RC operations primarily through the core staffing formula, the inputs for which largely have not been updated since the 1990s. Regardless of their funding level, RCs must offer a competitive salary to attract service coordinator candidates. Consequently, the difference between the amount the state allocates for service coordinators and the amount RCs actually pay has grown over the past several decades. In part, RCs have made ends meet by redirecting funds awarded to them from obsolete portions of the core staffing formula (mostly those related to specific secretarial work that, in the age of computers, no longer requires full‑time staff). The state also has responded to caseload challenges by providing targeted supplements, such as using a higher service coordinator salary assumption for the recent move towards smaller caseloads for young children. However, in spite of these funding augmentations, rising salary costs alongside the consistent growth in the population served have resulted in gradually increasing average caseloads for service coordinators, as Figure 7 illustrates. Given the challenges related to the current formula for staffing, the Legislature may wish to consider other options for addressing this problem.
Encouraging Employment Opportunities for DDS Consumers
Background
Relatively Few DDS Consumers Are Employed. According to Employment Development Department data presented on DDS’s RC Oversight Dashboard, the employment rate for people with developmental disabilities in California increased somewhat from 17 percent in 2016‑17 to about 20 percent in 2020 (the most recent year for which we have data). To the extent national data are available, they also show relatively low levels of employment, although perhaps at somewhat higher levels than California. For example, a widely cited 2013 survey estimated the national employment rate for individuals with intellectual disabilities at 34 percent (including 18 percent who were employed in a competitive integrated environment [defined below] and 13 percent who were employed in a sheltered work program; the remainder were largely self‑employed).
California Is an “Employment First” State. State and federal policy have shifted in recent years toward promoting competitive integrated employment (CIE) for individuals with developmental disabilities. (In this context, “competitive” means market rate wages.) Chapter 667 of 2013 (AB 1041, Chesbro) created California’s employment first policy, which makes CIE the highest priority for working age consumers, regardless of the severity of their disability. In 2014, Congress passed the Workforce Innovation and Opportunities Act, which promotes CIE and increases training and supports (particularly for those age 24 and younger), and generally prohibits employers from paying less than minimum wage to employees with developmental disabilities.
Chapter 339 of 2021 (SB 639, Durazo) Phases Out Subminimum Wage. Currently, about 3,800 consumers who are working earn less than minimum wage. About 3,600 of these consumers are served in work activity programs (WAPs), where they earn a wage based on their specific level of productivity. Paying subminimum wage to an individual with a disability requires a federal certificate issued under the Fair Labor Standards Act. Chapter 339 phases out the use of these certificates in California by January 1, 2025 (or when the required multiyear phaseout plan led by the State Council on Developmental Disabilities specifies, whichever is later).
State Has Funded Various Programs to Encourage Employment. Chapter 3 provided DDS $20 million General Fund ongoing to support (1) incentive payments for supported employment providers and (2) consumers’ paid internships in CIE environments. The 2021‑22 budget provided $10 million one‑time General Fund to DDS to support grants to organizations developing innovative strategies to increase CIE among consumers. The 2022‑23 budget included $8.3 million ($5 million General Fund) one time to establish a pilot program for expanding employment opportunities for DDS consumers, particularly those affected by the phaseout of the subminimum wage.
Issues
While State Recently Spent a Larger Share of Employment Funding... Figure 8 tracks the share of funding made available for CIE incentives and paid internships which has been actually utilized each year since 2016‑17. Notably, 2021‑22 marked the first year in which over half of the appropriated money was spent for these programs. This is because trailer bill language passed as part of the 2021‑22 budget package doubled the amounts given per CIE incentive.
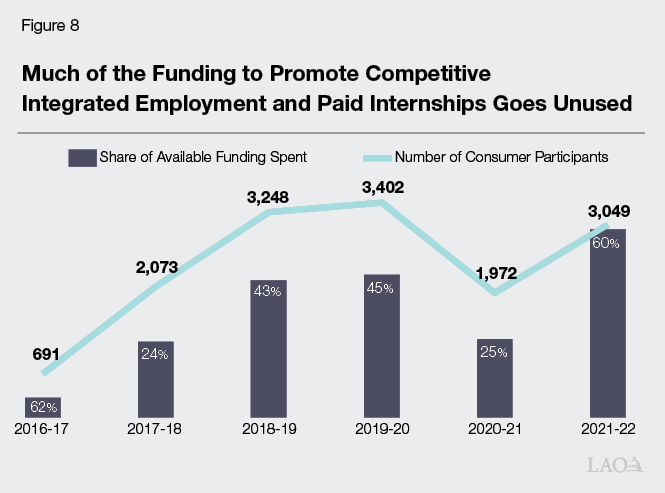
…These Programs Still Benefit Relatively Few Consumers. Although 2021‑22 represents an all‑time high in the amount of funding utilized for CIE and paid internships, this funding still served just about 3,000 individuals—a few hundred less than were served by these programs before the COVID‑19 pandemic. Unless the state finds a way to reach additional consumers with these existing programs, it is unlikely to significantly improve the employment rate for DDS consumers. This is particularly true given the impending closure of WAPs.
Roll Out of SDP
Background
SDP Offers an Alternative to Traditional Service Coordination. Chapter 683 of 2013 (SB 468, Emmerson) created SDP to provide consumers greater control over which services they will receive and from whom. Participants are provided a fixed amount of resources (based on that participant’s purchase of service expenditures over the prior 12 months) with which to purchase the services of their choosing.
State Has Made Numerous Recent Investments to Support SDP. The 2020‑21 spending plan included $4.4 million total funds ($3.1 million General Fund) ongoing to support administration of SDP. In addition, the 2022‑23 spending plan provided $7.2 million total funds ($4.4 million General Fund) ongoing to cover the costs of Financial Management Service providers for SDP participants. Financial Management Services are outside firms that help consumers manage their budgets and purchase services. Under prior law, participants were required to pay for these costs from their fixed funding amount.
Issues
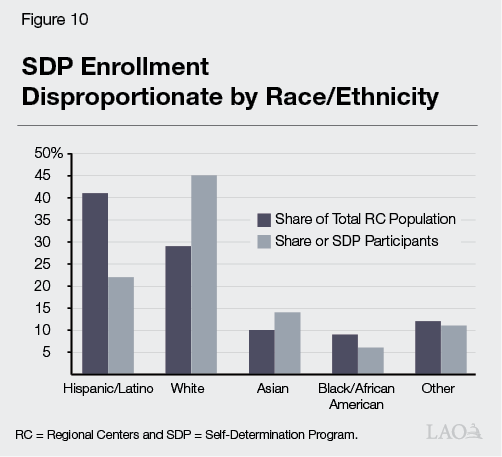
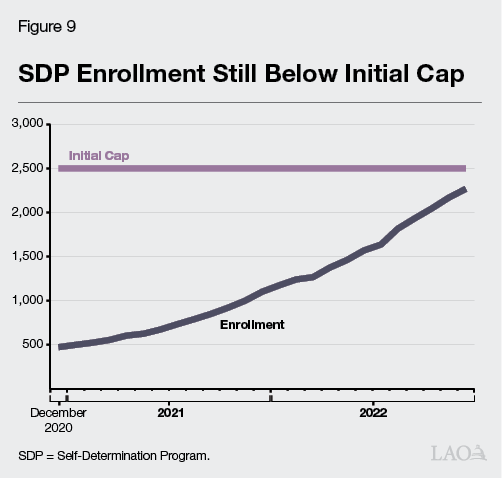
SDP Rollout Continues to Lag. Chapter 683 created a phase‑in period for SDP, limiting enrollment during the first three years to 2,500 individuals. During these first three years (July 2018 through June 2021), DDS and RCs enrolled just 625 participants, with two RCs enrolling fewer than ten people. Per Chapter 683, the program was made available to all interested consumers as of July 2021. As Figure 9 shows, enrollment has grown steadily since the program was opened to all, but has not quite reached the initial 2,500‑person cap.
Racial/Ethnic Disparities Apparent in SDP Rollout. Enrollment in SDP does not reflect the racial/ethnic composition of the DDS consumer population. Figure 10 shows that white consumers comprise a plurality of SDP participants (45 percent), despite making up only 30 percent of all DDS consumers. By comparison, Latino consumers comprise only 23 percent of SDP participants, but 40 percent of all DDS consumers. These disparities may speak to specific challenges in promoting the SDP to some communities. As with disparities in spending, better understanding the drivers of disparities in SDP enrollment could help the state develop a coordinated plan for ensuring greater take‑up of this program across all consumers.