LAO Contact

December 13, 2023
Assessing California’s Climate Policies—Implications for State Transportation Funding and Programs
- Introduction
- Background
- California’s Climate Policies Will Have Long‑Term Impacts on State Transportation Funding and Programs
- Options to Address Approaching Transportation Funding Gap
- Next Steps
- Conclusion
Executive Summary
State Has Many Policies to Reduce Transportation Emissions. Transportation is the largest source of California’s greenhouse gas (GHG) emissions—accounting for roughly 40 percent of total statewide emissions in recent years. The state has many initiatives in place to reduce GHG emissions from the transportation sector, including programs and policies that are targeted at increasing the adoption of zero‑emission vehicles (ZEVs), increasing the use of lower‑carbon fuels, and reducing the number of vehicle miles traveled (VMT). The California Air Resources Board is required to complete a Scoping Plan that identifies a strategy for achieving the state’s GHG reduction goals, incorporating both existing state efforts and any additional changes that will be needed across various sectors. Given the magnitude of emissions associated with transportation, reducing GHGs from this sector will need to be a key component of the state meeting its overall climate goals. As such, the most recent Scoping Plan, adopted in 2022, included several major changes needed within the transportation sector. These included transitioning all new vehicle sales to ZEVs (by 2035 for light‑duty vehicles and by 2040 for medium‑ and heavy‑duty vehicles) and reducing VMT statewide.
California’s Climate Policies Will Have Long‑Term Impacts on Existing State Transportation Funding Sources. California’s transportation system is supported by state, local, and federal sources. State sources—which historically have accounted for roughly one‑third of total transportation funding, including $14.2 billion in 2023‑24—consist of various fuel taxes and vehicle fees. While recent state initiatives to reduce GHG emissions from the transportation sector—along with additional steps envisioned in the Scoping Plan—are intended to have climate benefits, they also will have resulting impacts on state transportation revenues. Most significantly, policies aimed at increasing the adoption of ZEVs will decrease the consumption of gasoline and diesel fuels, and consequently reduce the associated tax revenues that currently support the state’s transportation system.
In this report, we estimate impacts to state transportation revenues and programs (in inflation‑adjusted dollars) under the GHG reduction pathway envisioned by the Scoping Plan. Specifically, compared to current levels, we project notable revenue declines over the next decade from the state’s gasoline excise tax ($5 billion or 64 percent), diesel excise tax ($290 million or 20 percent), and diesel sales tax ($420 million or 20 percent). We estimate that these declines will be partially but not fully offset by projected increases in revenues from an existing annual registration fee levied on battery‑electric and hydrogen fuel cell vehicles ($1 billion). On net, we estimate that if the state undertakes the steps envisioned in the Scoping Plan to reduce GHGs, annual state transportation revenues will decline by $4.4 billion (31 percent) over the next decade as compared to current levels. While we estimate total revenues would decline even under a baseline forecast due to ongoing increases in fuel efficiency and greater interest in ZEVs, the state’s recently adopted and planned policies will expedite these underlying trends significantly.
Revenue Declines Will Have Significant Impacts for Certain Transportation Programs. Absent a funding backfill from alternative sources, the projected revenue declines will result in certain state transportation programs having less capacity to support state and local transportation projects and activities. The exact impacts on each specific program will depend on several factors, such as the magnitude of its estimated funding reduction and the degree to which it relies on state funds as compared to other sources. For instance, the California Department of Transportation’s highway maintenance and rehabilitation programs are funded primarily by state fuel taxes and therefore will face significant funding declines. Specifically, under the GHG reduction pathway envisioned by the Scoping Plan, we project funding for these programs will drop by roughly $1.5 billion (26 percent) over the next decade, from $5.7 billion to $4.2 billion. Correspondingly, these programs will experience an overall reduction in the number of projects the department can complete on the state highway system, likely resulting in a decline in highway conditions for drivers. While certain programs will experience smaller reductions in terms of total dollars, if they are more reliant on fuel tax revenues then such declines will have proportionally greater impacts on their activities. For instance, we estimate the State Transit Assistance program, which is solely supported by diesel sales tax revenues, will experience funding declines of about $300 million by 2034‑35, which represents about one‑third of its total funding. In cases where programs distribute funding to local governments, such as for local streets and roads and transit, the magnitude of the impacts will vary across jurisdictions. In general, jurisdictions that historically have been more dependent on state funding for their local efforts will experience greater impacts across their transportation systems, likely resulting in reduced services and/or poorer road conditions for their residents.
Legislature Has Several Options for Funding Transportation. The Legislature has several options for addressing the forecasted funding gap. It could choose to raise additional revenues to help partially or fully offset the projected loss from existing fuel taxes and thereby mitigate the potential impacts on transportation programs and activities. Alternatively, it could downsize the state’s existing support for transportation programs in line with projected revenue declines and focus remaining funding on its highest priorities—although clearly this would result in a reduction of current service levels. Specific options the Legislature could consider include: (1) increasing existing fuel taxes and vehicle fees, (2) shifting transportation costs to other fund sources, (3) reducing and reprioritizing spending for transportation programs, and (4) generating revenues from new transportation‑related charges (such as implementing a road charge or new taxes on alternative fuels). The Legislature will want to weigh the benefits and trade‑offs of each of these options. Key considerations the Legislature could use to guide its deliberations include: how well a potential funding source aligns with the “user‑pays” principle (that is, whether those who use and benefit from the state’s transportation system are the ones paying for its maintenance and improvements); how impacts are distributed amongst various groups, such as by income level and/or geography; the magnitude of potential state costs associated with implementation; and whether the associated revenues will be stable and sustainable over the long run.
Recommend Legislature Continue to Monitor Revenues and Develop Long‑Term Plan. When and how transportation revenues will be affected is dependent on a number of factors—including how quickly the state’s fleet of vehicles transitions to ZEVs—and is therefore subject to considerable uncertainty. However, if the state continues with its GHG reduction and ZEV adoption strategies, the overall downward revenue trajectory we discuss here will occur over time. We therefore recommend that the Legislature continue to track this issue closely over the coming years—including the rate at which revenues are declining and how significantly program funding levels are being affected—to help inform how and when it might want to take additional steps to meet its transportation priorities. We also recommend the Legislature begin to develop a plan for how it will address impending declines in state transportation revenues. While the state has several approaches with which it could respond, each comes with various benefits and trade‑offs that will need to be considered. Beginning to weigh these options now would better position the state to act in the future when revenue declines become more significant.
Introduction
In this report, we discuss how meeting the state’s greenhouse gas (GHG) reduction goals could impact existing state transportation revenues and programs. Specifically, our report includes: (1) background on the state’s policies to reduce GHG emissions from the transportation sector, (2) an overview of state transportation funding and programs, (3) estimates of how meeting the state’s GHG reduction goals could impact state transportation funding and programs, (4) options the Legislature could consider to address associated impacts, and (5) recommendations for legislative next steps. This report was developed pursuant to Chapter 135 of 2017 (AB 398, E. Garcia), which requires our office to report annually on the economic impacts and benefits of the state’s GHG reduction goals.
Background
State GHG Emission Goals and Transportation Sector
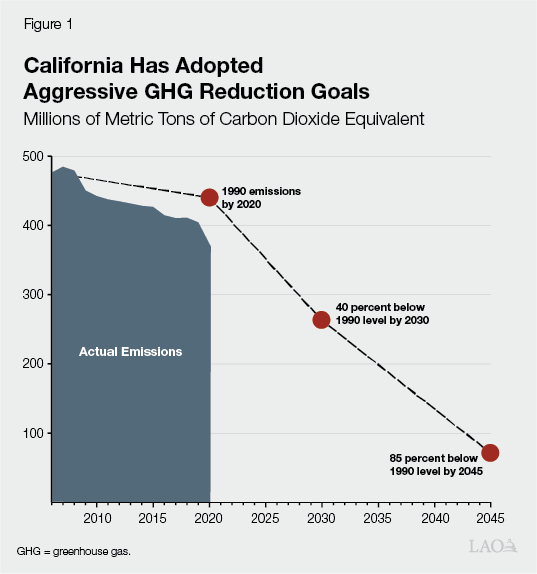
California Has Established Several Significant GHG Reduction Goals. The Legislature has adopted three successive statewide goals for reducing GHG emissions:
- 2020. Chapter 488 of 2006 (AB 32, Núñez) established the goal of limiting GHG emissions statewide to the 1990 level by 2020.
- 2030. Chapter 249 of 2016 (SB 32, Pavley) extended the limit to at least 40 percent below the 1990 level by 2030.
- 2045. Chapter 337 of 2022 (AB 1279, Muratsuchi) established a new limit of at least 85 percent below the 1990 level by 2045. Assembly Bill 1279 also established a statewide goal of zero net carbon emissions by 2045, commonly known as carbon neutrality.
As shown in Figure 1, statewide GHG emissions have decreased in recent years—dropping below the 2020 target several years ahead of schedule. However, emissions will need to decline at a much faster rate in order to meet the 2030 and 2045 targets. For context, from 2010 to 2019, emissions declined by about 1 percent annually. In contrast, meeting statutory statewide emission reduction goals would require average annual reductions of 4 percent from 2019 to 2030, and 9 percent between 2030 and 2045. (At the time of this report’s preparation, final data on actual emissions for 2021 were not yet available.)
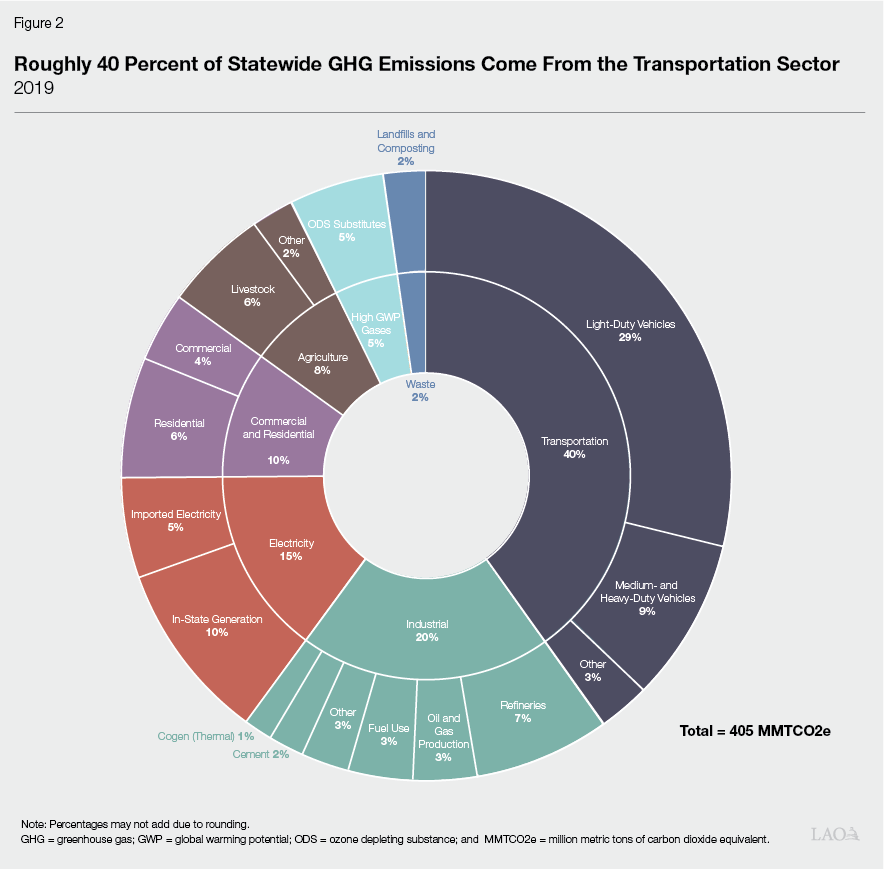
Transportation Is Largest Source of State GHG Emissions. As shown in Figure 2, the transportation sector is the largest source of state GHG emissions, accounting for about 40 percent of total emissions in 2019. (While data for 2020 are available, emissions from that year are anomalous due to the impacts of the COVID‑19 pandemic—particularly in the transportation sector, where stay‑at‑home orders and social distancing reduced the demand for driving.) Transportation‑related emissions mostly result from light‑duty vehicles (passenger cars and smaller pickup trucks), with a smaller amount coming from medium‑duty vehicles (larger pickup trucks and delivery vans) and heavy‑duty vehicles (buses and long‑haul trucks).
State Has Several Policies and Programs to Reduce Transportation Emissions. The state has many initiatives in place to reduce GHG emissions from the transportation sector. These include programs that are specifically targeted at increasing the adoption of zero‑emission vehicles (ZEVs). (Please see the nearby box for a more detailed description of the different types of ZEVs discussed in this report.) Such programs provide financial incentives for consumers to purchase ZEVs, as well as support for installing charging and refueling stations and for ZEV manufacturing. The state also has adopted several regulatory policies that require an increasing percentage of new vehicle sales to be ZEVs and that entities comply with certain ZEV purchase and phase‑in requirements. Two major regulatory policies the California Air Resources Board (CARB) recently adopted include:
- Advanced Clean Cars II. Adopted by CARB in 2022, this regulation requires an increasing percentage of new light‑duty vehicle sales to be ZEVs, establishing a sales threshold of 35 percent in 2026 that increases to 100 percent in 2035. (The Advanced Clean Cars II regulation builds on previous ZEV sales requirements CARB set for new light‑duty vehicles from 2015 to 2025.)
- Advanced Clean Fleets. Adopted by CARB in 2023, this regulation requires 100 percent of new medium‑ and heavy‑duty vehicle sales to be ZEVs by 2036. (This builds on previous ZEV sales requirements that CARB set for new medium‑ and heavy‑duty vehicles from 2024 to 2035.) The regulation also requires all drayage trucks—heavy‑duty vehicles that transport cargo to and from intermodal seaports and railyards—to be ZEVs by 2035. Additionally, the regulation establishes medium‑ and heavy‑duty ZEV purchase and phase‑in requirements for federal and state agencies, local governments, and certain private fleets.
Three Main Types of Zero‑Emission Vehicles
Zero‑emission vehicles (ZEVs) are vehicles that do not produce tailpipe emissions when they operate. However, producing the fuel that is used to power the vehicle still may result in some emissions. There are three main types of ZEVs:
- Battery‑Electric Vehicle—Relies solely on a battery to propel the vehicle and has to be recharged from an external power source.
- Hydrogen Fuel Cell Electric Vehicle—Uses an electrochemical reaction to combine hydrogen fuel and oxygen to produce electricity to propel the vehicle, with water being the other byproduct of the reaction.
- Plug‑in Hybrid Electric Vehicle—Uses a battery that can be recharged by plugging into an external power source, but also has an internal combustion engine—typically powered by gasoline—that can be used when the battery runs out of power. While these vehicles produce tailpipe emissions when the internal combustion engine is used, they sometimes are referred to as ZEVs because they can be powered by a battery for a short distance. For the purposes of this report, we consider plug‑in hybrid electric vehicles as a type of ZEV because they are currently included in most state programs intended to increase ZEV adoption.
In addition to the policies mentioned above, the state also has programs centered around increasing the adoption of lower‑emission vehicles (not necessarily zero emission), particularly in sectors where ZEVs may not be widely available; increasing the use of lower‑carbon fuels; and reducing the number of vehicle miles traveled (VMT).
Scoping Plan Assumes Significant Reductions in GHG Emissions From Transportation Sector. Statute requires CARB to complete a Scoping Plan at least once every five years. The Scoping Plan is meant to identify CARB’s strategies for achieving the statewide GHG targets. The plan assesses the most cost‑effective and technologically feasible scenario to achieve the state’s GHG reduction goals, incorporating both existing state efforts and any additional changes CARB anticipates will be needed across various sectors. This “Scoping Plan Scenario” is evaluated against a “Reference Scenario,” which is meant to reflect what emissions would be under existing state policies and trends.
The most recent Scoping Plan, which CARB adopted in December 2022, included three major changes needed within the transportation sector to meet the state’s GHG reduction goals: (1) ensure that 100 percent of new light‑duty vehicle sales are ZEVs by 2035, (2) ensure that 100 percent of new medium‑ and heavy‑duty vehicle sales are ZEVs by 2040, and (3) ensure that per capita VMT for light‑duty vehicles is limited to 25 percent below the 2019 level by 2030 and 30 percent below that level by 2045. (While the Scoping Plan identifies and models the annual changes needed to achieve the state’s GHG reduction goals, it does not specify which policies will achieve those outcomes. We discuss this shortcoming in our January 2023 report, Assessing California’s Climate Policies—The 2022 Scoping Plan Update. The Advanced Clean Cars II and Advanced Clean Fleets regulations mentioned in the previous section were adopted after the development of the 2022 Scoping Plan and will help the state make progress towards its intended outcomes.) As a comparison, the plan’s Reference Scenario reflects a baseline projection that assumes current policies and practices that were in place in early 2022 continue without further updates. As such, the Reference Scenario does not incorporate projected impacts from the Advanced Clean Cars II or Advanced Clean Fleets regulations that CARB subsequently adopted.
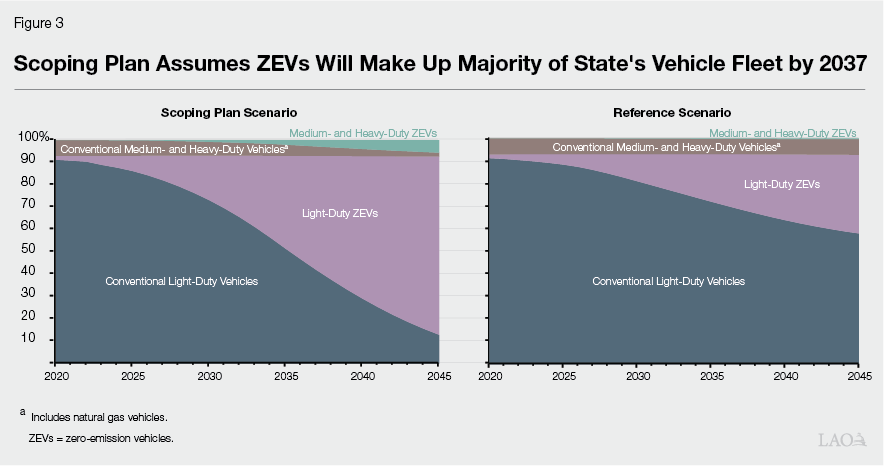
Scoping Plan Assumes Most of California’s Vehicles Will Transition to ZEVs Over the Coming Decades. Figure 3 highlights the assumptions the Scoping Plan makes regarding the state’s transition to ZEVs over the coming years. Specifically, the plan assumes the overall fleet of vehicles driven in the state will transition from 97 percent conventional vehicles in 2022 to 85 percent ZEVs in 2045. The plan assumes this transition will be phased in at a steady and aggressive pace, with the majority of the fleet consisting of ZEVs by 2037. As noted, this scenario is based on the changes CARB anticipates are needed to achieve the state’s GHG goals. The envisioned transition will be aided by implementation of the recent Advanced Clean Cars II and Advanced Clean Fleet regulations, but may also require other unspecified policy changes to help encourage the intended outcomes. As shown in the figure, the Scoping Plan assumes a notably more rapid ZEV transition compared to the Reference Scenario, which does not incorporate new policy changes beyond those in place in early 2022 and assumes conventional vehicles will still make up 65 percent of the cars, trucks, and buses on California’s roads in 2045.
Major State Transportation Funding Sources and Programs
The state’s transportation system consists of highways, local streets and roads, transit and rail systems, bicycle routes, and pedestrian pathways. This system is supported by a number of state, local, and federal funding sources. The state distributes its funds through a variety of programs. This section discusses the state’s transportation revenue sources, programs, and funding allocations.
Transportation Supported by State, Local, and Federal Sources. Public funding for California’s transportation system comes from numerous sources. Historically, about one‑third of total transportation funding has come from state sources. Local sources—such as local sales tax revenues, transit fares, and city and county general funds—have made up slightly less than half of total funding. The remaining amount (roughly one‑fifth of total funding in most years) comes from federal sources that are provided to the state or directly to local governments. (These trends have fluctuated some in recent years due to the impacts of the pandemic, additional federal funds provided through the Infrastructure Investment and Jobs Act and various pandemic relief packages, and augmentations provided to transportation programs in recent state budgets.) In 2023‑24, we estimate that public funding for transportation in California from all sources will total over $40 billion.
State Transportation Revenues Primarily Come From Various Fuel Taxes and Vehicle Fees. As shown in Figure 4, state funding for transportation comes from six different fuel taxes and vehicle fees that are dedicated to specific purposes. As shown in the figure, funding from these sources is estimated to total $14.2 billion in 2023‑24. These consist of:
- Fuel Taxes. The state collects excise taxes on gasoline and diesel. In 2023‑24, the gasoline excise tax is set at 57.9 cents per gallon, while the diesel excise tax is set at 44.1 cents per gallon. Rates for both taxes are adjusted each July to account for inflation. (The federal government also levies additional fuel excise taxes, which for many years have been set at 18.4 cents per gallon for gasoline and 24.4 cents per gallon for diesel.) The state also collects revenues from a 13 percent sales tax on diesel, with 10.5 percent dedicated to state transportation programs. (The remaining amount is used for other state and local purposes.)
- Vehicle Fees. The state collects three major vehicle fees to support its transportation system: the transportation improvement fee (TIF), weight fees, and the road improvement fee (RIF). (Certain other state vehicle fees—such as vehicle registration and driver’s license fees—are used to support the California Highway Patrol and the Department of Motor Vehicles.) TIF is an annual registration fee that varies based on the market value of a vehicle, while RIF is an annual registration fee charged to battery‑electric and hydrogen fuel cell electric vehicles that are model year 2020 or later. (RIF is not charged for plug‑in hybrid electric vehicles.) Both fees are adjusted each January for inflation. Weight fees are annual registration fees charged to commercial vehicles based on their weight. Weight fees are not adjusted for inflation.
Figure 4
State Transportation Funding Is Supported by
Several Fuel Taxes and Vehicle Fees
2023‑24
|
Rate |
Estimated Revenues |
|
|
Fuel Taxes |
||
|
Gasoline excise tax |
57.9 centsa |
$7.8 |
|
Diesel excise tax |
44.1 centsa |
1.4 |
|
Diesel sales tax |
13 percentb |
1.3 |
|
Vehicle Feesc |
||
|
Transportation improvement fee |
$29 to $206d |
$2.3 |
|
Weight fees |
$8 to $2,064 |
1.3 |
|
Road improvement fee |
$108d |
0.1 |
|
Total |
$14.2 |
|
|
aPer gallon. b10.5 percent is dedicated to transportation purposes. cPer vehicle per year. dRate as of January 2023. Will be adjusted for inflation in January 2024. |
||
In addition to these taxes and fees, each year the state continuously appropriates a portion of its cap‑and‑trade auction revenues through the Greenhouse Gas Reduction Fund (GGRF) to several transportation programs. (The cap‑and‑trade program sets a declining statewide annual cap on GHG emissions. Regulated entities can comply with this requirement by either reducing emissions or purchasing allowances at quarterly auctions that generate GGRF revenues.) In 2023‑24, the amount of continuously appropriated cap‑and‑trade auction revenues provided to transportation is estimated to be $1.4 billion. Moreover, recent state budgets have provided significant limited‑term augmentations for transportation—mostly from the General Fund—including $10.9 billion over a five‑year period approved as part of the 2022‑23 budget package. The 2023‑24 budget package included an additional $1.1 billion over a four‑year period to support transit agencies in addressing projected operational funding shortfalls, purchasing ZEVs, and installing ZEV‑related infrastructure.
California’s Transportation System Is Supported by Various State Programs. As shown in Figure 5 and described in more detail below, the state supports its transportation system through several major state programs that fund various types of infrastructure and activities. (Figure 5 displays ongoing funding provided to transportation programs from state fuel taxes, vehicle fees, and GGRF and does not include the one‑time funding augmentations provided to transportation programs from recent state budgets.) In most cases, these programs support transportation projects and activities in conjunction with federal‑ and locally‑funded programs.
- Highways. The California Department of Transportation (Caltrans) is responsible for maintaining and rehabilitating the state highway system, which includes about 52,000 lane miles of highways, 13,000 bridges, and numerous other transportation assets such as culverts. The department does this through the Highway Maintenance Program, which supports corrective and preventative maintenance activities, and the State Highway Operation and Protection Program, which supports capital projects that rehabilitate and reconstruct the state highway system.
- Local Streets and Roads. California contains about 330,000 lane miles of local streets and roads. The state’s 58 counties and 482 cities own and maintain these assets, as well as roughly 12,000 locally‑owned bridges and other related roadway infrastructure. The state distributes a portion of its transportation revenues to cities and counties to support local streets and roads.
- Transit and Rail. California contains over 200 transit agencies which deliver services to the public through buses, trains, ferries, and paratransit vans. Transit systems generally are owned and operated by local governments. The state provides support for transit through several formula programs. Additionally, the state provides competitive funding for capital improvements through the Transit and Intercity Rail Capital Program. The state also is in the process of constructing a high‑speed rail line, largely supported by GGRF and voter‑approved state bonds.
- Multimodal. The state also operates several formula and competitive programs that support transportation improvements across various modes. For instance, the State Transportation Improvement Program provides formula funding to Caltrans and counties for capacity improvements on highways, local streets and roads, and transit systems.
Figure 5
Overview of State’s Major Transportation Programs
(In Billions)
|
Program |
Description |
2023‑24 State Funding |
|
State Highways and Local Streets and Roads |
||
|
Highway Maintenance and SHOPP |
Supports Caltrans’ maintenance and rehabilitation work on the state highway system. |
$5.7a |
|
Local streets and roadsb |
Supports projects on local streets and roads. |
3.4 |
|
Transit and Rail |
||
|
State Transit Assistanceb |
Supports transit operations and capital projects. |
$1.0 |
|
Transit and Intercity Rail Capitalc |
Supports transit and rail projects that reduce GHG emissions and congestion. |
0.6 |
|
Low Carbon Transit Operationsb |
Supports transit operations and capital projects that reduce GHG emissions. |
0.2 |
|
State of Good Repairb |
Supports transit maintenance, rehabilitation, and capital projects. |
0.1 |
|
State Rail Assistanceb |
Supports rail operations and capital projects. |
0.1 |
|
Multimodald |
||
|
State Transportation Improvementb |
Supports capacity improvement projects. |
$0.6 |
|
Trade Corridor Enhancementc |
Supports projects on corridors with high volume of freight movement. |
0.4 |
|
Solutions for Congested Corridorsc |
Supports projects on highly traveled and congested corridors. |
0.3 |
|
Local Partnershipb,c |
Supports projects in jurisdictions with local taxes and fees dedicated to transportation. |
0.2 |
|
Active Transportationc |
Supports projects that increase walking and biking. |
0.1 |
|
aIncludes funding to support Caltrans' administrative programs, such as project planning and general administration. bFunding allocated on a formula basis. cFunding allocated on a competitive basis. dPrograms are eligible to support transportation improvements across various modes, such as highways, local streets and roads, transit, and rail. |
||
|
SHOPP = State Highway Operation and Protection Program; Caltrans = California Department of Transportation; and GHG = greenhouse gas. |
||
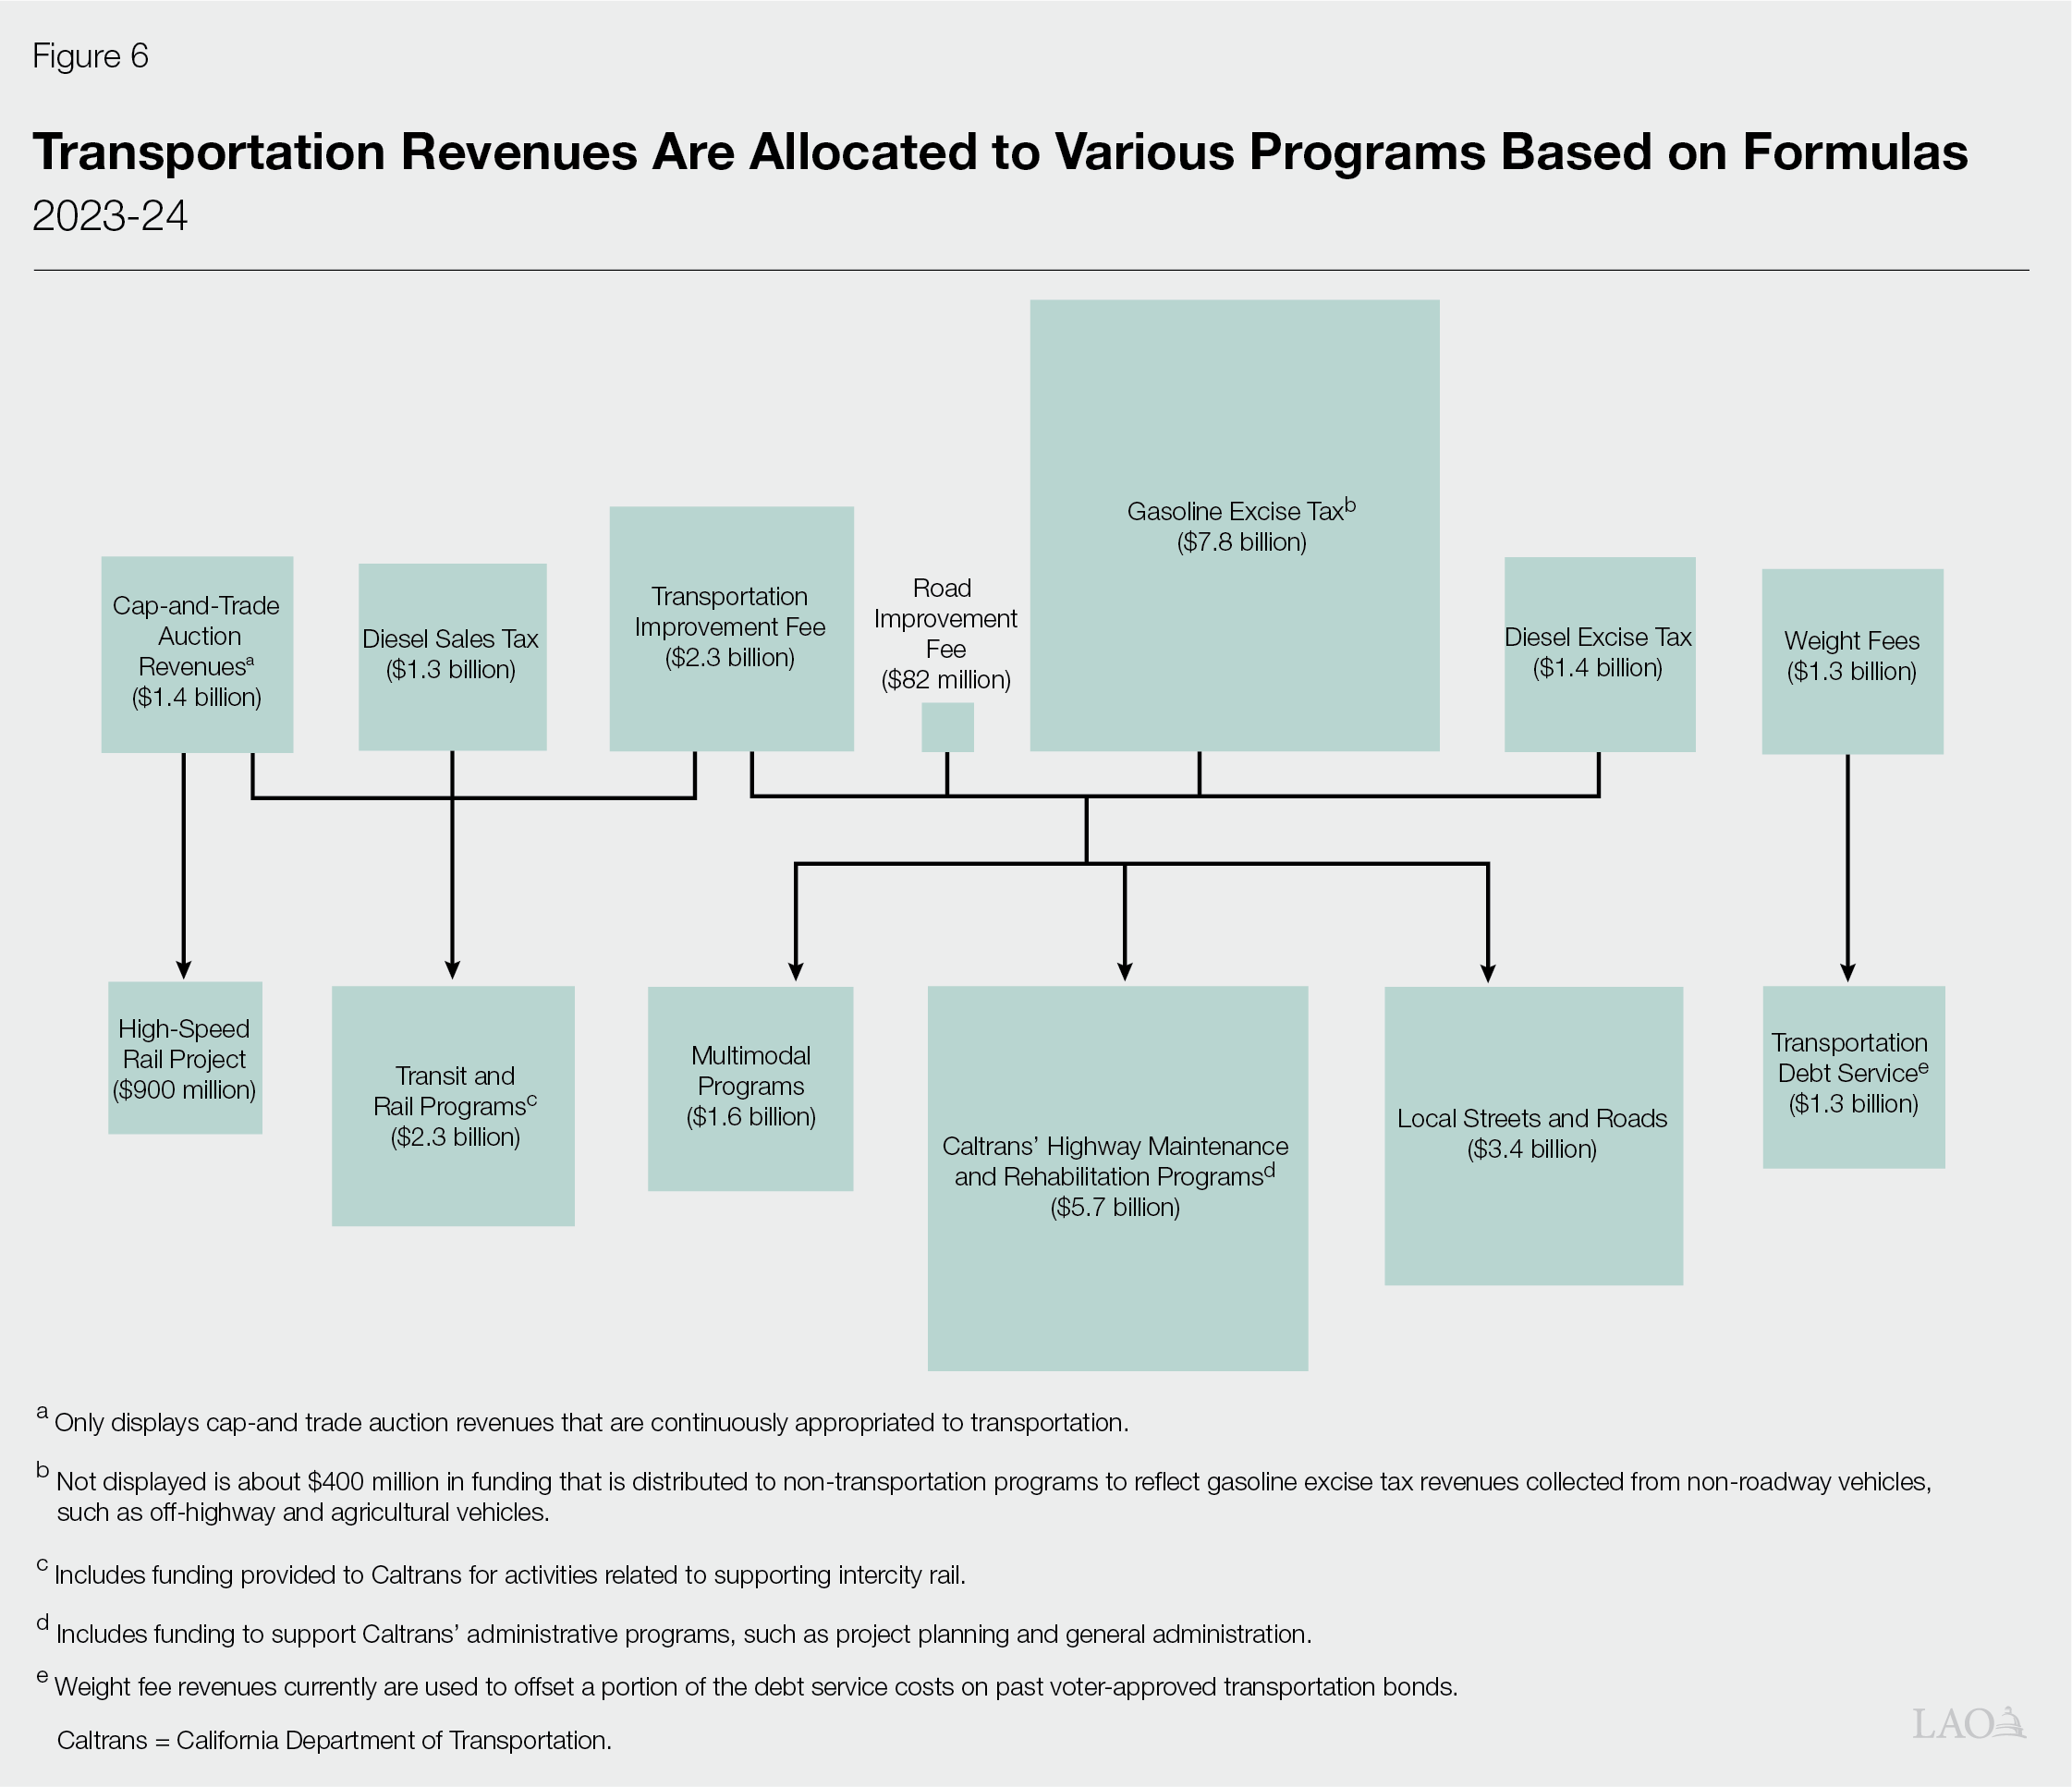
Funding for State Transportation Programs Based Largely on Statutory Formulas. The state allocates funding from its fuel taxes and vehicle fees to different transportation programs and accounts through statutory formulas. (The California Constitution includes restrictions that require that these taxes and fees be used for specific transportation purposes.) These formulas largely distribute funding based on established percentages, but in some cases, statute sets aside fixed dollar amounts for certain programs. Statutory allocations vary by fund source, with some supporting specific programs and activities. Figure 6 provides a simplified overview of how the state allocates its transportation funding. As shown, the state uses most of the revenues from its fuel taxes and vehicle fees to support highways (maintenance and rehabilitation) and local streets and roads, with a smaller amount supporting transit and multimodal programs. Notably, all of the revenues collected from the diesel sales tax are used to support transit and rail programs, while all of the collected revenues from weight fees currently are used to offset a portion of the debt service costs on past voter‑approved transportation bonds. As noted above, the state also continuously appropriates a portion of its cap‑and‑trade auction revenues to transportation programs. These funds are allocated on a formula basis to transit and rail programs and the state’s high‑speed rail project.
California’s Climate Policies Will Have Long‑Term Impacts on State Transportation Funding and Programs
Given the magnitude of emissions associated with transportation, reducing GHGs from this sector will be a key component of the state meeting its overall climate goals. Accordingly, as discussed above, the state has implemented a variety of programs and regulations to achieve these objectives, and the Scoping Plan envisions additional actions. While these steps are intended to have climate benefits, they also will have resulting impacts on state transportation revenues and programs. In this section, we discuss how pursuing the state’s GHG reduction goals might impact the state’s current level and sources of support for its transportation system.
State Transportation Revenues Projected to Decline Significantly
As described, the state has numerous goals and plans that, once implemented, ultimately will result in a reduction in Californians’ gasoline and diesel fuel consumption. These include a statewide transition to greater reliance on ZEVs (as highlighted in Figure 3) and planned reductions in statewide per capita VMT for light‑duty vehicles. Below, we discuss estimates for how these anticipated trends will impact the revenue sources that currently support the state’s transportation programs. As described in the nearby box, we base our projections on two different scenarios—the Scoping Plan Scenario, which that puts the state on the path to meet its GHG reduction goals, and the Reference Scenario, which serves as a baseline comparison for what revenue trends would be absent recent and planned GHG reduction policies. We express all estimates in inflation‑adjusted dollars. As we discuss below, the recent climate policies are not the only factors affecting revenue trends, so the Reference Scenario is an important comparison to show the true estimated impacts of these policies. For example, conventional light‑duty vehicles generally are becoming more fuel efficient, which would reduce gasoline consumption even without the recently adopted state ZEV sales requirements.
Forecasting Methodology
Estimates Reflect Two Scenarios. In this report, we present estimated state transportation revenues from 2023‑24 to 2034‑35 under two different scenarios based on data from the Scoping Plan as well as other state and federal resources. We then utilize our revenue projections under both scenarios to estimate funding levels for state transportation programs over the same period. We express all estimates in inflation‑adjusted dollars. The two scenarios underlying our revenue estimates are:
- Scoping Plan Scenario. This reflects modeling assumptions from the California Air Resources Board’s (CARB’s) 2022 Scoping Plan, which assumes the state takes actions to implement the following: (1) ensure that 100 percent of new light‑duty vehicle sales are zero‑emission vehicles (ZEVs) by 2035, (2) ensure that 100 percent of new medium‑ and heavy‑duty vehicle sales are ZEVs by 2040, and (3) ensure that per capita vehicle miles traveled (VMT) for light‑duty vehicles is limited to 25 percent below the 2019 level by 2030 and 30 percent below that level by 2045. In some aspects, the state is already on a path towards this scenario given that it has recently adopted regulations that align with or are more aggressive than the ZEV‑related changes included in Scoping Plan.
- Reference Scenario. This reflects modeling assumptions made under the Reference Scenario included in the Scoping Plan. It is important to note that the state is no longer on a path towards this scenario given recent regulations that will instigate a more rapid transition to ZEVs. However, this scenario provides a baseline comparison to understand how achieving the state’s greenhouse gas (GHG) reduction goals under the Scoping Plan Scenario are likely to impact state transportation revenues and programs compared to if more current policies—as of early 2022—were maintained.
Timing of Changes to Future Transportation Revenues Subject to Considerable Uncertainty. This report is intended to provide a general trajectory of state transportation revenues under the Scoping Plan’s pathway to achieving the state’s GHG reduction goals. As noted in our 2022 report, Assessing California’s Climate Policies—The 2022 Scoping Plan Update, the plan lacks key details on how the state can align itself with the pathway identified. In many cases, the plan’s estimated reductions are driven primarily by assumptions developed by CARB, without a specific strategy for how those assumed outcomes might be achieved. For instance, the Scoping Plan does not indicate what specific policies the state would need to implement to reduce per capita VMT for light‑duty vehicles. Furthermore, while the state has implemented certain ZEV sales regulations that align with the Scoping Plan’s goals, the actual rate at which the state’s vehicle fleet will transition to ZEVs will depend on various factors, such as consumer preferences, the availability of financial incentives, and the number of ZEV charging and refueling stations that are installed over the coming years. As such, decreases to state transportation revenues could materialize more slowly or more rapidly than the forecast trends we model in this report.
When and how transportation revenues will be affected is dependent on a number of factors—including how quickly the state’s fleet of vehicles transitions to ZEVs—and is therefore subject to considerable uncertainty. However, if the state continues with its GHG reduction and ZEV adoption strategies, the overall trajectory we display here will occur in the coming years. (We note that similar trends are occurring nationwide—though likely not at the same rate as California—which will also impact federal gasoline and diesel excise tax revenues. This in turn could affect the amount of federal funds provided to the state and local governments. Similar to California, these trends also will impact the amount of revenues other states collect from their own individual taxes on gasoline and diesel.)
Fuel Tax Revenues Decline as Fuel Efficiency and ZEV Adoption Increase. Figure 7 models anticipated revenue trends for the three key fuel taxes that support state transportation programs—the gasoline excise tax, the diesel excise tax, and the diesel sales tax. As shown, revenues from all three taxes experience declines under the Scoping Plan Scenario, which is the state’s intended pathway. Specifically, compared to 2023‑24, by 2034‑35 gasoline excise tax revenues decrease by $5 billion (64 percent), diesel excise tax revenues decrease by about $290 million (20 percent), and diesel sales tax revenues decrease by about $420 million (32 percent). The trends under this scenario are all driven by assumptions that vehicles across the state will consume less gasoline and diesel due to increasing fuel efficiency and ZEV adoption. (In addition to consumption trends, diesel sales tax revenues also are impacted by forecasted prices.) However, gasoline excise tax revenues decline at a comparatively steeper rate due to several factors. First, as displayed earlier in Figure 3, ZEV adoption over the forecasted period is significantly higher in the light‑duty vehicle sector (the primary consumer of gasoline) when compared to the medium‑ and heavy‑duty vehicle sectors (the primary consumers of diesel). The higher percentage of ZEVs within the light‑duty vehicle sector therefore leads to larger declines in gasoline consumption. Second, consistent with the Scoping Plan assumptions, this scenario assumes that the state is able to reduce per capita VMT for light‑duty vehicles, which will lead to further declines in gasoline consumption.
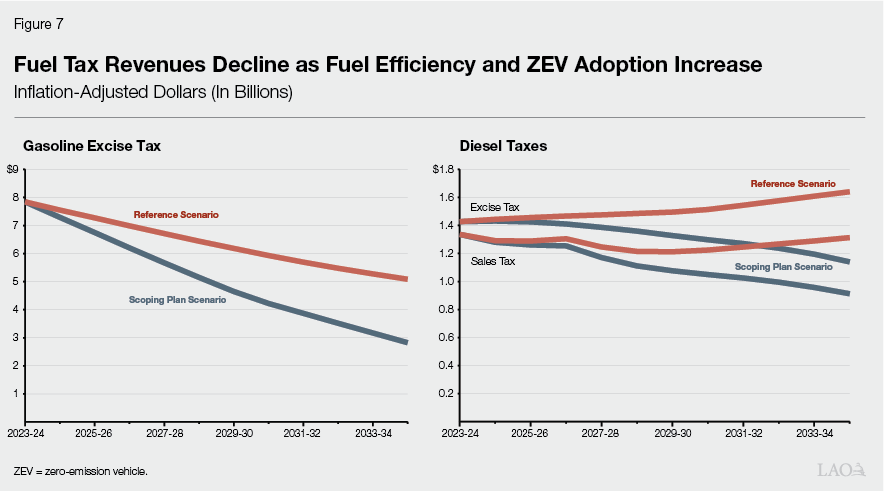
The figure shows a less consistent revenue trend for the three taxes under the baseline Reference Scenario. Specifically, gasoline excise tax revenues still would decline (albeit at a less steep rate than the Scoping Plan Scenario) due to increased fuel efficiency and an assumption that more Californians would opt to purchase ZEVs even without the state aligning itself with the actions and changes included in the Scoping Plan. The trends for diesel excise and sales tax revenues are more divergent, in that the Reference Scenario estimates the state would see an increase in revenues. This is due to the assumption that medium‑ and heavy‑duty vehicles likely would experience minimal ZEV adoption, along with increasing per capita VMT due to an increasing demand for transporting goods (an assumption included under both scenarios). These trends would result in gradual increases in diesel consumption over the coming years.
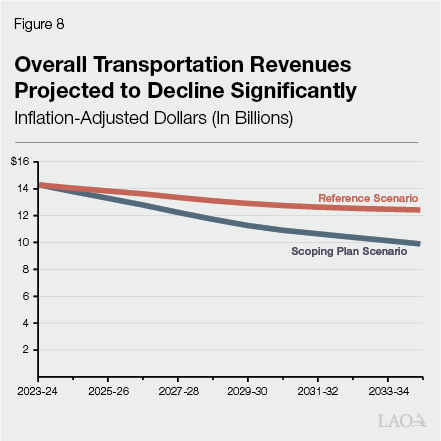
Overall Transportation Revenues Projected to Decline Significantly. Figure 8 displays combined revenue projections for all of the state’s taxes and fees that support transportation programs across the next decade. The figure includes not only the three fuel taxes shown in Figure 7 but also RIF, TIF, and weight fee revenues. As shown, we estimate total revenues will decrease under both scenarios, with notably steeper declines under the Scoping Plan scenario due to the anticipated drop in fuel consumption discussed above. Specifically, under the state’s climate strategy, we project net transportation revenues will decline by $4.4 billion (31 percent) by 2034‑35. (The decline in fuel tax revenues highlighted above are partially but not fully offset by increases in revenues from RIF—which we discuss further below—and TIF.) While we estimate total revenues would decline even under the Reference Scenario (by $1.9 billion, or 13 percent), the state’s recently adopted and planned policies will expedite these underlying trends significantly.
RIF Revenues Will Increase but Not Fully Offset Declines in Fuel Tax Revenues. As discussed above, the state levies an annual registration fee known as RIF on all battery‑electric and hydrogen fuel cell electric vehicles that are model year 2020 or later. This fee was adopted in part to require that owners of ZEVs contribute to state transportation needs in lieu of fuel taxes. We do anticipate that RIF revenues will increase as ZEV adoption expands. Specifically, we project that under the Scoping Plan Scenario, RIF revenues will total $1.1 billion by 2034‑35, an increase of $1 billion compared to current levels. (We estimate that RIF revenues would total $400 million under the Reference Scenario by 2034‑35.) However, as highlighted in Figure 8, RIF does not generate enough revenue to offset overall declines in fuel tax revenues under either scenario. This is primarily due to two reasons. First, as more of the vehicles on California’s roads become ZEVs, RIF is only able to make up for a portion of the lost fuel tax revenues. This issue can be observed through the average charges that owners of these vehicles pay. For instance, an owner of an average conventional light‑duty vehicle pays around $280 a year in gasoline excise taxes, while an owner of a light‑duty battery‑electric vehicle pays only $108 through RIF. Furthermore, RIF is not levied on plug‑in hybrid electric vehicles, despite these vehicles being able to drive some portion of their total mileage using only electricity (and therefore consuming and paying taxes on significantly less gasoline). Second, while RIF partially offsets some lost fuel tax revenues from increased ZEV adoption, it does not address declining revenues resulting from fuel efficiency gains across conventional vehicles.
Revenue Declines Will Impact Funding for Transportation Programs
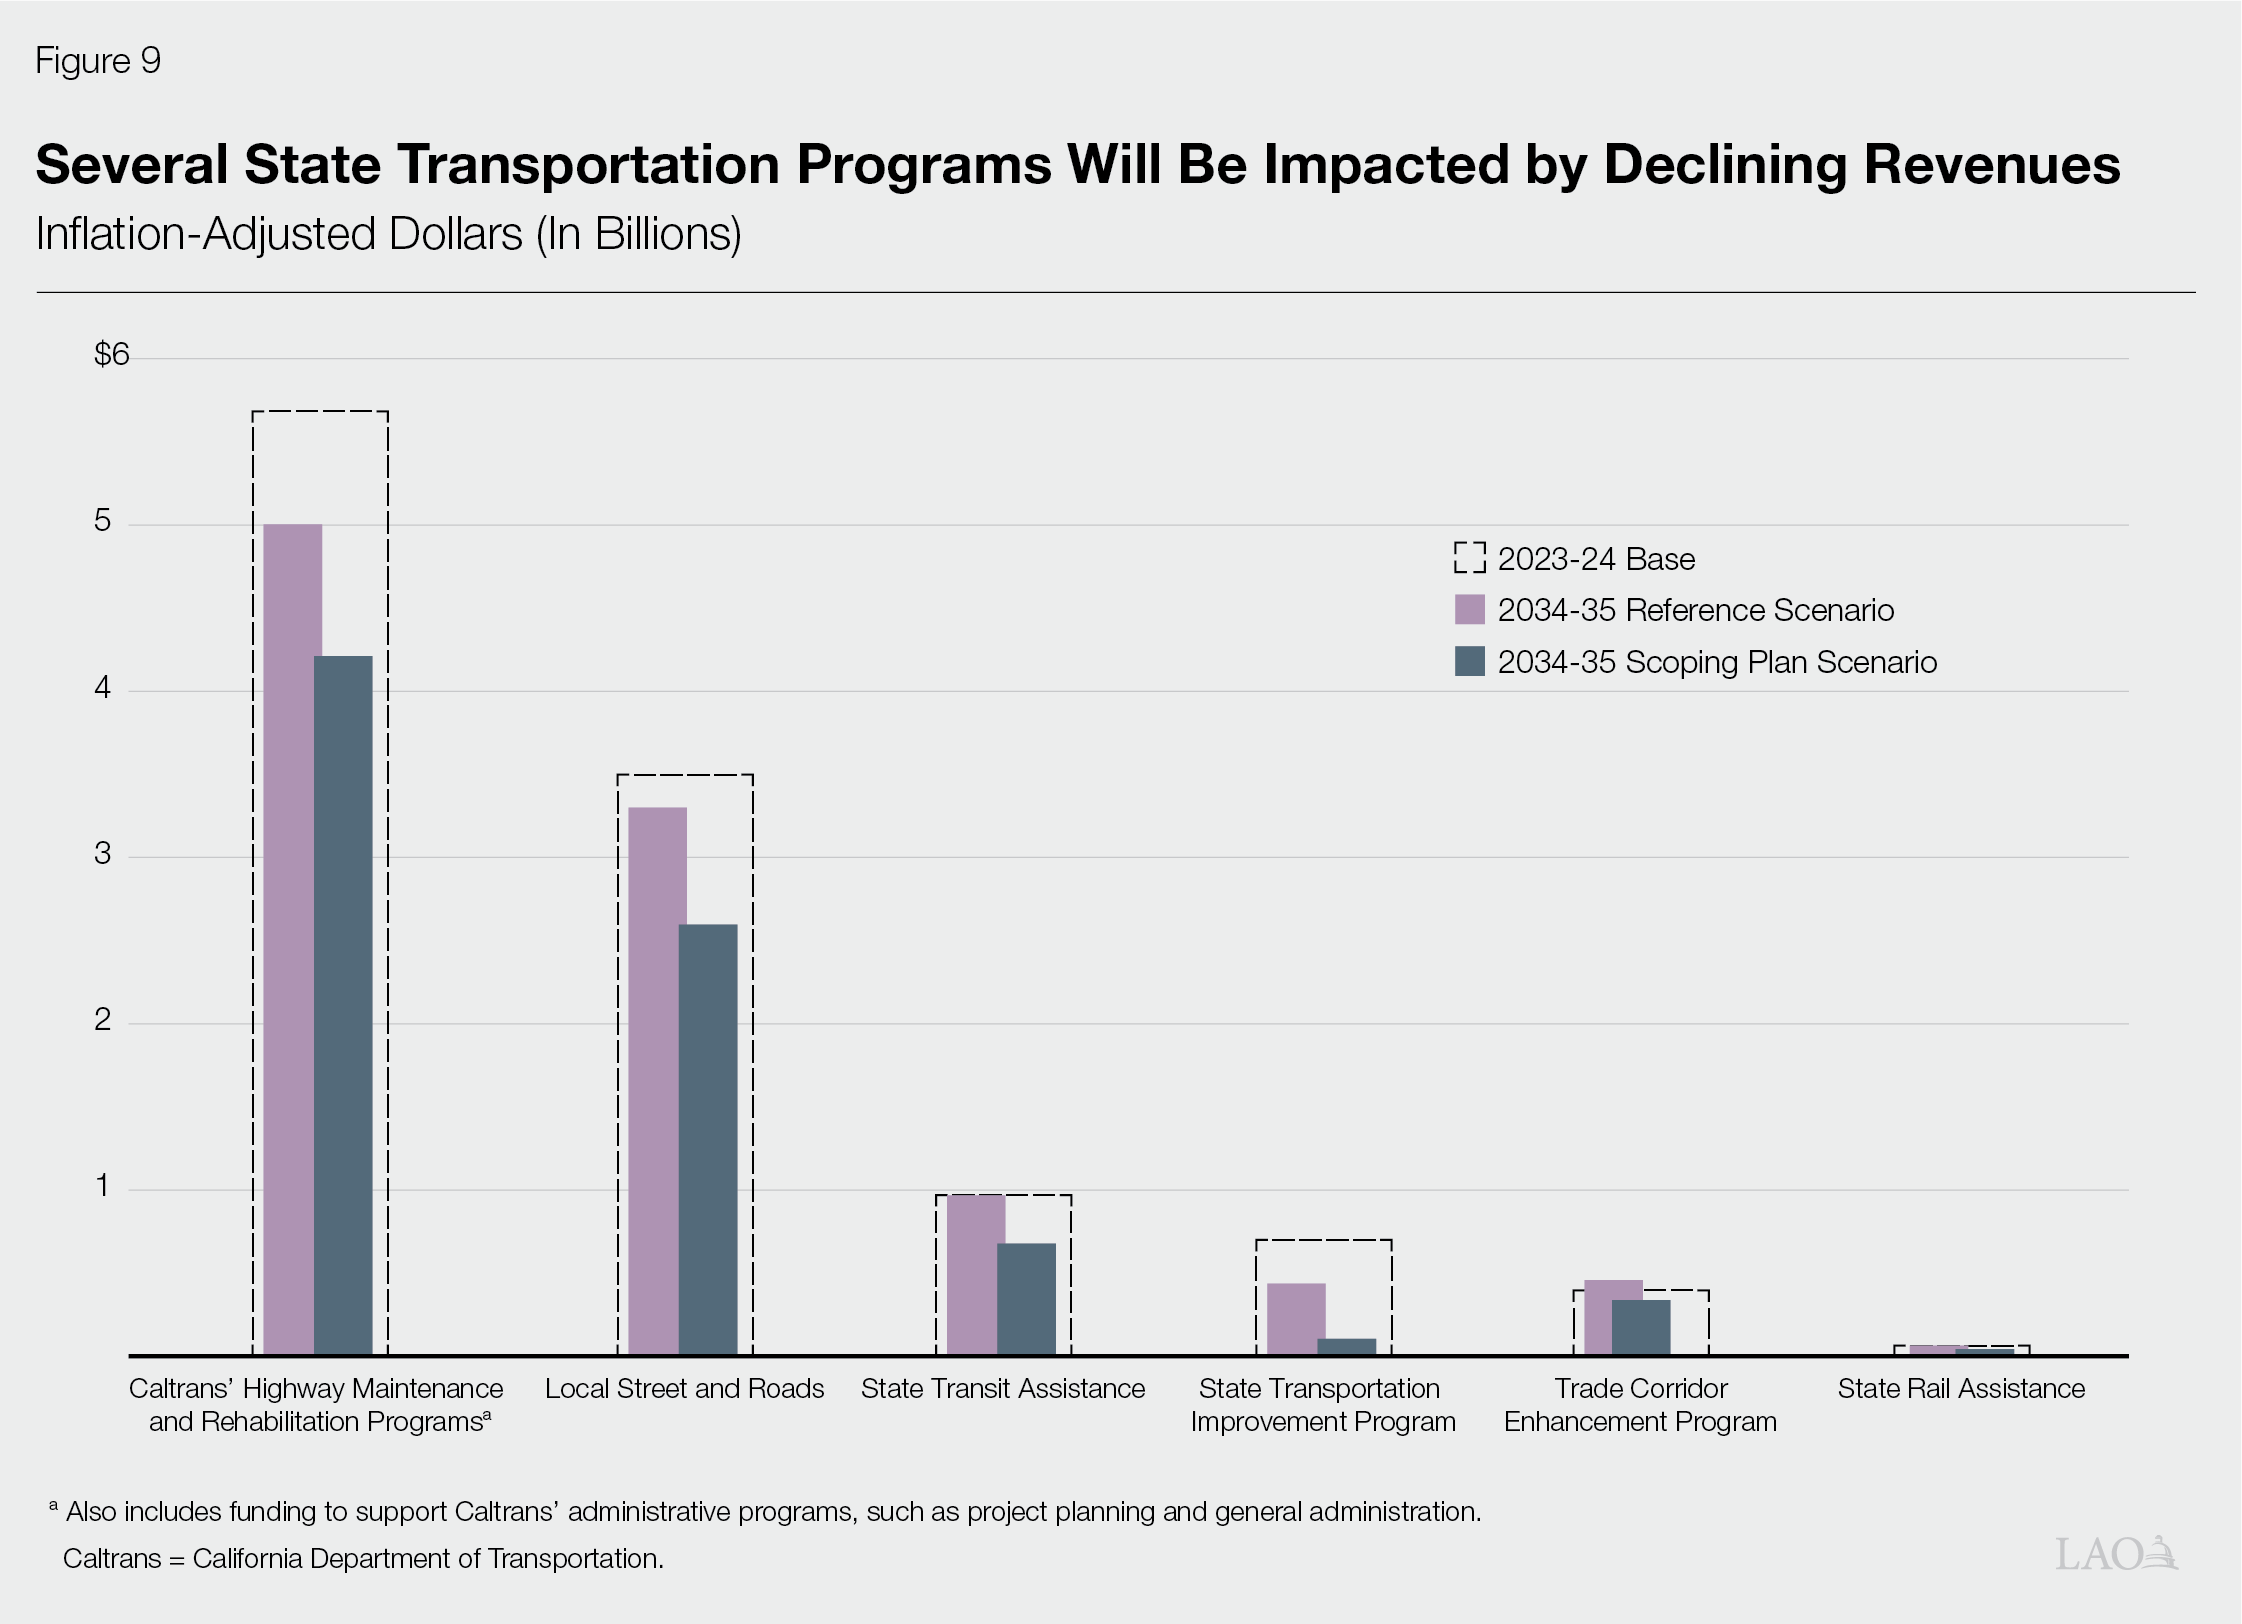
State Programs Supported by Fuel Tax Revenues Will Be Impacted Over the Long Run. Figure 9 shows our estimates (in inflation‑adjusted dollars) for how the revenue projections displayed in Figure 8 will affect funding for the state’s transportation programs over the next eleven years. In terms of total funding reductions, Caltrans’ highway maintenance and rehabilitation programs will be the most heavily impacted under the Scoping Plan Scenario, decreasing by $1.5 billion (26 percent) by 2034‑35. Funding provided to cities and counties for local streets and roads will also experience significant reductions under this scenario, decreasing by $900 million (26 percent) by 2034‑35. While the other programs displayed in the figure will experience smaller reductions in terms of total dollars, it is important to note that they are more reliant on fuel tax revenues. This makes declines in fuel taxes proportionally more impactful for these programs over the long run. For instance, the State Transit Assistance program, which is solely supported by diesel sales tax revenues, will experience funding declines of about $300 million by 2034‑35 under the Scoping Plan Scenario—a loss of roughly one‑third of its total funding. Consistent with the revenue trends discussed above, some declines likely would occur even absent the state’s climate policies (as displayed under the Reference Scenario), but further transitions away from gasoline and diesel—and the associated tax revenues their consumption generates—will exacerbate these impacts. The figure excludes certain transportation programs for which funding will not be directly impacted by the changes modeled in this report. This includes programs that receive an amount specified in statute (such as the Active Transportation Program and Solutions for Congested Corridors Program) as well as programs that are funded with GGRF (such as the Low Carbon Transit Operations Program and Transit and Intercity Rail Capital Program).
Decreased State Funding Will Result in Fewer Transportation Projects and Activities, With Specific Impacts Varying by Program. Absent a funding backfill from alternative sources or significant changes in how the Legislature chooses to allocate remaining funds, the estimated funding reductions will result in programs having less capacity to support state and local transportation projects and activities. This does not mean that calls for expenditures will decrease at the same rate as funding declines, however. In fact, demands for transportation spending on maintenance and capital projects likely will increase in the coming years due to causes such as impacts from climate change. The exact impacts on specific programs will depend on several factors, including the magnitude of the estimated funding reductions and the degree to which that program or activity relies on state funds as compared to other sources. For instance, Caltrans’ highway maintenance and rehabilitation programs—which face significant funding declines and rely heavily on state resources—will experience an overall reduction in the number of projects the department can complete on the state highway system. This likely will result in a decline in highway conditions for drivers. In cases where programs distribute funding to local governments, such as for local streets and roads and the State Transit Assistance program, the magnitude of the impacts will vary across jurisdictions. This is because certain local governments rely less heavily on state funding to support their transportation activities. For instance, some counties have voter‑approved sales tax measures that dedicate funding to transportation purposes, such as local streets and roads and/or transit, meaning state funds make up a smaller share of their overall programmatic support budgets. These areas of the state still will experience net losses in funding—and, therefore, likely reduced levels of service or fewer projects—but still would have another source of more stable funding upon which to rely. In contrast, jurisdictions that historically have been more dependent on state funding for their local efforts will experience greater impacts across their transportation systems, likely resulting in reduced services and/or poorer road conditions for their residents. To mitigate impacts on state and local programs, the Legislature could consider alternative funding sources to partially or fully backfill the lost fuel tax revenues, as we discuss next.
Options to Address Approaching Transportation Funding Gap
In light of the above forecasted trend, the Legislature likely will want to start planning and weighing various options to address the anticipated drop in state transportation revenues over the coming decades. This section provides an overview of the key criteria the Legislature could use in considering alternative transportation funding approaches, as well as a discussion of some of the key options—including associated trade‑offs—for addressing the forthcoming funding gap.
Key Considerations for Weighing Various Options. We identify four key criteria the Legislature can use to help guide its evaluation of options for addressing declining state transportation revenues:
- “User‑Pays” Principle. Are the costs of maintaining and improving the state’s transportation system paid by those who use and benefit from the system?
- Equity. How are the impacts distributed amongst various groups, such as by income level and/or geography?
- Ease of Implementation. Are there significant state costs associated with implementation? How complicated would the option be to implement for the state and the public?
- Revenue Stability and Sustainability. Are the additional revenues sustainable over the long run? Does this option address the structural fuel tax funding shortfall resulting from increasing fuel efficiency and ZEV adoption?
Legislature Has Several Options for Funding Transportation but Each Comes With Trade‑Offs. We have identified four broad categories of options the Legislature could consider to address the anticipated decline in historical state funding sources for transportation. These include: (1) increasing existing fuel taxes and vehicle fees, (2) shifting transportation costs to other fund sources, (3) reducing and reprioritizing spending for transportation programs, and (4) generating revenues from new transportation‑related charges. Below, we analyze the benefits and trade‑offs of these options based on the above criteria, which we also summarize in Figure 10. These options are not necessarily mutually exclusive; the Legislature could consider a combination of actions over the coming years. For example, it could consider adopting a moderate increase to vehicle fees to help “buy time” and avoid major impacts from revenue declines over the next few years while it takes steps to develop and implement a more permanent (and potentially complicated) longer‑term solution, such as a road charge.
Figure 10
Options to Address Approaching Transportation Funding Gap
|
Options |
Key Trade‑Offs to Consider |
|
Increase Existing Fuel Taxes and Vehicle Fees |
|
|
Increase Existing Fuel Taxes |
|
|
Increase Existing Vehicle Fees |
|
|
Shift Transportation Costs to Other Fund Sources |
|
|
Use General Fund or Existing Special Funds for Transportation |
|
|
Reduce Spending on Transportation Programs |
|
|
Reduce and Reprioritize Transportation Spending |
|
|
Adopt New Transportation‑Related Charges |
|
|
Implement Road Charge |
|
|
Implement New Taxes on Alternative Fuels |
|
|
ZEV = Zero‑emission vehicle. |
|
Increase Existing Fuel Taxes and Vehicle Fees
Increase Existing Fuel Taxes. The Legislature could increase existing fuel taxes to offset declining state transportation revenues. Such an approach would be relatively easy to implement in that it continues existing charges, just at a higher rate. Increasing fuel taxes would be consistent with the state’s historic practice of generating transportation revenues through the user‑pays principle, whereby the costs of maintaining and improving the state’s transportation system are paid by those who use and benefit from the system. In the case of fuel taxes, an individual’s road usage is measured based on the amount on gasoline and diesel consumed. However, in examining this option, the Legislature will also want to consider how greater variabilities in fuel efficiency have—and will continue to—diminish the link between fuel consumption and road usage. For instance, owners of newer conventional vehicles pay less per mile when compared to owners of older vehicles. Increasing fuel taxes also raises equity considerations given that the increases would impose a larger relative burden on lower‑income households. This is because the increase would be applied uniformly regardless of income—so responding to an increased charge of 10 cents per gallon, for example, would require dedicating a larger proportional share of monthly expenditures for a lower‑earning household as compared to households with more resources upon which to draw. Furthermore, these impacts could become more regressive over time if higher‑income households continue to own a disproportionate share of fuel‑efficient vehicles and ZEVs. While increasing fuel taxes could provide the state with some additional funding in the near term, this approach is unlikely to be sustainable on a longer‑term basis. This is because total funding still would continue to decline as vehicle fuel efficiency and ZEV adoption rates increase in the coming years. As such, while raising existing fuel taxes could help slow the trajectory of anticipated revenue losses, the fact that the state’s policies are requiring a transition away from gasoline and diesel make this strategy infeasible as a permanent solution.
Increase Existing Vehicle Fees. The Legislature could increase existing vehicle fees, which would be similarly easy to implement. This approach would somewhat align with the user‑pays principle since the increases would impact vehicle owners who likely use and benefit from the state’s transportation system. However, in contrast to fuel taxes, vehicle fees are not closely tied to road usage because vehicle owners pay the same annual fee regardless of the amount they drive. As such, relying more heavily on revenues from such fees would represent a shift in how the state has historically funded transportation programs and activities. Increasing vehicle fees also could raise equity considerations given that the increases would impose a larger relative burden on lower‑income households if they were applied uniformly regardless of income. This could be offset to a certain extent depending on how the increases are structured. For instance, increases to TIF could avoid some of these adverse impacts by targeting vehicles above a specific value. To achieve a similar outcome, the state also could increase existing vehicle license fees—which also are based on the value of a vehicle—and direct the additional funding to support transportation. (Revenues collected from existing vehicle license fees are not currently used for state transportation programs and therefore are not discussed in detail in this report.) As compared to raising fuel taxes, increasing vehicle fees is more likely to provide stable funding over the long run since revenues are based on the number of vehicles, which—unlike fuel consumption—is not expected to decline over time. Yet while there could be some predictability and stability in the revenues raised by increasing vehicle fees, this source is not directly linked to changes in fuel tax revenues. As such, additional vehicle fee increases likely would be needed over time to keep pace with escalating declines in fuel tax revenues. Such an approach likely would result in extremely high fees over time.
Shift Transportation Costs to Other Fund Sources
Use General Fund or Existing Special Funds for Transportation. The Legislature could offset declining transportation revenues by shifting costs to the General Fund or other special funds. This option would deviate from the user‑pays principle and would represent a significant shift in how the state historically has supported transportation. However, there is some precedent for this approach in limited amounts, such as the state providing a portion of GGRF revenues to support transportation programs. Furthermore, a reasonable rationale exists for funding certain transportation costs from other sources in some cases. For instance, the state’s transportation system provides some broad‑based benefits to both drivers and non‑vehicle users—such as individuals and businesses that benefit from delivery services via roadways—which could justify some associated General Fund expenditures. General Fund support could be provided directly or through paying the debt service on a potential new voter‑approved general obligation bond. (While a general obligation bond could provide a significant infusion of funding for transportation over a limited period of time, it would come with unique considerations, such as increasing the total cost of the associated projects due to additional interest payments, as well as committing additional future state resources to pay debt service over several decades.) The Legislature could determine the appropriate mix of these two strategies based on the state’s fiscal condition and budget priorities. For example, it could ask voters to approve a bond in years where a large up‑front infusion of funding might be desired to achieve economic stimulus, pursue specific high‑priority transportation goals, or because other funding is not readily available. Both the justification for and the equity considerations of shifting other funding to transportation purposes would depend on the source and usage of that funding. A key consideration is that such a shift likely would mean reducing or limiting support for other state programs and priorities—particularly in years when the state does not have a budget surplus—which could raise difficult trade‑offs. While shifting funds from other sources could provide a stable source of additional funding for transportation, it likely would not be directly linked to the rate of decline for fuel tax revenues. As such, additional funding likely would be needed from these sources over time as fuel tax revenues continue to decrease.
Reduce Spending on Transportation Programs
Reduce and Reprioritize Expenditures to Align Transportation Spending With Available Revenues. The Legislature also could choose to reduce state transportation spending as revenues decline over time. A benefit of this option is that it would not require the state to increase taxes and fees or redirect funding from other sources. However, given that statewide transportation needs are unlikely to decrease over time, this option likely would have negative impacts on the condition and performance of the state’s transportation system. In fact, needs are likely to increase over time due to climate change impacts such as sea‑level rise and flooding causing damage to and undermining existing transportation infrastructure. Additionally, maintenance needs may be exacerbated by additional road wear due to increasing vehicle weights, particularly as more of the state’s vehicle fleet transitions to ZEVs, which tend to be heavier than conventional vehicles. The state also may need to make additional expenditures within the transportation sector to meet its goals of reducing VMT, such as expanding transit services and biking and walking infrastructure. The Legislature could seek to manage the decline in revenues—at least in part—by reprioritizing remaining funds on what it views to be the most critical activities. For example, this could include focusing on operations and maintenance rather than new capital projects. Additionally, local governments could potentially take actions to help offset declines in the state funding that currently supports local streets and roads and transit, such as by raising additional revenues or shifting local funding from other purposes. However, not all regions of the state will be able to take these actions.
Adopt New Transportation‑Related Charges
Implement a Road Charge. The Legislature could seek to offset declining revenues by enacting a new transportation charge based on the number of miles a particular vehicle drives. A road charge, sometimes also referred to as a mileage‑based user charge or a VMT charge, would levy a per‑mile charge on all vehicles regardless of their fuel source. Mileage information could be collected through various reporting methods, such as odometer readings, vehicle plug‑in devices, or in‑vehicle telematics. The charge could be applied based solely on miles driven, but also could incorporate other factors, such as vehicle weight or time of day. (Please see the nearby box for more details on the state’s recent efforts to pilot a road charge approach.) A road charge would align with the user‑pays principle since the amount owed would depend solely on road usage. From an equity perspective, a road charge would impose a larger relative burden on lower‑income households. This is because the charge would be applied uniformly regardless of income. Moreover, some studies have found that high housing costs have pushed higher proportions of lower‑income households to live farther away from their workplaces and urban centers, resulting in comparatively longer commute distances (and correspondingly higher costs from both fuel consumption or a potential road charge). However, some research suggests that lower‑income households would benefit from paying a road charge as compared to the existing fuel tax structure given that this group tends to own less fuel‑efficient vehicles. Implementing a road charge would be a significant undertaking and the state likely would have to overcome a number of potential challenges. These include privacy and security concerns from the public around the collection of mileage information. Additionally, a road charge likely would require higher costs to administer when compared to fuel taxes and vehicle fees. For instance, the gasoline excise tax is collected from a small number of fuel wholesalers and is relatively inexpensive to administer, costing the state less than 1 percent of collected revenues. A road charge would involve collecting mileage information—potentially via several different reporting options—and payments from the state’s 27 million licensed drivers. Some studies suggest that collection and enforcement costs associated with a road charge could range from 5 percent to 13 percent of collected revenues. However, even with greater administrative costs, a road charge likely would yield more revenues over the long run when compared to fuel taxes given the continued shift towards more fuel‑efficient vehicles and ZEVs. Because it could be charged on every vehicle regardless of fuel type, it could represent a viable and sustainable long‑term option throughout the state’s fleet transition.
State Has Undertaken Several Studies to Pilot Feasibility of a Road Charge
In recent years, the state has conducted several pilot efforts—in some cases with the federal government and partners from other states—that have focused on studying various aspects of implementing a road charge:
- Road Charge Pilot. Chapter 835 of 2014 (SB 1077, DeSaulnier) required the California State Transportation Agency (CalSTA) to test the feasibility of implementing a road charge. The pilot was completed in 2017. Results largely proved such a charge would be feasible, but the final report noted key areas of further research that were needed to ensure driver privacy and data security and to prevent fraud.
- Regional Pilot. This federally‑funded pilot study tested how to accommodate multiple sets of road charge requirements, processes, systems, and rates from across different states and/or jurisdictions. The pilot was conducted by Oregon and California—through the California Department of Transportation (Caltrans)—and was completed in 2021. Results indicated that a clearinghouse could be beneficial in supporting the interoperability of a road charge.
- Four‑Phase Demonstration Pilot. This federally‑funded pilot tested the collection of a road charge through the following technologies: usage‑based insurance, ridesharing, electric vehicle charging stations/pay‑at‑the‑pump systems, and autonomous vehicles. The pilot was completed by Caltrans in 2022. Results indicated that there could be success in collecting a road charge from the technologies studied.
- Public and Private Roads Pilot. This federally‑funded pilot tested the ability of current global positioning system technologies to differentiate between public and private roads in a road charge system. Caltrans completed testing for this pilot in the fall of 2023 and expects to release a report on its final results in the summer of 2024.
- Road Charge Revenue Collection Pilot. Chapter 308 of 2021 (SB 339, Wiener) requires CalSTA to conduct a road charge pilot study that collects payments from participants. The development of the pilot is currently underway, with implementation expected to begin in 2024. The legislation requires CalSTA to provide the Legislature with an interim report on its results by July 1, 2024 and a final report by December 31, 2026.
In addition to the work being undertaken in California, other states have conducted or are in the process of conducting road charge pilot studies. Moreover, three states—Oregon, Utah, and Virginia—have active, voluntary road user charge programs. The U.S. Department of Transportation also is in the early stages of developing a national road charge pilot program.
Implement New Taxes on Alternative Fuels. The state could levy taxes on the consumption of alternative fuels such as hydrogen and electricity. This strategy would align with the user‑pays principle in a similar manner as current fuel taxes on gasoline and diesel. That is, an individual’s road usage would be measured based on the consumption of a specific fuel. While alternative fuel taxes would have the benefit of capturing additional revenues from vehicles that use these fuels, they do pose unique challenges in some cases. For instance, levying taxes on the electricity used to charge vehicles at home—where most charging occurs—would be a complex and costly task for the state to undertake. This is because it would require the installation of metering technologies that are able to differentiate between electricity consumed by vehicles versus other household devices. From an equity perspective, alternative transportation fuel taxes would impose a larger relative burden on lower‑income households. This is because the tax would be applied uniformly regardless of income. Impacts to lower‑income households also could be exacerbated in certain instances. For example, if implementation complications led the state to only levy a tax on electricity consumed at public charging stations, the tax’s impact would be concentrated on vehicle owners who do not have access to home charging. This could result in a disproportionate burden on renters, who generally have lower incomes on average. Alternative fuel taxes would be able to generate additional revenues and likely would grow over time as ZEV adoption increases. Given that these taxes could be charged based on the consumption of electricity and hydrogen, this option could address funding declines related to increasing ZEV adoption over the long run. However, this approach would not track with declines in fuel tax revenues associated with increasing fuel efficiency for conventional vehicles that continue to be driven in the state.
Next Steps
The findings we highlight in this report lead to two primary conclusions: state transportation funding and programs will be significantly impacted by California’s climate policies; however, significant uncertainty remains around when the resulting funding declines will materialize. This leads us to two overarching suggestions for next steps the Legislature could consider taking to address the anticipated funding shortfall.
Continue to Monitor State Transportation Revenues and Programs. We recommend the Legislature continue monitoring state transportation revenues and programs over the coming years. Because the rate at which anticipated impacts occur will depend on various factors, how quickly the funding shortfalls will materialize and when additional actions will be needed still are uncertain. It will therefore be important for the Legislature to continue to track this issue closely over the coming years—including the rate at which revenues are declining and how significantly program funding levels are being affected—to help inform how and when it might want to take additional steps. The Legislature has a number of ways it could monitor state transportation revenues and programs. This could include holding legislative hearings or having the administration report regularly to the Legislature. For example, through Chapter 508 of 2022 (SB 1121, Gonzalez) the Legislature has directed the California Transportation Commission to prepare a needs assessment of the costs to operate, maintain, and grow the state’s transportation system over the forthcoming ten years, including a forecast of revenues and potential funding shortfalls. The interim report is due January 1, 2024, with a final report due January 1, 2025 and every five years thereafter. The Legislature could use this existing report as a tool to monitor revenue trends, perhaps modifying statute to require more frequent updates if it wanted to track developments more closely.
Begin Developing a Long‑Term Plan for How to Address Future Revenue Declines. We recommend the Legislature begin to develop a plan for how it will address impending declines in state transportation revenues. While the Legislature has several approaches with which it could respond, each comes with various benefits and trade‑offs that will need to be considered. Beginning to weigh these options now would better position the state to act in the future when revenue declines become more significant. Developing this plan also could help identify what steps might need to be taken in the near term. For instance, if the Legislature were to consider implementing a road charge, it would want to understand what actions the state would need to take to initiate this effort, such as potentially beginning implementation with a subset of vehicles in the state. The Legislature could develop such a plan in several ways, such as through a legislative task force; a blue‑ribbon committee; or a state department in coordination with representatives from various state and local agencies, academia, and stakeholder groups.
Conclusion
The Legislature has established ambitious GHG reduction goals to help mitigate the magnitude and impacts of climate change. Achieving these goals will require significant adjustments within the transportation sector, such as increasing the adoption of ZEVs and reducing VMT. These changes will in turn have significant impacts on state transportation revenues and programs. Accordingly, as next steps we recommend the Legislature continue monitoring state transportation revenues and programs over the coming years to keep track of how quickly these changes will materialize, while simultaneously beginning to develop a long‑term plan for how to address future revenue declines.