Kenneth Kapphahn
November 20, 2024
The 2025‑26 Budget
Fiscal Outlook for Schools and
Community Colleges
Executive Summary
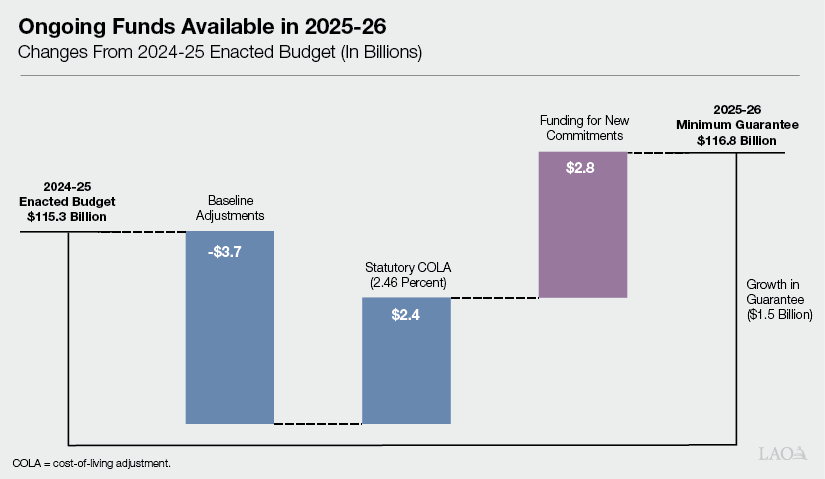
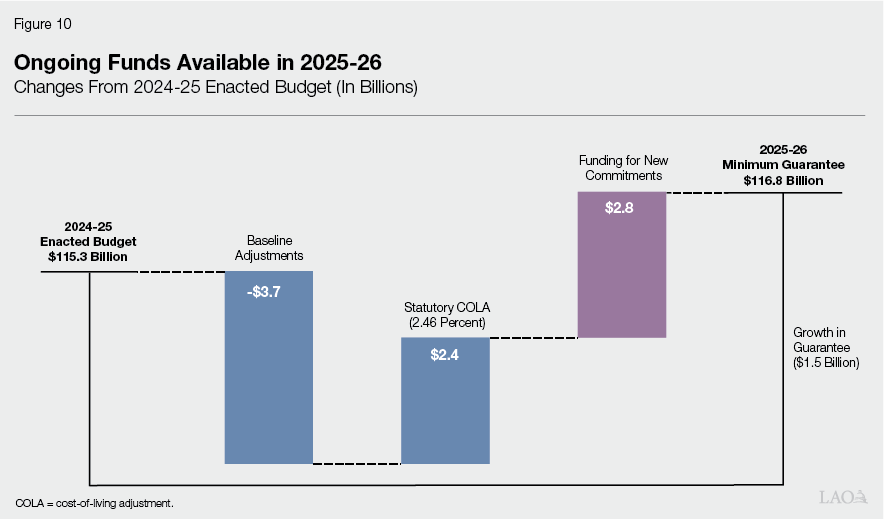
Moderate Increase in School Funding Projected for 2025‑26. Each year, the state calculates a “minimum guarantee” for school and community college funding based upon a set of formulas established by Proposition 98 (1988). Under our outlook, the guarantee in 2025‑26 is $1.5 billion (1.3 percent) above the 2024‑25 enacted budget level. In addition, $3.7 billion in funding is freed‑up from the expiration of various one‑time costs and other formula‑driven adjustments. After accounting for the freed‑up funding and the cost of providing a 2.46 percent statutory cost‑of‑living adjustment for school and community college programs, we estimate that $2.8 billion would be available for new commitments (see figure below). The Legislature could set aside a portion of this amount to eliminate the payment deferrals it adopted in the June 2024 budget plan, which would help build budget resiliency. For the remaining funds, dedicating a portion for one‑time spending would create a buffer to help protect ongoing programs in case the guarantee is lower than expected in the future.
Funding Increase in 2024‑25 Deposited Into Proposition 98 Reserve. Separate from our estimates for 2025‑26, we estimate the Proposition 98 guarantee in 2024‑25 is up $3 billion (2.6 percent) relative to the enacted budget level. Constitutional formulas would require the state to deposit nearly all of this additional funding into a statewide reserve account for schools and community colleges (the Proposition 98 Reserve). This deposit would bring the balance of the reserve to $3.7 billion.
Introduction
Report Provides Our Fiscal Outlook for Schools and Community Colleges. State budgeting for schools and the California Community Colleges is governed largely by Proposition 98 (1988). The measure establishes a minimum annual funding requirement for K‑14 education commonly known as the minimum guarantee. In this report, we provide our estimates of the guarantee and analyze the implications for school and community college budgeting. First, we review the formulas that determine the guarantee. Next, we explain how our estimates of the guarantee in 2023‑24 and 2024‑25 differ from the state’s previous estimates. Third, we estimate the guarantee over the 2025‑26 through 2028‑29 period under our economic forecast. Finally, we compare the funding available under the guarantee with the cost of existing education programs and identify some issues for the Legislature to consider in the coming year. (The 2025‑26 Budget: California’s Fiscal Outlook contains our outlook for the overall state budget.)
Background
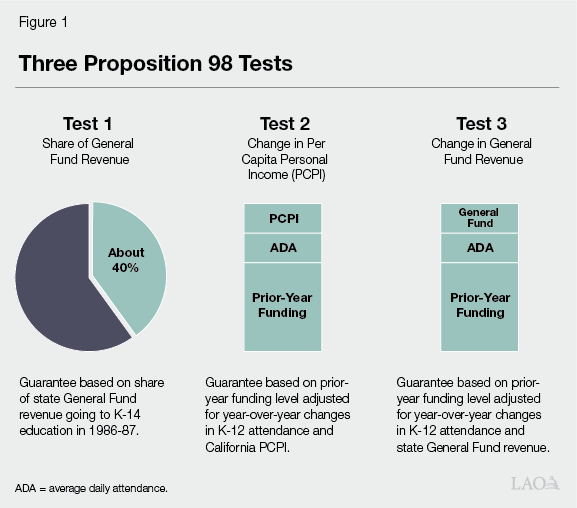
Minimum Guarantee Depends Upon Various Inputs and Formulas. The California Constitution sets forth three main tests for calculating the Proposition 98 guarantee. Each test takes into account certain inputs, including General Fund revenue, per capita personal income, and student attendance (Figure 1). Whereas Test 2 and Test 3 build upon the amount of funding provided the previous year, Test 1 links school funding to a minimum share of General Fund revenue. The Constitution sets forth rules for comparing the tests, with one of the tests becoming operative and used for calculating the guarantee that year. Although the state can provide more funding than required, it usually funds at or near the guarantee. With a two‑thirds vote of each house of the Legislature, the state can suspend the guarantee and provide less funding than the formulas require that year. The state funds the guarantee through state General Fund and local property tax revenue.
“Maintenance Factor” Accelerates Growth in the Guarantee. In addition to the three main tests, the Constitution requires the state to track an obligation known as maintenance factor. The state creates maintenance factor when Test 3 is operative or the Legislature suspends the guarantee. The maintenance factor obligation equals the difference between the actual level of funding provided and the higher Test 1 or Test 2 level. Moving forward, the state adjusts the obligation each year for changes in student attendance and per capita personal income. In subsequent years when General Fund revenue is growing faster than per capita personal income, the Constitution requires the state to make maintenance factor payments. The size of these payments increases in tandem with higher year‑over‑year revenue growth.
“Spike Protection” Slows Growth in the Guarantee. Whereas maintenance factor payments accelerate growth in the Proposition 98 guarantee, a separate formula known as spike protection prevents the guarantee from growing at an unsustainable rate. This formula applies when the guarantee is increasing much faster than per capita personal income and student attendance. The formula works by excluding some Proposition 98 funding from the calculation of the guarantee in the subsequent year. Technically, it reduces the Test 2 and Test 3 funding levels from what they otherwise would be in the year following the increase. These lower levels are then used in the comparison with Test 1 (which is unaffected). The purpose of spike protection is to protect the state budget from needing to sustain increases in the guarantee that are the result of temporary revenue spikes.
At Key Points, the State Recalculates the Guarantee. The state makes an initial estimate of the guarantee when it enacts the annual budget, but this estimate typically changes as the state updates the relevant Proposition 98 inputs. The state recalculates the guarantee at the end of the year based upon revised estimates of these inputs, then makes a second recalculation at the end of the following year. This schedule means that for any given budget, the state has new estimates of the Proposition 98 guarantee for the prior year, current year, and upcoming year. For the prior year, the state finalizes its calculation through a process known as “certification.” Certification involves the publication of the underlying Proposition 98 inputs and a period for public comment and review. The most recently certified year is 2022‑23.
Legislature Decides How to Allocate Proposition 98 Funding. Once the state has calculated the guarantee, the Legislature decides how to allocate the available funding among school and community college programs. Since 2013‑14, the Legislature has allocated most funding for schools through the Local Control Funding Formula (LCFF). A school district’s allotment depends on its size (as measured by average daily attendance) and the share of its students who are low income or English learners. The Legislature allocates most community college funding through the Student Centered Funding Formula (SCFF). A college district’s allotment depends on its enrollment, share of low‑income students, and performance on certain outcome measures.
School and Community College Programs Typically Receive COLA. The state calculates a statutory cost‑of‑living adjustment (COLA) each year using a price index published by the federal government. This index tracks changes in the cost of goods and services purchased by state and local governments across the country. Costs for employee wages and benefits are the largest factor in the index. Other factors include costs for fuel, utilities, supplies, equipment, and facilities. The state finalizes the statutory COLA rate based upon the data available in May prior to the start of the fiscal year. State law automatically increases LCFF for the COLA unless the guarantee—as estimated in the enacted budget—is insufficient to cover the associated costs. In these cases, the Department of Finance may reduce the COLA rate to fit within the available Proposition 98 funding. For community college programs, the state typically provides the same COLA that it provides for school programs.
Proposition 98 Reserve Deposits and Withdrawals Required Under Certain Conditions. Proposition 2 (2014) created a state reserve specifically for schools and community colleges—the Public School System Stabilization Account (Proposition 98 Reserve). The Constitution requires the state to deposit Proposition 98 funding into this reserve when the state receives high levels of capital gains revenue and the minimum guarantee is growing quickly relative to inflation. It also requires the state to withdraw funding from the reserve when the guarantee is growing more slowly than inflation. When the state’s overall fiscal condition is relatively weak, the Legislature can suspend or reduce required deposits or make additional discretionary withdrawals. Unlike other state reserve accounts, the Proposition 98 Reserve is earmarked exclusively for school and community college programs.
Proposition 98 Reserve Linked With Cap on School Districts’ Local Reserves. State law caps school district reserves after the Proposition 98 Reserve reaches a certain threshold. Specifically, the cap applies if the funds in the Proposition 98 Reserve in the previous year exceed 3 percent of the Proposition 98 funding allocated to schools that year. When the cap is operative, medium and large districts (those with more than 2,500 students) must limit their reserves to 10 percent of their annual expenditures. Smaller districts are exempt. The law also exempts reserves that are legally restricted to specific activities and reserves designated for specific purposes by a district’s governing board. In addition, a district can receive an exemption from its county office of education for up to two consecutive years. The cap has been operative in previous years but is inoperative as of 2024‑25.
2023‑24 and 2024‑25 Updates
State’s Job Market and Consumer Spending Remain Lackluster… California’s economy has been in a slowdown for nearly two years, characterized by a soft labor market and weak consumer spending. Although this slowdown has been milder than a recession, recent economic data reflect below‑average performance in several indicators (Figure 2). Outside of government and health care, the state has added no jobs over the past 18 months. Similarly, the number of Californians who are unemployed is 25 percent higher than during the strong labor markets of 2019 and 2022. Consumer spending—as measured by inflation‑adjusted retail sales and taxable sales—has continued to decline throughout 2024.
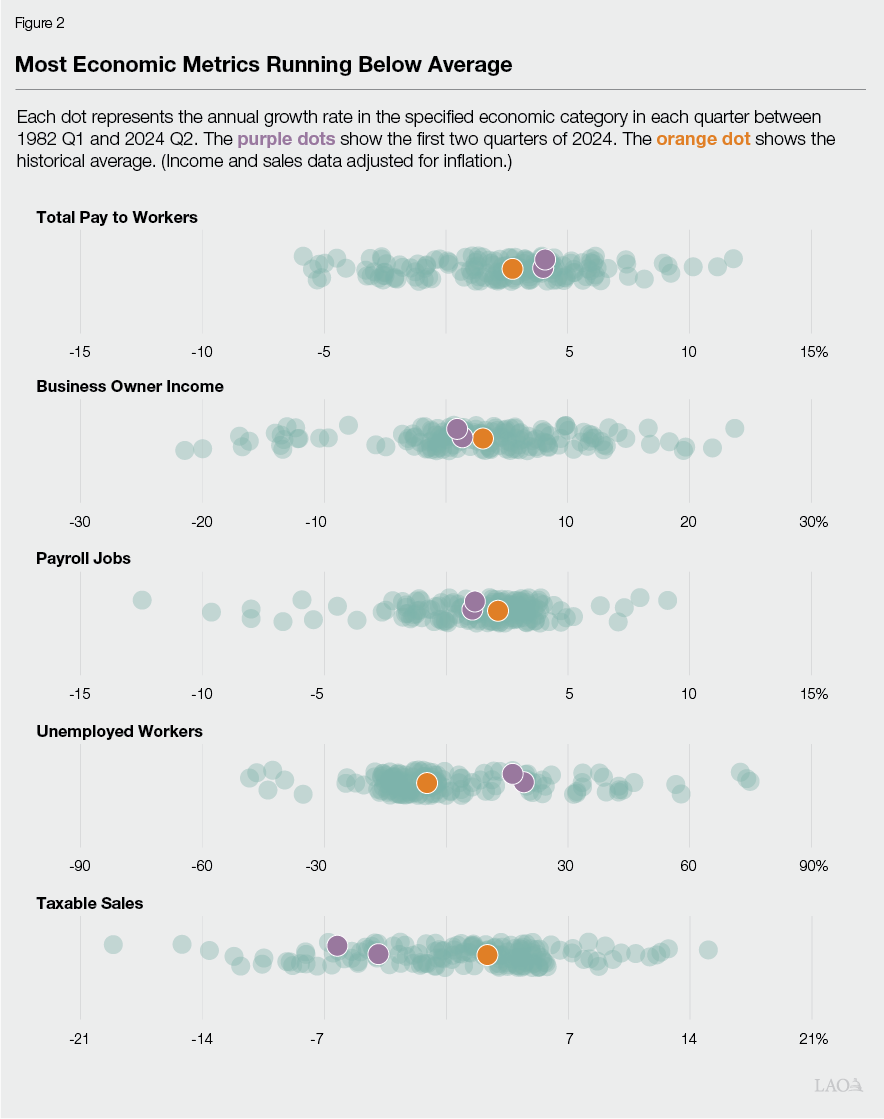
…But Gains for High‑Income Workers Are Driving State Revenues Above Projections. Despite this economic weakness, total pay for California workers has been growing quickly. During the first quarter of 2024, for example, total pay increased at an annualized rate of 17 percent—one of the strongest quarters on record. State income tax receipts have followed this trend, with withholding collections up nearly 10 percent this year relative to 2023 levels. Most of this increase appears linked with special forms of pay for high‑income workers, such as bonuses and stock compensation. These increases, in turn, are linked with the recent run up in the stock market. Stock compensation has become an increasingly important form of pay among California’s high‑income workers, especially those at major technology companies. This form of compensation is tied to the company’s stock price, so it rises when stock prices rise.
State Suspended the Proposition 98 Guarantee in 2023‑24. The June 2024 budget plan suspended the guarantee in 2023‑24 and approved $98.5 billion in funding for schools and community colleges. Although our estimate of General Fund revenue is up compared with the previous estimate, changes in revenue do not directly affect funding when the guarantee is suspended. Moreover, the additional revenue would not have led to higher funding even if the state had not invoked suspension. (In the absence of suspension, Test 2 would have been operative and the guarantee would have been linked with growth in per capita personal income rather than General Fund revenue.)
Proposition 98 Guarantee Revised Up in 2024‑25. Our estimate of the guarantee in 2024‑25 is up $3 billion (2.6 percent) relative to the June 2024 estimate (Figure 3). This increase reflects our higher estimates of General Fund and local property tax revenue. Test 1 is operative, meaning the guarantee increases nearly 40 cents for each dollar of additional General Fund revenue. In addition, the required maintenance factor payment increases by $761 million due to faster year‑over‑year growth in General Fund revenue. Under our estimates, the state would end 2024‑25 with a $3.3 billion maintenance factor obligation remaining. Regarding local property tax revenue, our estimates are up $789 million relative to the June 2024 estimates. This increase reflects recent data showing an uptick in home sales, which generate additional property tax revenue as properties are reassessed at market value. When Test 1 is operative, changes in property tax revenue have a dollar‑for‑dollar effect on the guarantee.
Figure 3
Updating Prior‑ and Current‑Year Estimates of the Guarantee
(In Millions)
|
2023‑24 |
2024‑25 |
||||||
|
June |
November |
Change |
June |
November |
Change |
||
|
Minimum Guarantee |
|||||||
|
General Fund |
$67,095 |
$67,006 |
‑$89 |
$82,612b |
$84,796b |
$2,183 |
|
|
Local property tax |
31,389 |
31,478 |
89 |
32,670 |
33,460 |
789 |
|
|
Totals |
$98,484a |
$98,484 |
— |
$115,283 |
$118,255 |
$2,973 |
|
|
General Fund tax revenue |
$185,490 |
$187,865 |
$2,375 |
$200,107 |
$203,919 |
$3,812 |
|
|
Maintenance factor payment |
— |
— |
— |
4,072 |
4,833 |
761 |
|
|
aThe June 2024 budget suspended the guarantee in 2023‑24 and set forth this amount as the intended level. bIncludes maintenance factor payment. |
|||||||
State Required to Make Larger Reserve Deposit in 2024‑25. Under our outlook, the amount of state revenue attributable to capital gains is several billion dollars above the previous estimate. These higher capital gains require the state to deposit $3.7 billion into the reserve (Figure 4). The June 2024 budget made a discretionary deposit into the Proposition 98 Reserve of nearly $1.1 billion. (No deposit was required by formula.) Provisional language in the budget automatically counts the previous deposit toward the higher requirement. This higher deposit absorbs nearly all of the increase in the guarantee in 2024‑25 that would materialize under our outlook estimates. The deposit also makes the local reserve cap for school districts operative in the following year.
Figure 4
Prior‑ and Current‑Year Updates Include Larger Reserve Deposit in 2024‑25
(In Millions)
|
2023‑24 |
2024‑25 |
||||||
|
June |
November |
Change |
June |
November |
Change |
||
|
Minimum Guarantee |
$98,484a |
$98,484 |
— |
$115,283 |
$118,255 |
$2,973 |
|
|
Allocations |
|||||||
|
Local Control Funding Formulab |
$81,308 |
$81,360 |
$52 |
$80,923 |
$81,117 |
$193 |
|
|
Other K‑14 programs |
25,590 |
25,637 |
47 |
33,305 |
33,423 |
118 |
|
|
Reserve deposit/withdrawal (+/‑) |
‑8,413 |
‑8,413 |
— |
1,054 |
3,708 |
2,654 |
|
|
Totals |
$98,484 |
$98,584 |
$100 |
$115,283 |
$118,248 |
$2,966 |
|
|
Spending Above/Below Guarantee (+/‑) |
— |
$100 |
$100 |
— |
‑$7 |
‑$7 |
|
|
aThe June 2024 budget suspended the guarantee in 2023‑24 and set forth this amount as the intended level. bIncludes school districts, charter schools, and county offices of education. |
|||||||
Program Cost Estimates Revised Up Slightly in 2023‑24 and 2024‑25. For 2023‑24, the latest available data show that spending on LCFF and other formula‑driven programs is up $100 million compared with June 2024 estimates. For 2024‑25, we estimate that spending is up $311 million compared with June 2024 estimates. Of this increase, $193 million is attributable to the LCFF. Although the main components of the LCFF generally are tracking previous estimates, the costs for a few of the “add‑ons”—primarily state reimbursements for school transportation—are running ahead of projections. The other $118 million in additional spending is attributable to adjustments involving SCFF, special education, and support for low‑performing school districts.
Estimate of the Guarantee in 2024‑25 Is Highly Sensitive to Revenue Changes. To the extent that General Fund revenue differs from our estimates in 2024‑25, the guarantee would increase or decrease nearly 95 cents for each dollar of higher or lower General Fund revenue. This unusual dynamic arises because Test 1 is operative and the state is making maintenance factor payments. Specifically, the state would need to dedicate nearly 40 cents of each additional dollar to meeting the regular Test 1 requirement and nearly 55 cents of each additional dollar to paying maintenance factor. This sensitivity means that any changes in revenue in 2024‑25 fall almost entirely on the school and community college portion of the state budget and have relatively little impact on non‑education programs. (This sensitivity analysis holds every input constant except state revenues in 2024‑25. Changes in property tax revenue and certain other inputs also could affect the guarantee.)
Estimate of the Required Reserve Deposit Is Highly Sensitive to Changes in Capital Gains. Whereas the guarantee is highly sensitive to changes in General Fund revenue, the required Proposition 98 Reserve deposit is highly sensitive to changes in revenue from capital gains. Specifically, the required deposit would increase or decrease nearly 95 cents for each dollar of higher or lower capital gains revenue. This requirement means that increases or decreases in the guarantee might not translate into more or less funding for school and community college programs. One complication is that estimates of total state revenues and capital gains revenue do not necessarily move in tandem. For example, updated data in May could show that total revenues are tracking our outlook estimates but capital gains account for a larger portion of those revenues. Under this scenario, the state would be required to make a larger reserve deposit even if the guarantee has not increased by the same amount.
Multiyear Outlook
In this section, we estimate the minimum guarantee for 2025‑26 and the following three years under our economic and revenue forecast. We also examine the Proposition 98 Reserve and several factors affecting costs for school and community college programs.
Economic and Revenue Picture
Forecast Assumes Weak Revenue Growth in 2025‑26 and Moderate Growth in Subsequent Years. Our forecast anticipates General Fund revenue growth of 1.2 percent in 2025‑26. This growth is well below the historical average of about 6 percent annually over the past 15 years. This estimate reflects the risk that the existing weakness in the state economy could persist into the upcoming year, as well as continued warning signs that the national economy faces an elevated risk of a slowdown moving forward. In subsequent years, we assume General Fund revenue growth accelerates to 3.5 percent in 2026‑27 and about 5.5 percent per year in 2027‑28 and 2028‑29. These assumptions reflect a gradual return to the historical rate of growth, partially offset by an adjustment for policies in the June 2024 budget. Specifically, the budget suspended the ability of most businesses to claim certain tax deductions and credits in the 2024, 2025, and 2026 tax years. Eligible businesses, however, can continue to accrue credits and deductions they are unable to claim during this period. Our forecast accounts for lower corporate tax revenues beginning in the 2027 tax year as businesses begin to use their saved‑up credits and deductions.
Federal Decisions About Interest Rates Are a Notable Source of Uncertainty. Over the past two years, the Federal Reserve has adopted a series of actions to bring down the rate of inflation. Most notably, it has increased interest rates several times and reduced the amount of money available for lending and investment. These actions have been a major cause of the current weakness in the state economy. As inflation has eased, the Federal Reserve has begun to unwind these actions. If inflation stabilizes at a lower level and the Federal Reserve continues to reduce interest rates, the California economy could improve and state revenues could outperform our forecast over the next several years. Conversely, an uptick in inflation and increase in interest rates could magnify existing weakness and cause revenues to underperform.
Stock Market Is Another Important Source of Uncertainty. Much of the revenue improvement in our forecast builds upon gains for high‑income workers that are driven by strong stock market performance. A stock market rally, however, can reverse quickly. Moreover, some indicators suggest the stock market has reached a level it may be unable to sustain. For example, current stock prices relative to past corporate earnings (a common measure of how “expensive” stocks are) have reached levels rivaled only by the transitory booms of 1999 and 2021. Furthermore, a single company (Nvidia) accounts for about one‑third of the total gains in the S&P 500 stock index over the last year. Regarding state revenues, stock pay alone at four major technology companies accounted for almost 10 percent of the state’s total income tax withholding in the first half 2024. A reversal in the stock market—or even a drop limited to these companies—could reduce state revenues significantly. On the other hand, developments over the coming year could solidify gains in the stock market and generate additional revenue. For example, if recent optimism over artificial intelligence proves warranted, stock prices for technology companies could continue to grow.
The Minimum Guarantee
Guarantee in 2025‑26 Grows Modestly Relative to Previously Enacted Budget Level… Under our forecast, the minimum guarantee grows to $116.8 billion in 2025‑26, an increase of $1.5 billion (1.3 percent) compared with the level in the 2024‑25 enacted budget (Figure 5). Test 1 is operative in 2025‑26, and increases in General Fund revenue and local property tax revenue both contribute to growth in the guarantee. The increase also reflects an ongoing adjustment of nearly $800 million for the expansion of transitional kindergarten. (In 2022‑23, the state began implementing a plan to make all four‑year‑old children eligible for transitional kindergarten over a four‑year period. As part of this plan, the Legislature and Governor agreed to adjust the guarantee upward for the additional students enrolling in the program each year. The state is making the final adjustment in 2025‑26.)
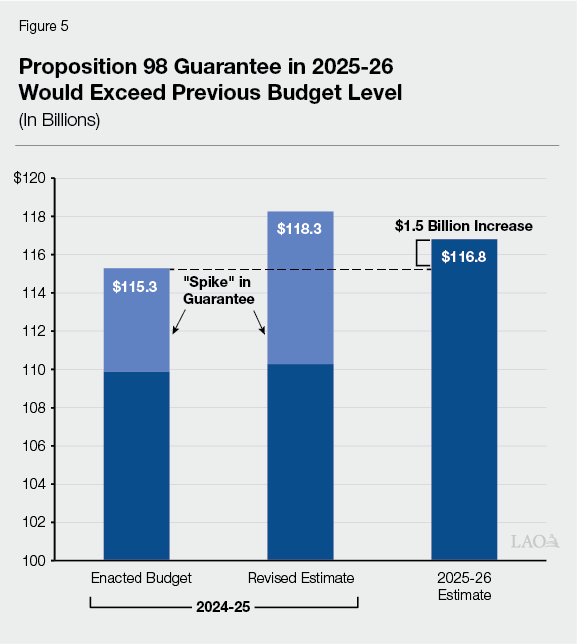
…But Declines Relative to Revised Estimate of 2024‑25. Although the guarantee in 2025‑26 is $1.5 billion above the previously enacted budget level, it is $1.5 billion (1.2 percent) below our revised estimate of the guarantee in 2024‑25. This year‑over‑year decrease is due to the spike protection formula in Proposition 98. This formula effectively treats a portion of the guarantee in 2024‑25 as a one‑time spike and excludes that amount from the calculation of the guarantee in the following year. Absent this adjustment, a different Proposition 98 test (Test 3) would have been operative in 2025‑26 and the guarantee would have been $4.1 billion higher than the estimate in our outlook.
Guarantee Is Moderately Sensitive to General Fund Changes in 2025‑26. General Fund revenue tends to be the most volatile input in the calculation of the Proposition 98 guarantee. For any given year, the relationship between the guarantee and General Fund revenue generally depends on which Proposition 98 test is operative and whether another test could become operative with higher or lower revenue. In 2025‑26, Test 1 is likely to remain operative even if General Fund revenue or other inputs vary significantly from our forecast. In Test 1 years, the guarantee changes about 40 cents for each dollar of higher or lower General Fund revenue. Based on recent data, the state seems unlikely to make any maintenance factor payments in 2025‑26. Specifically, the data indicate unusually strong growth in per capita personal income (8.4 percent), and maintenance factor payments are not required unless General Fund revenue were to outpace this growth.
Moderate Growth in the Guarantee After 2025‑26. Figure 6 shows our estimates of the guarantee under our forecast through 2028‑29. The annual increases in the guarantee are moderate after 2025‑26, with growth averaging $5.8 billion (4.7 percent) annually over the following three years. This rate of growth closely tracks our estimate of the increase in General Fund revenue. By the end of the period, the guarantee would be $17.4 billion above the 2025‑26 level. Additional spending from the state General Fund would cover about 70 percent of this increase, whereas growth in local property tax revenue would cover the other 30 percent.
Figure 6
Proposition 98 Outlook
(Dollars in Millions)
|
2024‑25 |
2025‑26 |
2026‑27 |
2027‑28 |
2028‑29 |
|
|
Minimum Guarantee |
|||||
|
General Fund |
$84,796 |
$81,747 |
$85,161 |
$89,735 |
$94,148 |
|
Local property tax |
33,460 |
35,052 |
36,123 |
38,062 |
40,073 |
|
Totals |
$118,255 |
$116,799 |
$121,284 |
$127,797 |
$134,221 |
|
Change From Prior Year |
|||||
|
General Fund |
$17,690 |
‑$3,049 |
$3,414 |
$4,574 |
$4,413 |
|
Percent change |
26.4% |
‑3.6% |
4.2% |
5.4% |
4.9% |
|
Local property tax |
$1,982 |
$1,592 |
$1,071 |
$1,939 |
$2,011 |
|
Percent change |
6.3% |
4.8% |
3.1% |
5.4% |
5.3% |
|
Total guarantee |
$19,672 |
‑$1,457 |
$4,485 |
$6,513 |
$6,424 |
|
Percent change |
20.0% |
‑1.2% |
3.8% |
5.4% |
5.0% |
|
General Fund Tax Revenuea |
$203,919 |
$206,457 |
$213,686 |
$224,939 |
$237,777 |
|
Growth Rates |
|||||
|
K‑12 average daily attendance |
0.2% |
0.5% |
‑1.2%b |
‑0.9%b |
‑1.1% |
|
Per capita personal income (Test 2) |
3.6 |
8.4 |
5.6 |
5.4 |
5.5 |
|
Per capita General Fund (Test 3)c |
8.9 |
1.7 |
3.8 |
5.5 |
5.9 |
|
Maintenance Factor |
|||||
|
Amount created/paid (+/‑) |
‑$4,833 |
— |
$2,044 |
— |
— |
|
Amount outstandingd |
3,331 |
$3,626 |
5,873 |
$6,188 |
$6,452 |
|
Proposition 98 Reserve |
|||||
|
Deposit (+) or withdrawal (‑) |
$3,708 |
— |
‑$2,044 |
‑$1,664 |
— |
|
Cumulative balance |
3,708 |
$3,708 |
1,664 |
— |
— |
|
Operative Test |
1 |
1 |
3 |
2 |
1 |
|
aExcludes non‑tax revenues and transfers, which do not affect the calculation of the minimum guarantee. bThis decline is deemed to be zero for the purpose of calculating the guarantee. As set forth in the State Constitution, an attendance decline does not reduce cAs set forth in the State Constitution, reflects change in per capita General Fund plus 0.5 percent. dOutstanding maintenance factor is adjusted annually for changes in average daily attendance and per capita personal income. |
|||||
Maintenance Factor Obligation Grows Under Our Outlook Assumptions. Under our outlook assumptions, Test 3 would be operative in 2026‑27 and the state would add $2 billion to its maintenance factor obligation. The state would not create or pay any maintenance factor in subsequent years, but the existing obligation would grow each year. By the end of the period, the total outstanding amount would be $6.5 billion. The main reason the state does not pay any maintenance factor is our relatively high assumption about growth in per capita personal income after 2025‑26 (averaging 5.5 percent annually). The Constitution requires maintenance factor payments when per capita General Fund revenues are outpacing per capita personal income, but General Fund revenue grows at a slower rate under our outlook.
If Revenues Grow More Quickly After 2025‑26, Maintenance Factor Payments Could Direct Large Portion to Schools and Community Colleges. If revenues were to grow more quickly than our outlook assumes after 2025‑26, the state likely would be required to begin making maintenance factor payments. Whereas the three main Proposition 98 tests direct an average of about 40 percent of new revenue toward the minimum guarantee, maintenance factor payments tend to increase this percentage—in some cases significantly. Under this faster revenue scenario, schools and community colleges would benefit fiscally from receiving a large percentage of any revenue increases beyond the levels in our forecast. This requirement would leave a smaller share of revenues available to benefit the rest of the state budget—which is facing notable deficits after 2025‑26.
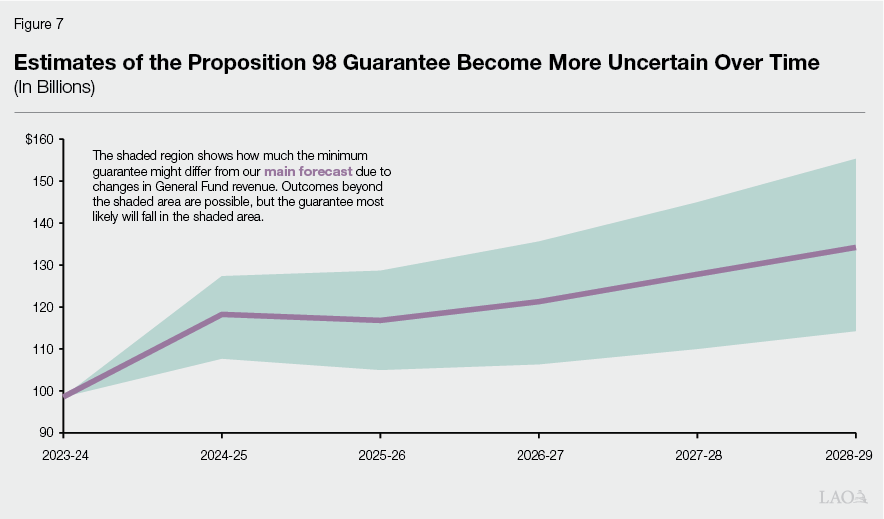
Estimates of the Guarantee Become More Uncertain Over Time. Our forecast builds upon the revenue estimates we think are most likely, but actual revenues are likely to be more volatile. For example, our forecast assumes steady revenue acceleration over the next several years, but revenues are likely to fluctuate even if they follow the general trajectory of our outlook. Figure 7 shows how far the minimum guarantee could differ from our forecast based upon swings in General Fund revenue. For this analysis, we examined the historical relationship between previous revenue estimates and actual tax collections, and then calculated the minimum guarantee under the different scenarios. The uncertainty in our estimates increases significantly over the outlook period. The reasonable range for the guarantee in 2028‑29, for example, is almost twice as large as the range in 2025‑26.
Proposition 98 Reserve
Withdrawals Would Be Required After 2025‑26… Under our outlook, the state would not be required to make Proposition 98 Reserve deposits or withdrawals in 2025‑26. In 2026‑27, however, the state would be required to withdraw most of the balance. The main reason for this withdrawal is that Test 3 is operative, with the guarantee growing slowly relative to per capita personal income (the main inflation factor in the reserve calculation). This withdrawal also would reduce the balance below the threshold triggering the local reserve cap, meaning the cap would become inoperative the following year. The state would withdraw the remaining balance in 2027‑28.
…But Withdrawals and Deposits Are Especially Sensitive to Forecast Assumptions. Reserve deposits and withdrawals could swing dramatically based upon deviations from our forecast assumptions. This instability is partly by design—one purpose of the reserve is to address some of the volatility in the guarantee that is essentially impossible to anticipate in a multiyear forecast. Even small changes in certain inputs can have notable effects. For example, if per capita personal income were to grow at rate that is 1.5 percent slower than the levels assumed in our outlook for the next several years, the state would withdraw only a few hundred million dollars from the reserve. Conversely, faster growth in per capita personal income could require the state to draw down the entire balance in a single year.
Program Costs
Moderate COLA Projected in 2025‑26. We estimate the statutory COLA for 2025‑26 is 2.46 percent. Our COLA estimate reflects preliminary federal data for six of the eight quarters that affect the calculation and our projections for the two remaining quarters. These projections account for the lower rate of inflation observed since the beginning of the year. The federal government will publish data for the final two quarters at the end of January and the end of April, respectively. At 2.46 percent, our estimate of the COLA rate is slightly below the historical average of about 3 percent over the past 20 years. Covering this COLA for existing school and community college programs would cost $2.4 billion.
Higher COLA Rates Assumed After 2025‑26. Under our forecast, the COLA would be somewhat higher after 2025‑26. Specifically, our estimate of the statutory rate is 3.1 percent in 2026‑27, 3.8 percent in 2027‑28, and 4 percent in 2028‑29. The cost of covering the COLA in each of these years would be $3.2 billion, $4 billion, and $4.3 billion, respectively.
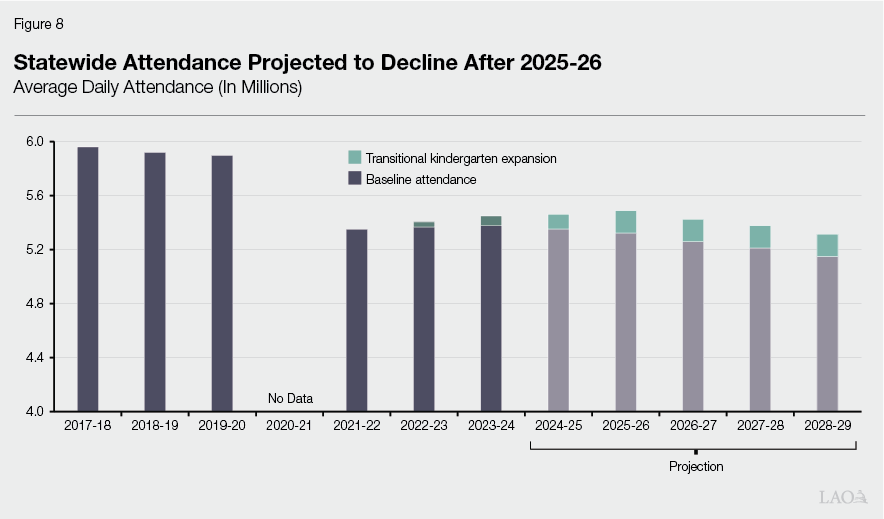
School Attendance Anticipated to Increase Temporarily, Then Decline. Between 2019‑20 and 2021‑22, the number of K‑12 students attending school on a daily basis decreased by nearly 550,000 (9.3 percent) (Figure 8). The primary cause of this decline was a surge in absenteeism. Elevated migration out of the state and a long‑term decline in births also contributed by reducing the size of the school‑age population. Between 2021‑22 and 2023‑24, statewide attendance increased by approximately 100,000 students (corresponding to growth of about 1 percent per year in 2022‑23 and 2023‑24). This increase is mainly explained by a moderate reduction in absenteeism and additional attendance generated by four‑year‑old children who recently became eligible for transitional kindergarten. Our outlook assumes further attendance increases of about 12,000 (0.2 percent) in 2024‑25 and 26,000 (0.5 percent) in 2025‑26 as the state finishes the expansion of transitional kindergarten. After 2025‑26, however, we assume attendance declines by roughly 60,000 students (1 percent) each year for the following three years. The largest factor behind this assumption is a reduction in the size of the school age population due to lower births.
LCFF Costs Are Decreasing as Pre‑Pandemic Attendance Levels Phase Out. Following the start of the COVID‑19 pandemic, the state adopted several policies to insulate school districts from the fiscal effects of declining attendance. For 2020‑21 and 2021‑22, the state used certain pre‑pandemic data to determine the attendance credited to each district. In 2022‑23, it implemented a new policy of funding districts based on their attendance in the current year, previous year, or average of the three previous years (whichever is highest). Prior to this policy, the state had funded districts according to their attendance in the current or previous year only. Over the past two years, districts have been experiencing the fiscal effects of declining attendance as their higher, pre‑pandemic attendance levels phase out of the three‑year average calculation. For 2024‑25, the June budget assumed LCFF‑related savings of about $1.2 billion as the phaseout continues. Our outlook assumes a similar amount of LCFF savings in 2024‑25 and a further $200 million in savings in 2025‑26.
Significant Amount of One‑Time Costs Expire in 2025‑26. The June 2024 budget used $5.2 billion in ongoing Proposition 98 funds—funds attributable to 2024‑25—to pay for one‑time costs (Figure 9). Most notably, the budget used ongoing funds to (1) cover some payments the state shifted from the previous year and (2) make a discretionary deposit into the Proposition 98 Reserve. Entering 2025‑26, these costs expire and the underlying funds become available for other school and community college purposes. On the other hand, the budget also relied upon nearly $1.1 billion in one‑time savings to pay for ongoing programs. The largest example involved a temporary reduction to the California State Preschool Program. Entering 2025‑26, these savings expire and the state must replace them with ongoing funds. Accounting for both the expiring costs and the expiring savings, the net amount of freed‑up funding is $4.1 billion.
Figure 9
One‑Time Costs and Savings in
2024‑25 Enacted Budget
(In Millions)
|
One‑Time Costs |
|
|
K‑12 costs shifted from 2023‑24 |
$3,570 |
|
Discretionary reserve deposit |
1,054 |
|
CCC costs shifted from 2023‑24 |
446 |
|
K‑12 one‑time activities |
66 |
|
CCC one‑time activities |
21 |
|
Subtotal |
($5,157) |
|
One‑Time Savings |
|
|
State Preschool unallocated funds |
‑$302 |
|
K‑12 one‑time funds supporting LCFF |
‑257 |
|
CCC payment deferral |
‑244 |
|
K‑12 payment deferral |
‑244 |
|
CCC one‑time funds supporting SCFF |
‑22 |
|
Other K‑12 actions |
‑6 |
|
Subtotal |
(‑$1,075) |
|
Net Costs/Savings (+/‑) |
$4,083 |
|
CCC = California Community Colleges; LCFF = Local Control Funding Formula; |
|
Key Considerations
In this part of the report, we (1) compare the funding available under the minimum guarantee with the cost of existing school and community college programs and (2) identify a few issues for the Legislature to consider in its upcoming budget deliberations.
The Budget Picture in 2025‑26 and Beyond
State Would Have $2.8 Billion Available for New Commitments in 2025‑26. Figure 10 shows our estimate of the changes in funding and costs relative to the 2024‑25 enacted budget level. Specifically, we account for (1) baseline adjustments, including the expiration of $4.1 billion in one‑time costs and about $400 million in formula‑driven cost increases; (2) the cost of providing a 2.46 percent statutory COLA for the school and community college programs that typically receive a COLA; and (3) growth in the Proposition 98 guarantee. After making these adjustments, we estimate the state would have $2.8 billion available in ongoing funds in 2025‑26. The Legislature could allocate these funds for any combination of one‑time or ongoing activities that support schools and community colleges.
Funding Available for New Commitments Grows Under Main Forecast. Figure 11 shows how the amount of funding available for new commitments could change over the rest of the outlook period. Specifically, it shows the difference between the Proposition 98 guarantee and the costs for existing school and community college programs (adjusted for the statutory COLA and changes in attendance). Conceptually, the amounts in the figure are analogous to the surplus and deficit amounts we calculate for the state budget overall and display in Figure 5 of The 2025‑26 Budget: California’s Fiscal Outlook. Under our main forecast, the guarantee grows more quickly than costs for existing programs and the state can afford to expand programs or make other new commitments.
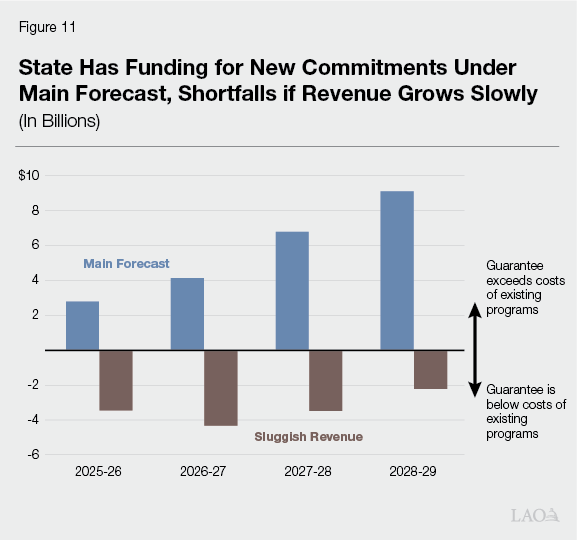
Under Weaker Scenario, State Would Face Shortfalls and Difficulty Maintaining Programs. Whereas our main forecast indicates the state would be able to expand programs, the picture could change quickly in a weaker economy. As the figure shows, the funding available under Proposition 98 would be unable to support the cost of existing programs if state revenue were growing sluggishly. This weaker scenario corresponds to the 25th percentile when measured against the potential revenue outcomes that could occur over the outlook period. Specifically, it assumes General Fund revenue grows 4.5 percent in 2024‑25; declines 3 percent in 2025‑26; then grows about 3 percent annually in 2026‑27, 2027‑28, and 2028‑29. (By contrast, our main forecast assumes General Fund revenue grows 8.5 percent in 2024‑25, 1.2 percent in 2025‑26, 3.6 percent in 2026‑27, and 5.5 percent in 2027‑28 and 2028‑29.) The shortfalls in the sluggish scenario are in the range of $2 billion to $4 billion each year. The difference between the two scenarios indicates that despite the favorable picture under our main forecast, school and community college programs are not immune to the effects of downturns that the state could face in the future.
Planning for the Upcoming Year
Recent Experience Illustrates the Value of Building Budget Resiliency. Following a surge in the Proposition 98 guarantee in 2021‑22, the state faced two consecutive budgets in which the guarantee declined from its previous peak. Despite drops of a few billion dollars each year, the state managed to avoid reductions to ongoing school and community college programs. One major factor was the state’s ability to draw upon $9.5 billion that it had previously deposited into the Proposition 98 Reserve. Another major factor was the Legislature’s decision in June 2022 to set aside $3.5 billion in ongoing funds for one‑time expenditures. This approach to the budget created a cushion—when the guarantee dropped the following year, the expiration of this one‑time spending allowed the state to accommodate the lower guarantee without reducing ongoing programs. Given the risks and uncertainties the state faces in the coming years, the Legislature could consider using a significant portion of the $2.8 billion in available funding to build budget resiliency.
Eliminating Deferrals Would Have Multiple Benefits. As a starting point for building resiliency, the Legislature could use $487 million of the available Proposition 98 funding to eliminate the payment deferrals it created in the June 2024 budget. Eliminating the deferrals would restore the regular payment schedule and remove pressure on future Proposition 98 funding, giving the Legislature more options to address economic downturns or fund other priorities in subsequent years. Moreover, any ongoing funds used for this purpose would become available for other purposes in the following year.
One‑Time Spending Could Help Build a Budget Cushion. Assuming the state eliminates the deferrals, approximately $2.3 billion would remain available for other school and community college purposes. The Legislature could consider a variety of one‑time uses for these funds that would help build a budget cushion. Regarding schools, for example, the state previously reduced funding for the Learning Recovery Emergency Block Grant by $1.1 billion and grants for electric school buses by $1 billion. It also adopted language indicating intent to restore these funds. If these activities remain a priority, the upcoming year is an opportunity to make these restorations. Another approach could focus on newer priorities. For example, the Legislature could consider setting aside some of this funding to cover the cost of implementing legislation it adopts in the upcoming session.
Several Considerations for Ongoing Increases. If the Legislature decides to use some of the available funding for ongoing increases, it has various trade‑offs to consider. Ongoing augmentations could help schools and community colleges enhance local programs and address the cost pressures they face, but they also commit the state to a higher level of ongoing spending within Proposition 98. The Legislature also faces trade‑offs regarding the distribution of any ongoing increases. For example, allocating additional funds through the LCFF or SCFF could help districts make progress on state priorities while allowing districts flexibility regarding the specific uses of those funds. Regarding LCFF, the Legislature could provide across‑the‑board increases beyond COLA, or it could use funding increases to modify the formula. Allocating additional funds through categorical programs or restricted grants would provide more certainty about how districts will use their funds, but could make the school and community college funding system more fragmented if it involves creating new programs. If the Legislature does want to provide ongoing augmentations, the spring budget hearings provide an opportunity to study the costs and trade‑offs carefully and ensure the increases align with core legislative priorities.
