Ann Hollingshead

April 28, 2026
Understanding $100 Billion in Spending Growth:
Causes and Fiscal Implications
- Introduction
- Organization of General Fund Spending
- Local Assistance ($58 Billion)
- K‑14 Education ($37 Billion)
- State Operations ($9 Billion)
- Why Has Spending Grown $100 Billion Since 2019‑20?
- What Are Ways to Measure Spending Growth?
- What Do These Findings Mean for Addressing the Deficit?
- Conclusion
Executive Summary
State Faces Deficits. Both our office and the administration have estimated the state faces structural deficits ranging from $20 billion to $30 billion annually. While recent revenue gains—driven by a strong stock market and investor enthusiasm surrounding artificial intelligence—have buoyed the state’s near‑term budget picture, long‑term imbalance will likely persist without significant policy changes.
This Report Assesses Causes and Fiscal Implications of Spending Growth. Since 2019‑20, General Fund spending has grown just over $100 billion—from $146 billion in 2019‑20 to $248 billion under the Governor’s budget proposal for 2026‑27. This report assesses the causes and fiscal implications of this growth in order to inform decision‑making going forward.
Overall, Majority of Growth Attributed to Sustaining Services and a Handful of Programs. In this report, we find that about 70 percent of this spending growth went to sustaining services that already existed in 2019‑20 while 30 percent went to expanding or creating new services since that time. Programmatically, a substantial majority of the growth—across sustaining and expanding services—is attributable to higher spending on schools and community colleges ($37 billion), Medi‑Cal ($25 billion), Department of Developmental Services ($8 billion), In‑Home Supportive Services ($8 billion), child care ($4 billion), and universities ($3 billion, which is categorized as local assistance in this report).
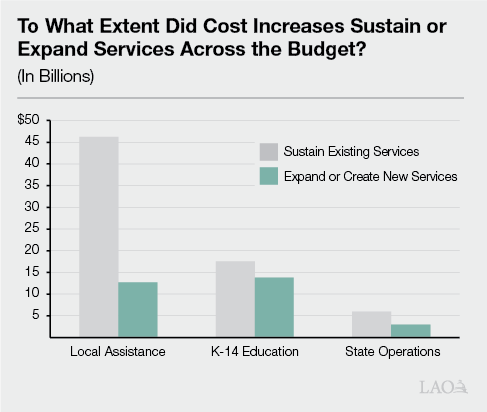
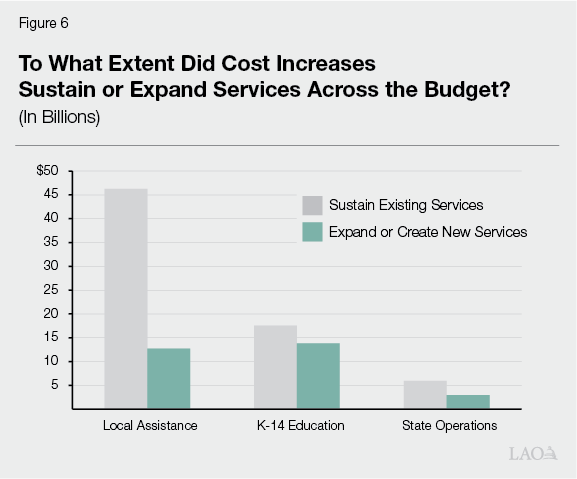
K‑14 Education Spending Saw More Service Expansions Than the Rest of the Budget. Outside of spending on K‑14 education, a substantial majority of cost growth has supported existing programs rather than creating new services. In contrast, K‑14 funding growth has been more evenly split. Specifically, we estimate that about half of K‑14 education spending growth sustained existing services, while the other half funded expansions and new programs. The figure below summarizes these differences.
Difficult Decisions Ahead. The persistence of the state’s deficits strongly suggests the balance of the state’s spending commitments and revenues is not sustainable. In retrospect, the state could not afford to sustain its existing services while funding the chosen suite of expansions and new programs under the same tax revenue structure. Further, as we describe in this report, due to the state’s constitutional limitations on how it can spend tax revenues, addressing these deficits will likely require at least some—if not significant—spending reductions. In short, in the years ahead, policymakers will have difficult decisions to make.
Introduction
General Fund spending has grown just over $100 billion since the COVID‑19 pandemic—from $146 billion in 2019‑20 to $248 billion under the Governor’s budget proposal for 2026‑27. This report aims to assess the drivers of that growth. Specifically, we examine the extent to which underlying cost pressures versus program expansions caused state spending to increase over this period. This analysis is particularly important given the current fiscal outlook. Both our office and the administration have estimated the state faces structural deficits ranging from $20 billion to $30 billion annually. While recent revenue gains—driven by a strong stock market and investor enthusiasm surrounding artificial intelligence—have buoyed the state’s near‑term budget picture, long‑term imbalance will likely persist without significant policy changes. Addressing these structural imbalances will require difficult decisions, including spending reductions that could be significant.
This report proceeds in three parts. First, we begin with a discussion of the underlying structure of the state budget and its design. We also describe how state General Fund spending is organized and the analytical approach for this analysis. Second, we present our analysis of cost growth for three types of state spending: (1) local assistance, (2) K‑14 education, and (3) state operations. Last, we discuss takeaways from our analysis and their implications for solving the structural deficit.
Organization of General Fund Spending
Categories of General Fund Spending
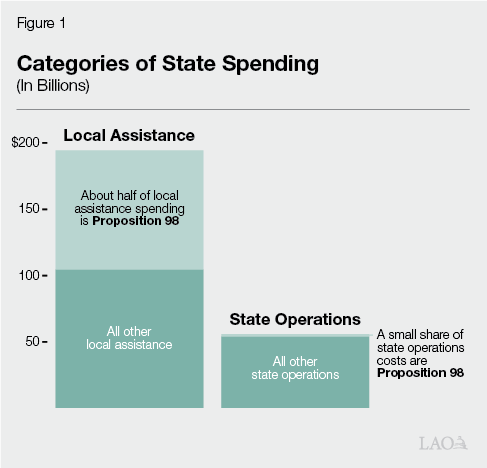
To assess the extent to which the budget’s growth reflects expanding or creating new services versus sustaining existing services we need to distinguish between different types of spending. We have organized this report into three main categories of General Fund spending: state operations, local assistance, and Proposition 98 (1988) (K‑14 education spending). These are summarized below and in Figure 1.
General Fund Budget Organized Into State Operations and Local Assistance. State budget documents produced by the administration broadly categorize nearly all General Fund spending into two main categories (with a small third category for capital outlay, which is not included in this analysis):
- State Operations. Includes expenditures for the administration and direct delivery of programs by state government employees. This category covers both operational functions that directly provide services to the public, such as fire suppression or emergency response, and administrative or oversight functions, such as tax administration and the treasury. It also includes personnel and operating costs for state departments and state‑run institutions, as well as state‑level payments like bond debt service.
- Local Assistance. Includes payments, grants, and other support provided to local governments and other entities that administer or support public programs. For example, this includes payments to healthcare providers, grants to local governments, and direct payments to individuals. For the purposes of this report, we also classify funding to the University of California (UC) and California State University (CSU) as “local assistance,” even though it is technically categorized as state operations. We treat them as local assistance because: (1) the state provides one main allocation to each system, which they manage independently—unlike typical state operations where the state exclusively provides targeted funding for specific purposes such as salaries or leases, and (2) the Governor and Legislature do not set compensation levels for UC and CSU employees (system governing boards make those decisions).
Proposition 98 Creates a “Budget Within a Budget.” Proposition 98 creates a “budget within the budget” by establishing a minimum level of funding that the state must provide each year to K‑12 schools and community colleges (K‑14 education). From the annual funding level determined by Proposition 98, the Legislature then determines how to allocate these resources among various K‑14 education programs. In practical terms, this means that a portion of the state’s overall budget is effectively earmarked for education, and those funds are generally not available for other programs. This funding is determined by formulas based on multiple inputs, including state General Fund revenues and local property tax revenue, so it can fluctuate annually. Although growth in the minimum funding level for K‑14 education has a direct relationship with General Fund revenues, the condition of the Proposition 98 budget can differ substantially from the condition of the rest of the budget. Most Proposition 98 spending is local assistance, provided to districts and colleges to manage independently. In short, Proposition 98 creates a constitutionally protected slice of the budget that functions separately from the rest of state spending, both in terms of how it is calculated and how it is allocated, and for this reason, this report treats this spending differently than the rest of the General Fund.
Drivers of Cost Increases
Our assessment also requires assigning funding changes to different types of budget actions. In this section, we describe the drivers of state costs over time: the underlying reasons for growth and the mechanisms through which that growth occurs. (This discussion applies to spending outside of Proposition 98, which is governed by constitutional formulas and operates differently.) The drivers of cost increases are also summarized in Figures 2 and 3.
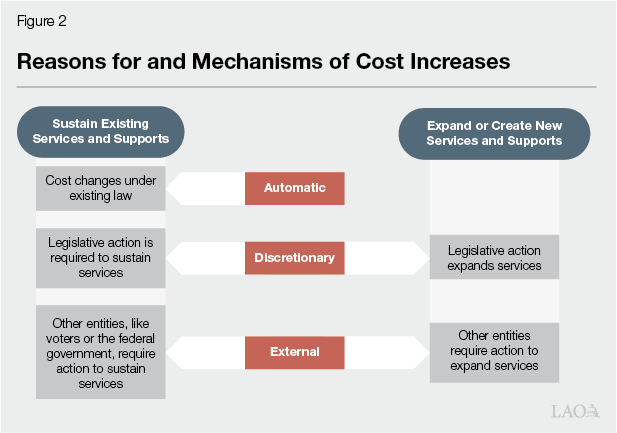
Figure 3
Examples of Reasons for and Mechanisms of Cost Increases
|
Sustaining Existing Services and Supports |
||
|
Mechanism |
Description |
Examples |
|
Automatic |
Cost changes occur under existing law, based on changing conditions, like changes in caseload, utilization, or price. |
|
|
Discretionary |
Legislative changes are required to sustain existing services in response to changes in prices or demand. |
|
|
External |
Cost changes to sustain services are required by other entities, such as voters or the federal government. |
|
|
Expanding or Creating New Services and Supports |
||
|
Mechanism |
Description |
Examples |
|
Discretionary |
Discretionary choices enacted by the Legislature to expand services or supports. |
|
|
External |
Service expansions are required by other entities, such voters or the federal government. |
|
|
IHSS = In‑Home Supportive Services; COLA = cost‑of‑living adjustment; and IT = information technology. |
||
Spending Increases Since 2019‑20. This analysis focuses on cost increases that have occurred since 2019‑20. We selected that year as a “pre‑pandemic” baseline—most of that fiscal year occurred before the pandemic and it predates most of the major federal and state spending changes that followed. However, in the nearby box, using 2019‑20 as the starting point means certain cost increases are categorized differently than would be the case had a different base year been chosen.
Effects of the Starting Fiscal Year
There Is No Perfect Starting Point. Starting our analysis in 2019‑20 allows us to assess the growth in the state budget prior to most of the significant budgetary effects of the COVID‑19 pandemic. That said, other baseline years would have been reasonable to select. By starting with 2019‑20, our analysis takes any policies already enacted before July 1, 2019 as given and any new policy enacted after this date as discretionary. As a result, any changes in cost due to eligibility, benefit levels, or services associated with these prior policy choices is categorized as automatic changes to sustain existing services. An example of this effect is state minimum wage. Chapter 4 of 2016 (SB 3, Leno) phased in gradual increases in the state minimum wage, reaching $15.50 per hour in 2023 (and adjusted for inflation thereafter). A rising minimum wage affects a number of state programs indirectly and some programs directly, like In‑Home Supportive Services provider wages. As a result of starting our analysis in 2019‑20, all increases in cost due to the minimum wage are considered automatic.
Reasons State Spending Grows. State spending can increase for different reasons, depending on the underlying goal of that increase. In particular, spending can either grow due to:
- Sustaining Existing Services and Supports. Leaving a program’s funding level unchanged year to year typically results in an erosion of its service. To sustain an existing service level, funding increases are necessary to respond to inflation, changes in the eligible population, and the intensity of program use. Sustaining services also can mean maintaining services in line with current standards of care, including incorporating advancements in technology. For example, in health care, improved diagnostic tools and treatments can increase costs and improve participants’ standard of care even when the underlying program has not changed.
- Expanding or Creating New Services and Supports. Increases can also occur as a result of policy decisions to expand or create new services or supports. New services and supports can include: expanding eligibility to populations not previously eligible, enhancing benefits, broadening the scope of services, or reducing the rate paid by program participants.
Uncertainty in This Analysis. Although conceptually distinct, sometimes differentiating between actions taken to sustain existing services versus expand them is difficult in practice. For instance, some funding changes—such as provider rate increases—do not directly increase services to beneficiaries but instead raise payments to support service delivery. When enacted episodically and in excess of inflation, however, they can result in greater utilization of services, functioning like program enhancements. In addition, some funding adjustments—like a particular base increase for UC or CSU—could be aimed at maintaining purchasing power, but, at other times, a base increase might exceed inflation, include enrollment growth expectations, or be linked with performance expectations. As a result, categorizing spending as “sustaining” or “expanding” requires judgment and introduces uncertainty into this analysis.
Mechanism of Spending Growth. From the perspective of the Legislature, costs can also increase through different mechanisms. Those are:
- Automatic. Some cost increases occur under existing law, based on changing conditions, like changes in caseload, utilization, or price. In these cases, the law provides a mechanism for the administration to align program costs with actual service demand—such as when more participants qualify for a program than expected or when participants use more services than projected. These changes do not require legislative action (but do involve administrative action).
- Discretionary. Other program cost changes require legislative action regardless of the underlying driver of those costs. For example, sometimes a change to law is required to respond to inflation or changes in demand. Under our definition of discretionary, legislative action is always required to expand or create new services or supports.
- Externally Required. In other cases, cost increases are mandated by outside entities, including the federal government, voters, or courts. For example, federal policy changes may shift costs to the state, or voter‑approved initiatives may require additional spending on specific programs.
Local Assistance ($58 Billion)
State local assistance costs (including UC and CSU but excluding K‑14 education) have grown by $58 billion since 2019‑20. This reflects what we would term “base” increases. That is, to avoid distortions from temporary fluctuations in either 2019‑20 or 2026‑27, we have adjusted growth in each program to reflect underlying (base) program changes, excluding one‑time funding and one‑time fund shifts from the end points. (That said, adjusting programs for one‑time shifts does not substantially change the picture: the unadjusted change between 2019‑20 and 2026‑27 is also approximately $58 billion.) These estimates also exclude one‑time and temporary spending authorized between these two points in time and therefore reflect only ongoing spending at the beginning and end of the period.
Growth by Driver of Costs
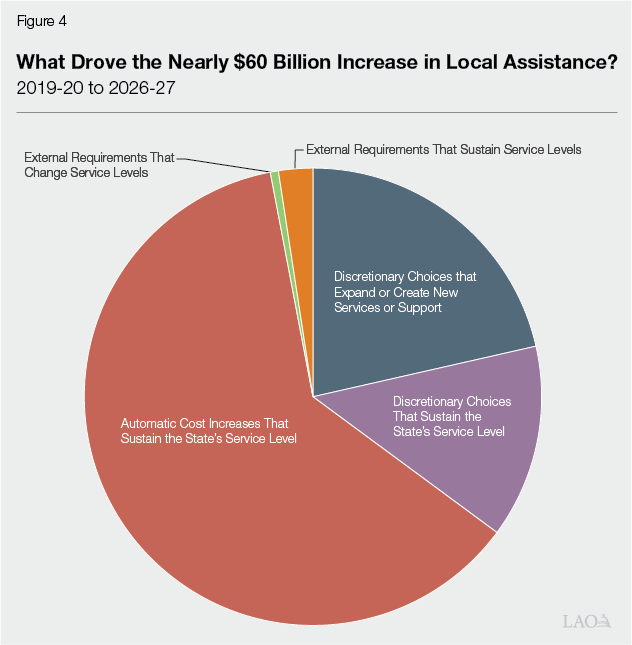
This section examines growth in local assistance by underlying reason—sustaining existing services versus expanding or creating new services—and by mechanism—automatic, discretionary, or external. Figure 4 shows that automatic growth to sustain the state’s service level accounts for most—nearly two‑thirds—of the total growth in local assistance spending. Discretionary decisions that sustain existing service levels account for 15 percent. Discretionary decisions that expand or create new services or supports account for about 20 percent of growth. External sources of growth—such as federal actions and voter‑approved measures—account for less than 5 percent.
Automatic Increases to Sustain Services
Most State Budget Growth Has Come From Automatic Changes to Sustain Existing Services and Supports. By our definition, cost increases that occur automatically under current law reflect the cost of sustaining existing service levels. (State law does not provide for automatic adjustments that expand programs beyond growth in inflation or underlying demand/eligibility.) We estimate that about two‑thirds of the nearly $60 billion increase in local assistance is attributable to these automatic changes. Some key examples of automatic increases that sustain the state’s service level include: (1) caseload and utilization in developmental services, which has grown notably over the last ten years, driven in part by the diagnosis of qualifying intellectual and developmental disabilities among California residents; (2) Medi‑Cal managed care capitation rates, which have increased in response to rising health care costs and utilization; (3) a statutory cost‑of‑living adjustment (COLA) for child care providers; and (4) In‑Home Supportive Services (IHSS) caseload, which has grown in part due to demographic changes. As described in the box above, by choosing 2019‑20 as our starting fiscal year, all policy choices up to that point to adjust program costs are included in this category. (In addition to this report, our office published a series of budget analysis reports and briefs which provide more detail on many of these program‑specific issues.)
Discretionary Choices to Sustain Services
In many cases, the Legislature must act to sustain service levels because those programs have limited mechanisms for automatic increases to account for underlying cost growth. In these cases, the Legislature is providing a discretionary increase, but it is targeted to maintaining the purchasing power of the existing service, for example through COLAs, rate adjustments, or increases to a grant. For the purposes of this report, we define sustaining the state’s service level as funding sufficient to cover inflation and demographic growth in the eligible population since 2019‑20. Costs above this level are defined as expanding services or supports.
Discretionary Choices to Sustain Services Accounted for $7 Billion in Cost Growth. Overall, we have found that about $7 billion in cost growth—or 15 percent of total local assistance—is attributable to discretionary choices to sustain the state’s service level. Key examples include the Legislature’s decisions to: (1) update the rate structure for developmental services using a commissioned rate study (we count the majority of these rate increases as sustaining services given that they were largely in line with inflation since 2019‑20), (2) increase reimbursement rates for child care providers, (3) increase average spending on supportive services in California Work Opportunity and Responsibility to Kids (CalWORKs) roughly in line with inflation, (4) increase Cal Grant awards at UC and CSU to align with higher tuition charges, and (5) provide unrestricted base increases for UC and CSU that cover inflation (portions exceeding inflation are treated as service expansions).
Many Choices to Sustain Costs Were Responding to Long‑Term Cost Pressures… Several legislative actions to sustain services since 2019‑20 addressed not only current cost pressures but also long‑standing ones. For instance, some programs had not received cost adjustments for many years prior to 2019‑20 or had been reduced in response to budget deficits in the Great Recession. For example, prior to the 2021‑22 rate update, developmental services rates had not been increased since at least the early 2000s. Similarly, the State Supplementary Payment grants had not been increased for many years despite rising cost of living and the Legislature enacted grant increases to catch up with those cost pressures.
…At a Time of High Inflation. After decades of relatively low inflation, prices for many goods and services began rising rapidly in 2021, reflecting supply chain disruptions and strong demand. Inflation peaked in mid‑2022 and began to moderate in 2023 as supply conditions improved and the Federal Reserve increased interest rates. Consistent with these broader trends, key state‑cost‑relevant indicators experienced elevated growth. For example, annual growth in the California Construction Cost Index, published by the Department of General Services (DGS) and reflective of capital outlay costs, peaked at 13.4 percent in 2021 and remained above 9 percent in 2022 and 2023—well above its five‑year average of 3.1 percent. Similarly, the California Necessities Index, which tracks price changes for basic goods such as food and clothing and is relevant to human services programs, grew by 6.6 percent in 2021 compared to a five‑year average of 3.6 percent.
Discretionary Choices to Expand or Create New Services or Support
Since 2019‑20, the Legislature has enacted roughly $12 billion in discretionary choices that expand or create new services and supports. (This estimate accounts for budget reductions enacted in recent years and those proposed in the 2026‑27 Governor’s Budget.) These choices represent about 20 percent of local assistance growth over the period (meaning roughly 80 percent of increases have sustained existing services rather than created new ones). Major actions in this category include: (1) expansion of comprehensive Medi‑Cal coverage to undocumented immigrants; (2) expansion of child care slots; (3) a 10 percent increase in CalWORKs grants, provided on top of other grant increases funded from realignment funding (which roughly kept pace with inflation relative to 2019‑20 levels); and (4) expanded eligibility for Middle Class Scholarships (MCS) to include students who also receive Cal Grant awards.
External Requirements
A small share of total growth—about $2 billion, or less than 5 percent—is attributable to requirements from external entities such as the federal government, voters, and courts. For example, under HR 1, the federal government is providing $1.4 billion less in funding for health services to people with unsatisfactory immigration status. The Governor proposes mitigating roughly half of this cost by reducing coverage for certain populations that gained this status under HR 1, such as refugees and asylees.
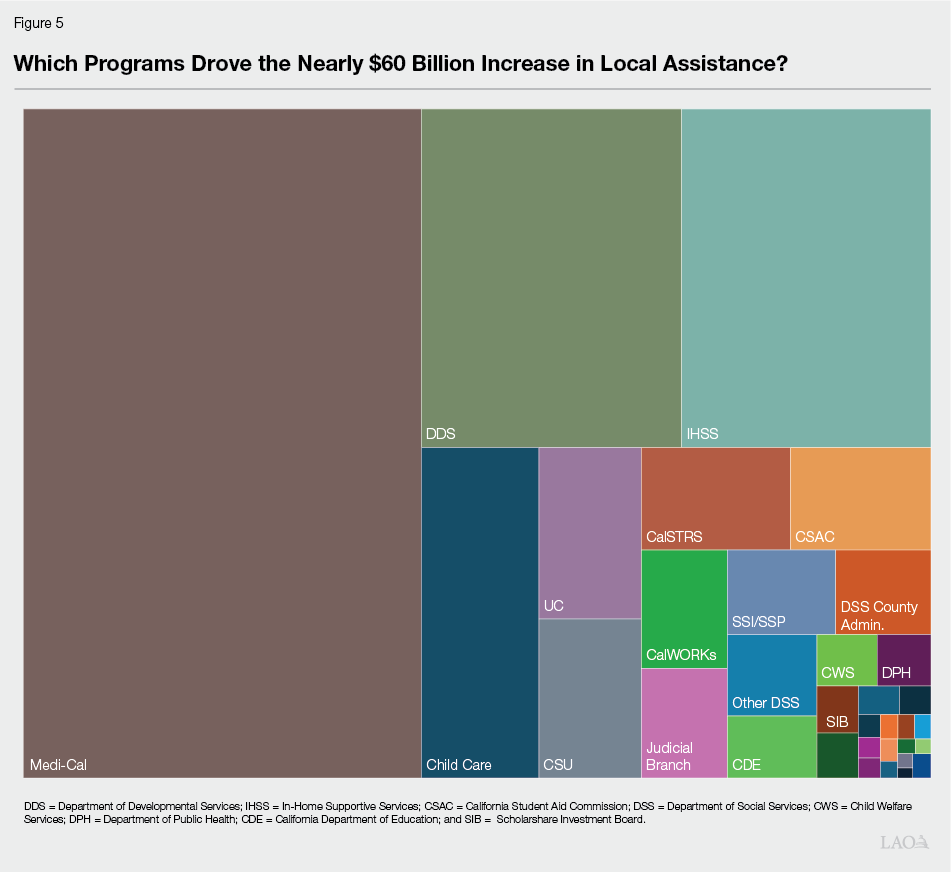
Growth by Major Program Area
Figure 5 shows total growth in local assistance (including UC and CSU, but excluding K‑14 education) by program area. As the figure shows, a handful of programs are responsible for the vast majority of the nearly $60 billion in growth. Specifically, these are: Medi‑Cal, the state’s Medicaid program; the Department of Developmental Services (DDS), which provides services to individuals with intellectual and developmental disabilities; IHSS, which provides supports to eligible aged, blind, and disabled individuals who cannot remain safely in their homes without assistance; child care; the universities, including UC and CSU; California State Teachers’ Retirement System; CalWORKs; and financial aid programs. The remainder of this section provides further detail on programmatic growth among these major programs.
Medi‑Cal Spending Largely Grew Due to Higher Costs Per Enrollee. Ongoing General Fund spending in Medi‑Cal grew by $25 billion over the period—around 40 percent of the growth in local assistance spending. This growth reflects adjustments to account for certain one‑time amounts, such as a temporary enhancement in federal matching funds in 2019‑20 that helped offset a portion of General Fund spending. We estimate around 75 percent of the growth is the result of automatic increases and most of the remainder from expansions adopted by the Legislature. As we noted in our publication The 2026‑27 Budget: Medi‑Cal Analysis, most of these increases are from growth in the cost per Medi‑Cal enrollee, rather than from enrolling more people in Medi‑Cal. For example, the cost per Medi‑Cal enrollee has grown as a result of higher provider rates and pharmacy costs. Overall, about two‑thirds of Medi‑Cal cost growth reflected sustaining services, versus one‑third for increasing services.
Developmental Services Costs Grew Mainly in Response to Caseload and Utilization Increases. Base costs in developmental services increased by about $8.4 billion over this period, largely due to changes that occurred automatically under existing law. Specifically, we estimate that roughly $5.6 billion of this increase resulted from DDS caseload growth—driven by the diagnosis of qualifying intellectual and developmental disabilities among California residents—and higher utilization. A smaller share, about $2.2 billion, reflected legislative actions to sustain DDS services. A key component of this category was the implementation of service provider rate reform beginning in 2021‑22, based on a commissioned study of service provider costs, which aimed to make rate setting more consistent statewide after several years of piecemeal rate reductions and restorations. The smallest share of the total increase, roughly $500 million, resulted from legislative actions that expanded services above existing levels. Overall, about 90 percent of cost growth in DDS reflected sustaining services, versus 10 percent for increasing services.
IHSS Costs Higher Due to Caseload and Growth in Cost of Care. After an adjustment to account for a temporary increase in federal matching funds that offset General Fund costs in 2019‑20, and an adjustment to exclude the Governor’s 2026‑27 IHSS budget proposals, base costs in IHSS grew by $8 billion from 2019‑20 to 2026‑27. The three primary drivers of this increase were: (1) caseload growth, accounting for roughly 50 percent of the total; (2) growth in the cost per hour of care—including minimum wage increases and locally negotiated wages and benefits above the minimum—accounting for roughly 40 percent; and (3) growth in hours per case, representing roughly 10 percent. State costs for county administration of IHSS have increased over this period, although counties do not receive a COLA from the state. Overall, nearly all cost growth in IHSS reflects sustaining services.
Child Care Costs Grew Because of Legislative Choices to Expand Slots and Reimbursement Rates. From 2019‑20 to 2026‑27, General Fund child care costs grew by $3.7 billion, primarily due to legislative choices to expand and sustain services. The largest components of this growth were slot expansions and increases in reimbursement rates. Additional growth resulted from statutory COLAs and increases in the CalWORKs child care caseload over this period. During the same years, non‑General Fund spending on child care increased by nearly $200 million, partially offsetting General Fund costs. Overall, about half of cost growth in child care reflects about half sustaining services and half increasing services.
UC Costs Grew Largely Due to Base Increases That Slightly Exceeded Inflation. Costs for UC grew by $1.7 billion from 2019‑20 to 2026‑27. Over this period, the state provided UC with unrestricted base General Fund increases in all but one year (2020‑21), along with targeted ongoing increases in some years. Taken together, these General Fund increases exceeded inflation over the period. Whereas about $1.1 billion (70 percent of the spending growth) reflects 2019‑20 costs adjusted for inflation, about $250 million (15 percent) reflects General Fund increases beyond inflation. Of the $250 million, the bulk is attributable to new or expanded targeted programs. The remainder of the spending growth is due to enrollment increases. UC’s resident undergraduate enrollment in 2026‑27 was approximately 22,000 students (11 percent) higher than in 2019‑20, with an associated cost increase of about $280 million. While we attribute some of this enrollment growth to underlying demographic trends (that is, sustaining access), we attribute most to growth beyond those demographic trends (that is, expanding access). Overall, about 70 percent of cost growth in UC reflects sustaining services, versus 30 percent for increasing services.
CSU Costs Also Grew Largely Due to Base Increases That Slightly Exceeded Inflation. Between 2019‑20 and 2026‑27, costs grew by $1.5 billion for CSU. As with UC, the state provided CSU with unrestricted base General Fund increases in all but one year (2020‑21) of the period, along with targeted ongoing increases in some years. Taken together, these General Fund increases somewhat exceeded inflation over the period. Whereas about $1.3 billion (80 percent of the spending growth) reflects 2019‑20 costs adjusted for inflation, about $234 million (15 percent) reflects General Fund increases beyond inflation. Of the $234 million, the bulk is attributable to new or expanded targeted programs. The small remainder of spending growth is due to enrollment increases. CSU’s resident undergraduate enrollment in 2026‑27 was approximately 5,200 students (1.5 percent) higher than in 2019‑20, with an associated cost increase of $52 million. Given underlying demographic trends declined over this period, we attribute all enrollment growth to expanding access rather than sustaining access. Overall, about 80 percent of cost growth in CSU reflects sustaining services, versus 20 percent increasing services.
CSAC Costs Primarily Grew Due to Eligibility Expansions and Award Amounts. Between 2019‑20 and 2026‑27, California Student Aid Commission (CSAC) base costs grew by $1.4 billion. About half of this growth reflects legislative actions to expand eligibility. Specifically, the Legislature expanded eligibility for the MCS program and created the California Community College Expanded Entitlement program to broaden Cal Grant access. Beyond expanded eligibility, about 25 percent of CSAC spending growth is attributable to increases in certain Cal Grant awards in response to tuition increases at UC and CSU. The remaining growth in CSAC spending results from underlying caseload increases, largely linked to higher education enrollment trends.
CalWORKs Cost Growth Driven Largely by Higher Spending Per Person. After an adjustment to account for a net zero funding shift involving the Cal Grant program, base General Fund spending in CalWORKs grew $969 million from 2019‑20 to 2026‑27. The major drivers of this growth include: (1) a 10 percent grant increase, which was provided on top of a cumulative 21.5 percent grant increase covered by realignment funds under a statutory mechanism (that primarily restored prior, recession‑era reductions); (2) growth in the average cost per person on employment services, which is roughly consistent with inflation; and (3) cost shifts due to realignment adjustments and the availability of federal Temporary Assistance for Needy Families funds.
K‑14 Education ($37 Billion)
Long‑Term Growth in K‑14 Costs Driven by Constitutional Formula Requirements, Rather Than Legislative Choices. Proposition 98 establishes a minimum funding level each year for schools and community colleges, commonly known as the minimum guarantee. The state calculates the guarantee using a set of formulas that take into account certain inputs, such as state General Fund revenue, local property tax revenue, and K‑12 student attendance. The state meets the Proposition 98 funding requirement through a combination of state General Fund and local property tax revenue. Though the Legislature can fund above or below the minimum guarantee, it typically funds at the calculated level. As a result, the overall K‑14 funding level is typically determined by the operation of these formulas, rather than legislative decisions about specific K‑14 program costs.
Increases in K‑14 Education Are Externally Driven. In other sections, we attribute spending growth to “automatic” changes that occur under law and “external” changes required by other entities, versus “discretionary” choices by the Legislature. In contrast, for K‑14 education, virtually all funding growth from 2019‑20 through 2026‑27 is mechanically driven by the Proposition 98 formulas themselves—essentially meaning the entire total increase is “externally driven” in the language of the rest of this report.
Legislative Decisions Allocate Funding Between Sustaining and Expanding Services. Although Proposition 98 determines the overall level of funding to schools and community colleges, the Legislature retains discretion over how available Proposition 98 funds are allocated. This means that, within the guaranteed funding level, the Legislature decides whether to use additional resources to sustain services or expand them.
Majority of Growth in Proposition 98 Spending Is Attributed to the General Fund. Between 2019‑20 and 2026‑27, total Proposition 98 spending—including both General Fund and local property tax revenue—grew $46 billion, while General Fund Proposition 98 spending grew $35 billion. General Fund and local property tax revenues are effectively fungible within the guarantee. To calculate how Proposition 98 General Fund growth was spent over the period, we first estimate how funding growth (excluding one‑time funding and fund shifts) was allocated between sustaining and expanding services. We then apply that growth proportionally to the General Fund component. This means that the increases described below do not tie to overall changes in Proposition 98 spending.
Adjusting for Growth in Base Amount, $31 Billion in General Fund Ongoing Cost Increases. Similar to our treatment of local assistance earlier in this report, we first adjust this growth for base increases. That is, to avoid distortions from temporary fluctuations in either 2019‑20 or 2026‑27, we exclude one‑time funding and one‑time fund shifts from the end points. After making these adjustments, we assume that base General Fund spending growth in Proposition 98 is $31 billion.
About Half of K‑14 Base Growth Supported Sustaining Existing Services. Across both K‑12 education and community colleges, we estimate that 56 percent of spending increases were used to sustain existing services, while 44 percent was used to expand services or create new services. Applying these percentages to the growth in base General Fund spending implies:
- $17.6 Billion for Sustaining Services. For school and community college districts, sustaining costs mainly includes providing COLAs and other base augmentations for existing programs. These adjustments help districts address rising costs, including salary and benefit costs. For schools, these adjustments also have helped offset the fiscal effects of declining attendance.
- $13.8 Billion for Expanding Services. In K‑12 education, expansions include initiatives such as a new after school program, the expansion of transitional kindergarten to all four‑year olds, and the arts education program approved by voters through Proposition 28 (2022). For community colleges, expansions include increases beyond inflation in general purpose funding, along with new and expanded categorical programs for purposes such as basic needs centers, student financial aid, and part‑time faculty health insurance.
State Operations ($9 Billion)
This section examines increases in state operations costs, which support state‑delivered services, including oversight and accountability functions. These activities include departments that administer and oversee state grant programs, collect taxes and fees, and perform statewide administrative functions, such as those carried out by the Controller and Treasurer. Within these departments, state operations costs primarily consist of employee compensation and operating expenses and equipment (OE&E), such as leases and consulting services. The state’s information technology (IT) costs cut across these categories, as they can be associated with both personnel and OE&E. (The box below provides additional detail on recent growth in IT costs.) The costs of debt service and repayments are also included in state operations. Overall, from 2019‑20 to 2026‑27, General Fund state operations costs grew by $9 billion.
Information Technology (IT) Costs Cut Across State Operations
State spending on IT (which includes spending on both operating IT systems as well as IT projects under development) does not fit neatly into a single cost category. IT expenditures span both employee compensation—including salaries and benefits of state IT workers—and operating expenses and equipment, which include, for example, software licenses, hardware, and cloud services. As a result, IT costs are embedded throughout the state operations figures discussed in this section. This box examines IT as a crosscutting lens on state operations cost growth.
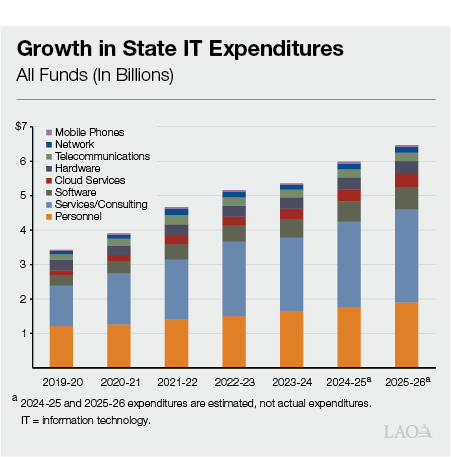
Spending on Overall IT by Category. As shown in the figure below, overall state IT expenditures have grown substantially since 2019‑20, driven primarily by increases in personnel and services and consulting costs. (We do not have this data for General Fund spending only, so the figure shows all funds.) Personnel costs grew steadily, reflecting both workforce expansion and rising compensation. Services and consulting costs grew sharply through the early part of the period before moderating, driven largely by a wave of major modernization projects. Software and cloud services—while smaller in absolute terms—grew faster than most other categories, consistent with a broader shift away from traditional on‑premises IT infrastructure.
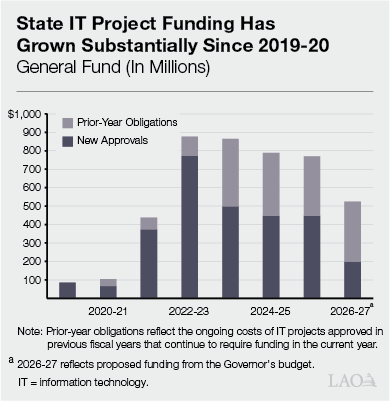
General Fund Spending on IT Projects. The figure below shows General Fund spending on new IT projects. These are discrete, often multiyear initiatives to replace legacy systems or build new service delivery platforms—and spending on them grew dramatically between 2019‑20 and 2022‑23. This growth likely reflects several concurrent factors: the availability of enhanced federal pandemic‑era funding, longstanding costs to address aging state systems, and increased demand for digital service delivery. While new project approvals have since moderated, prior‑year obligations from previously approved projects now account for a substantial share of annual IT project spending, reflecting the multiyear nature of large‑scale IT investments.
Employee Compensation Accounted for $6 Billion of the Growth. As described in the box below, we have extremely limited data on General Fund spending on employee compensation (there is reliable data, however, on total employee compensation across all funds). In fact, we cannot say with certainty how much General Fund the state spends on salaries or benefits, or how many full‑time equivalents (FTEs) are filled using General Fund resources. Further, our different imperfect data sources tell different stories. That said, using data from the Department of Finance (DOF) that is the basis for budget estimates, our analysis would indicate that growth in employee compensation costs were split roughly evenly between increases in salary costs and increases in benefits costs (like health care and pension contributions) for state employees. These increases reflect both the increases in compensation provided to existing employees, as well as the cost of adding additional positions (or workers). (Importantly, there is a distinction between the number of positions a department has authorized by the Legislature, and the number of positions actually filled. The difference between the two is that department’s vacancy rate.) Using limited data, we estimate that these factors contributed roughly equally to cost growth over the period. Specifically, about half of the increase in total employee compensation appears to be associated with growth in the number of filled positions (FTEs), while the other half reflects higher per‑employee costs due to increases in salaries and benefits for existing positions.
Serious Data Limitation on General Fund Employee Compensation
In conducting this analysis, we discovered that there is no reliable source of data on General Fund employee compensation spending, including reliable data on the General Fund cost of salaries, benefits, and—most acutely—the number of filled, General Fund‑supported positions. Nearly all workforce data reported by the California Department of Human Resources and the State Controller’s Office is on an “all funds” basis, rather than by fund source. Although the Department of Finance provided department‑level data on authorized General Fund full‑time equivalent employees, these data are not centrally audited or quality controlled, and we identified inconsistencies. As a result, the estimates presented in this section should be interpreted with caution.
Increase in FTEs Mainly Concentrated in Five Departments. While we do not have any comprehensive or reliable data on actual General Fund supported FTEs by department, DOF provided us with data on authorized positions by departments. Importantly, due to technical adjustments in position authority, these data do not give a reliable picture of growth in the number of employees receiving paychecks from the state. Nonetheless, the data suggest that authorized General Fund FTEs increased by about 18,000 between 2019‑20 and 2026‑27 (a 17 percent increase) and five departments are responsible for 10,000 of these positions—more than half the increase. After setting aside technical adjustments, the major reasons for the increases are:
- California Department of Forestry and Fire Protection (CalFire). New positions expanded CalFire’s capacity to fight fires, including additional fire crews, firefighter hand crews, and relief and support staff. The composition of positions also shifted over this period, moving from temporary (seasonal) roles to more permanent, higher‑cost positions.
- Department of State Hospitals (DSH). About three‑fourths of DSH’s new positions were added to support existing workload, following the department’s Mission‑Based Review to align staffing and resources and to increase capacity at the Metropolitan hospital. The remaining one‑fourth support new services, primarily staff for the Incompetent to Stand Trial Solutions program.
- Department of Justice (DOJ). Over half of the new positions at DOJ support new services, primarily resulting from new legislation, including increased oversight of peace officers and firearm regulations.
- Department of Social Services (DSS). One‑third of the new positions at DSS are related to sustaining existing services, and two‑thirds to providing new services.
- Franchise Tax Board (FTB). The majority of new positions at FTB are related to maintaining existing services, including to staff the Enterprise Data to Revenue project, a major IT modernization effort at the department.
Overall, these findings suggest that the recent FTE growth has been driven more by expanding and creating new services than by sustaining existing services.
Other Costs Net to a $3 Billion Increase. Debt payments drove the remaining increase in state operations costs. Specifically, debt payments increased $5 billion during this period, with retirement‑related debt payments increasing $3 billion (driven by the requirements of Proposition 2 [2014]) and other debt payments increasing by $2 billion. These other debt payments include debt service on general obligation bonds (largely issued before 2019‑20) and interest on the state’s Unemployment Insurance (UI) loan from the federal government. This $5 billion increase in debt payments was offset by a net reduction of $2 billion across all other areas of state operations. (This reduction reflects the net of a $3 billion reduction across three departments—California Department of Resources Recycling and Recovery, Office of Emergency Services, and DGS—and an increase of $1 billion across all other departments.)
How Much of State Operations Growth Was the Result of New Services?
The majority of the $9 billion growth in state operations—perhaps around $6.5 billion—reflects costs to sustain existing services rather than to expand or create new services. In particular:
- Employee Compensation. Changes in per‑person salaries and benefit costs represent a mix of automatic and discretionary increases to sustain service levels. Salary growth is primarily driven by General Salary Increases and other salary adjustments, which are discretionary decisions made by the Legislature and administration through the collective bargaining process. However, these are generally set in line with inflation to maintain purchasing power. Cost increases associated with employee benefits—such as retirement contributions or health premiums—occur automatically under existing law and labor agreements. By contrast, increases in FTEs, as described above, reflect a combination of sustaining existing services and creating new service levels, with most of the growth likely attributable to new service levels.
- Debt. Nearly all debt repayments are related to sustaining existing services. While UI debt represents new debt incurred since 2019‑20, it does not expand services relative to the level that existed prior to this period. Only the increases in GO bond debt service for newly authorized bonds—about $400 million—of the $5 billion increase can be attributed to expanded services.
- Other. Nearly all growth in this category is associated with sustaining existing service levels.
Why Has Spending Grown $100 Billion Since 2019‑20?
Overall, Majority of Growth Attributed to Sustaining Services. Since 2019‑20, total General Fund spending has grown by $102 billion. Across the three categories of spending—local assistance, state operations, and K‑14 education—about 70 percent of cost increases went to sustaining services and 30 percent went to expanding them.
Nearly All Growth Attributable to a Handful of Areas. Programmatically, a substantial majority of this total growth—across sustaining and expanding services—is attributable to higher spending on K‑14 education ($37 billion), Medi‑Cal ($25 billion), DDS ($8 billion), IHSS ($8 billion), child care ($4 billion), and universities ($3 billion).
K‑14 Education Spending Saw More Service Expansions Than the Rest of the Budget. Outside of spending on K‑14 education, a substantial majority of cost growth has supported sustaining existing programs rather than expanding or creating new services. In contrast, K‑14 funding growth has been more evenly split. Specifically, we estimate that about half of Proposition 98 growth sustained existing services, while the other half funded expansions and new programs. Figure 6 summarizes these differences.
Expansions and New Services Are a Meaningful Share of Spending Growth. Within local assistance, discretionary choices to expand services—such as Medi‑Cal coverage for certain immigrants, child care slot expansions, or MCS eligibility—account for roughly 20 percent of overall growth. Although relatively small proportionally, in dollar terms—about $12 billion—these expansions are not insubstantial. In addition, expansions of services within K‑14 education total about $14 billion General Fund.
What Are Ways to Measure Spending Growth?
Each year, the Legislature and the Governor must develop and adopt a balanced budget. As such, the state’s spending capacity is almost entirely driven by the revenues its tax structure generates. In recent years, that revenue growth has been significant, growing 60 percent cumulatively since 2019‑20. This is less than the overall growth in General Fund spending, however, which is 70 percent over this period. (The difference is essentially the reason the state has an operating deficit.)
In addition, significant parts of the state’s spending are driven by constitutional formulas largely outside of the state’s direct control. Most notably, Proposition 98 requires the state use a set of formulas to determine how much state General Fund should be spent on schools and community colleges. Typically, these formulas require the state to set aside 40 cents of every additional dollar in revenue collected. Although a smaller contributor, Proposition 2 also uses formulas to determine how much must be set aside for reserves and debt payments. Together, these requirements effectively predetermine the use of about half of new revenues.
State Spending Growth Exceeded Growth in Inflation and Population. Total General Fund spending since 2019‑20 grew significantly more than inflation and population, as seen in Figure 7. Growth in inflation and population, however, do not necessarily capture the cost to maintain the state’s current suite of state service commitments for a few reasons:
- Constitutional Spending Requirements. Propositions 98 and 2, both constitutional amendments adopted by the voters, govern the use of about half of state General Fund revenue. As such, to the extent revenues grow faster than inflation and population, so too will these requirements.
- Differences in the State’s Programmatic Cost Structure. The consumer price index (CPI) measures price changes for a standard basket of consumer goods and services. The state’s expenditures, however, are concentrated in certain areas—such as health care, education, and human services—where cost growth can differ from CPI. For example, although medical cost inflation during this period was below CPI, prior to the pandemic, it typically was higher.
- Changes in the Composition of the Population. While the state’s overall population has remained relatively flat since 2019‑20, certain populations have grown more rapidly. For example, the share of Californians over 65 years old has grown over 20 percent during this time. When populations served by the state’s programs grow—even when total population may be flat—the state’s costs for providing its suite of services changes.
- Changes in Utilization. Program spending also is driven by the intensity of the services provided per recipient. In programs such as developmental services and Medi‑Cal, costs depend on treatments and services rather than broad demographic categories.
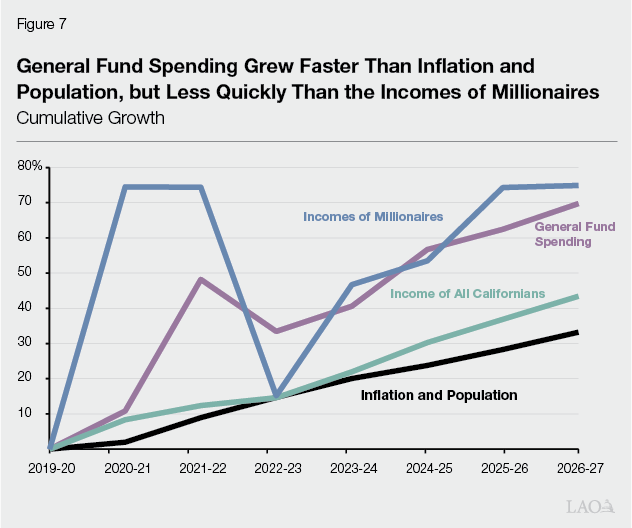
State Spending Growth Also Exceeded Growth in the Economy… Another way to measure the growth in spending is to compare it to the state economy. One measure of the state economy, personal income growth (of all Californians), also did not grow as fast as state spending as seen in Figure 7. Again, however, growth in the economy is not a perfect corollary for state cost pressures for several reasons. For example, eligibility for public services typically is greater when the economy is not growing quickly.
…But Not the Growth in Incomes of the State’s Highest Earners. As noted earlier, in large part, the state’s spending capacity is driven by its revenue structure. The state’s General Fund revenue structure relies on personal income taxes, the rates for which are progressive, increasing as individuals’ incomes increase. In fact, over 40 percent of personal income taxes are paid by those earning $1 million or more. This progressive design was intentional and reinforced by the voters through the passage of Propositions 30 (2012) and 55 (2016). As such, as the incomes of the highest earners in the state increase, so too does the state’s budget capacity. Currently, the state’s programmatic commitments also reflect this redistributive characteristic, with over 60 percent of spending (outside of K‑14 education) committed to programs that serve lower‑income Californians. Overall, compared to the growth of incomes of the highest‑income Californians, however, the budget generally has not grown quite as quickly, as seen in Figure 7.
What Do These Findings Mean for Addressing the Deficit?
In conducting this analysis, we aim to give the Legislature context on its spending commitments as it embarks on the difficult work of addressing the structural deficit. In this section, we provide some context for the decisions that could lie ahead based in part on this analysis.
Can the Legislature Raise Revenues to Eliminate Deficits?
Ultimately, the decision over whether to address the state’s budget deficits through revenue increases or spending reductions is a decision about how big state government should be. This is a question for elected policymakers, not our office. As a practical matter, however, the Legislature’s ability to raise revenue to eliminate the deficit is constrained by constitutional provisions adopted by voters—most notably Proposition 4 (1979), which created the state appropriations limit, or SAL.
Eliminating Deficits Could Require $30 Billion to $60 Billion in Additional Revenues. The state’s ongoing deficits are projected to be in the range of $20 billion to $30 billion annually. Due to the effects of Proposition 98 (and, to a lesser extent, Proposition 2), eliminating deficits through tax increases alone would require substantially more in new revenues than the deficit itself—potentially $30 billion to $60 billion per year. This is because each additional dollar of General Fund revenue triggers roughly $0.40 to $0.50 in required spending, primarily for K‑14 education.
State’s Capacity Under SAL Will Decline. The SAL limits the state’s ability to spend tax revenues on general purposes. Currently, the state has $34 billion in available room under the limit. (For a full explanation of the SAL, see our report, The State Appropriations Limit [2021]). This capacity is temporarily elevated due to a voter‑approved temporary adjustment to the limit under Proposition 35 (2024), which increased the limit by about $9 billion for a period of four years. Once this temporary increase expires, available room under the SAL will decline.
Constitutional Constraints Likely Preclude a Revenue‑Only Solution. Looking ahead, several factors—like growth in the economy and revenues—will affect the state’s capacity under the SAL. Even after accounting for these uncertainties, however, the magnitude of revenue increases required to eliminate the projected deficits very likely exceeds the state’s available room under the SAL. Accordingly, unless the Legislature asks voters to amend the State Constitution, addressing the state’s projected deficits likely will require at least some—if not significant—spending reductions.
What Is the Scope of What Is Required to Eliminate Forecasted Deficits?
In this section we provide some illustrative examples of what would be required to eliminate the structural deficits. These examples are not recommendations; they are intended to illustrate the magnitude and severity of the state’s fiscal challenge.
For Example, Eliminating Every Service Expansion Adopted Since 2019‑20 Only Closes Half the Gap. Even if the state eliminated every discretionary service expansion enacted since 2019‑20 outside of K‑14 education—including full‑scope Medi‑Cal coverage for undocumented individuals, child care slot expansions, university funding increases provided above inflation, enhanced fire‑fighting services, and increased oversight of peace officers—the resulting savings would total about $15 billion, roughly half of the projected structural deficit.
Closing Remaining Gap With Tax Increases Would Require Significant Action. Closing the remaining gap through revenue increases would require major tax actions. Our office recently published a report outlining various options the state has to raise or lower taxes (see Comparing Options to Raise and Lower Taxes). To start, voters would need to extend the higher personal income tax rates put in place by Propositions 30 (2012) and 55 (2016), which were enacted to address lingering structural deficits following the Great Recession. Because these tax increases are scheduled to expire under current law, extending them does not address any of the deficit (it only prevents the deficit from becoming even larger). As such, on top of that, the state would need to enact more tax increases. For example, this could include doing all of the following: (1) raising personal income tax rates by 6 percent (not percentage points) across the board, (2) increasing the corporate tax by 6 percentage points, and (3) raising the sales tax by one cent.
Conclusion
In Hindsight, Underlying Costs and Discretionary Choices Were Not Affordable. The persistence of the state’s deficits strongly suggests the balance of the state’s spending commitments and revenues is not sustainable. In retrospect, the state could not afford to sustain its existing services while funding the chosen suite of expansions and new programs under the same tax revenue structure.
Evaluating Trade‑Offs Will Be Challenging. In the midst of budget challenges, deciding which programs to reduce or sustain requires understanding the relative benefits of each of those programs. The distinction between sustaining services (largely automatic or legally required) and discretionary expansion provides an initial framework for evaluating trade‑offs in the budget. Ideally, policymakers would be provided clear, systematic information on whether higher spending has translated into improved outcomes or other measurable public benefits. For some programs, the state does have rich data on performance metrics, but for other programs data is much more limited. Even when good data are available, however, addressing this question is extremely difficult because it is difficult to draw causal conclusions about how much outcomes are changed by state spending. That challenge grows when looking across the state’s full range of programs and services. That said, this report offers a first step in making fiscally sound evidence‑based policy decisions.
Difficult Decisions Ahead. Despite imperfect information, policymakers will need to make difficult budgetary decisions in the years ahead. Near‑term revenue gains may temporarily mask structural imbalances, but in the coming years, the fiscal realities are likely to be undeniable. Addressing the budget gaps will require sustained and consequential action—through revenue increases, spending reductions, or likely both.