With a state as big, as populous, and as complex as California, it would be impossible to quickly summarize how its economy or state budget works. The purpose of Cal Facts is more modest. By providing various "snapshot" pieces of information, we hope to provide the reader with a broad overview of public finance and program trends in the state.
Cal Facts consists of a series of charts and tables which address questions frequently asked of our office. We hope the reader will find it to be a handy and helpful document.
Mac Taylor
Legislative Analyst
2013 Gross Domestic Product (In Trillions)
- California’s gross domestic product (GDP)—the value of goods and services produced here—totaled $2.2 trillion in 2013.
- With 34 percent of the population, the Los Angeles/Orange County region produces 36 percent of California’s economic output. With only 17 percent of the population, the Bay Area produces 25 percent of the state’s output.
- The GDP of Texas, the next–largest state economy, was $1.5 trillion.
(In Billions)
- Venture capital provides investment funding for new technology firms that may not have access to conventional bank loans. Historically, the level of this funding has affected job growth in California’s technology industries.
- In many recent years, venture capital funding to California firms often has equaled or exceeded that for firms in the other 49 states combined. Overwhelmingly, this funding goes to firms in the Bay Area.
2013 International Goods Exportsa (In Billions)
Top 10 Commodities by Billions in Sales, 2012
- California is the nation’s leading farm state. Its farm commodities generated $45 billion of sales in 2012—far surpassing the $32 billion generated by farms in Iowa (the second–ranked state). Milk is, by far, California’s top farm commodity.
- Across the U.S. and around the world, consumers often eat agricultural products that are almost exclusively California grown. For example, California accounts for about 99 percent of U.S. production of almonds and walnuts. Almonds are the state's leading agricultural export.
- In 2012, the top five counties by sales volume of farm commodities were Fresno, Kern, Tulare, Monterey, and Merced.
Percentage of Population Living Below Poverty Threshold From 2011 Through 2013
- The Official Poverty Measure (OPM) defines a family as poor if their pretax cash income is less than a poverty threshold that is standard across the continental U.S.
- In contrast, the Research Supplemental Poverty Measure (SPM) accounts for forms of public assistance not included in the OPM and adjusts poverty thresholds for a number of factors, such as the cost of housing.
- From 2011 through 2013, California’s OPM poverty rate was somewhat higher than in the rest of the U.S. California’s SPM poverty rate—at 23.4 percent—was much higher than in the rest of the U.S., primarily due to the state’s higher housing costs. This rate is equivalent to about 9 million Californians being considered poor.
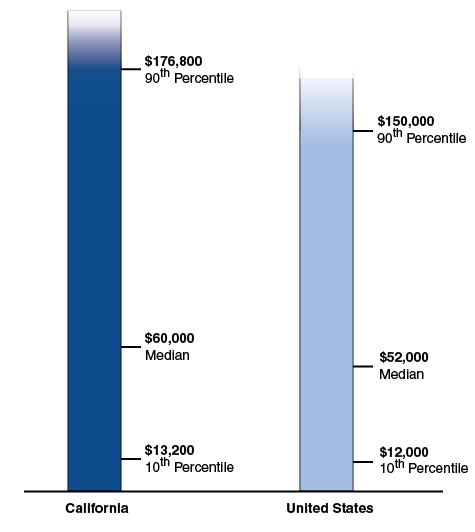
- In 2013, median household income in California was $60,000, compared to $52,000 for the nation as a whole. As shown above, the gap between high–income households (for example, the 90th percentile of households by income) and very low–income households (such as those at the 10th percentile) is greater in California than in the U.S. as a whole.
Estimated Median Home Price (In Thousands)
- In California, 2013 was the first year since 2006 in which home prices increased significantly.
- The median home price in California has continued to rise in recent months, reaching $431,400 by September 2014. This was roughly the same as it was ten years ago in 2004.
Share of Household Income Spent on Housing, 2013
Total Inflation–Adjusted Change Since 2002
Great Recession:
More Lost Jobs, Longer
Recovery Than Past Downturns
- California lost 1.3 million net jobs between July 2007 and early 2010. These job losses were much bigger than those of recent recessions. Also, the time it took California to recover the lost jobs—nearly seven years—was much longer.
- California’s population and labor force have grown since the Great Recession began. Therefore, even with the job recovery described above, the state’s unemployment rate as of August 2014 (7.4 percent) remained above pre–recession levels. In late 2006, before the recession, California’s unemployment rate fell as low as 4.8 percent.
Rapid Elderly Population Growth...
...And a New Hispanic Plurality
|
|
Percent of California Population
(LAO Estimates)
|
|
2010
|
2020
|
|
Hispanics
|
38%
|
39%
|
|
Whites
|
40
|
38
|
|
Asian–American
|
13
|
14
|
|
African–American
|
6
|
6
|
|
Other
|
3
|
4
|
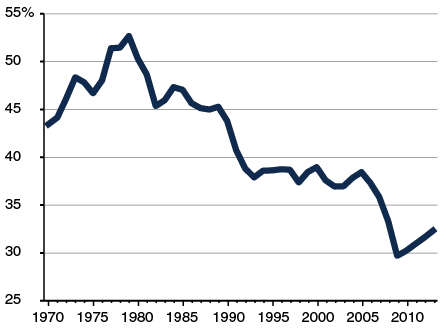
All General Fund Revenues
- Over the past several decades, the personal income tax (PIT) has replaced the sales tax as the predominant source of General Fund revenue.
- The increase in the PIT is due to growth in real incomes, the state’s progressive tax structure, and increased capital gains.
- The decline in the sales tax is largely due to an increase in spending on services, which generally are untaxed. Prices of taxable goods have increased little in recent decades. In addition, the portion of sales tax revenues that are deposited outside of the General Fund has increased.
Percent Change From Prior Year
- Personal income is a broad measure of economic activity in California. It measures wages and salaries and various other types of income, but it excludes capital gains (income resulting from sales of assets, such as stocks and homes).
- Personal income taxes are the largest state revenue source. As shown above, these taxes are much more volatile than statewide personal income. This is partly because California taxes capital gains, which are especially volatile and mainly go to high–income taxpayers who pay the highest tax rates. These taxpayers’ other income also tends to be volatile.
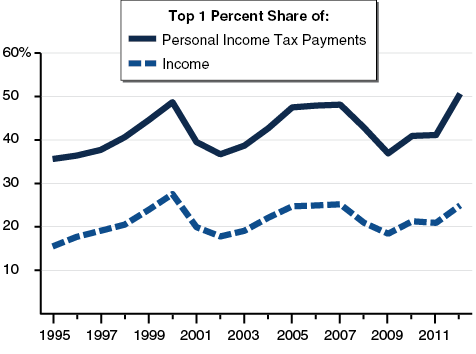
- The share of California’s personal income tax (PIT) paid from the 1 percent of PIT returns with the most income is highly volatile—driven by rises and falls in stock and other asset prices.
- In 2012, the top 1 percent of PIT return filers paid a higher share of these income taxes than in any other recent year—just over 50 percent. Proposition 30 took effect in 2012 and temporarily raises PIT rates for these filers.
- Overall, the PIT provides around two–thirds of state General Fund revenues. As such, income fluctuations among the top 1 percent can cause state revenues to rise or fall by billions of dollars each year.
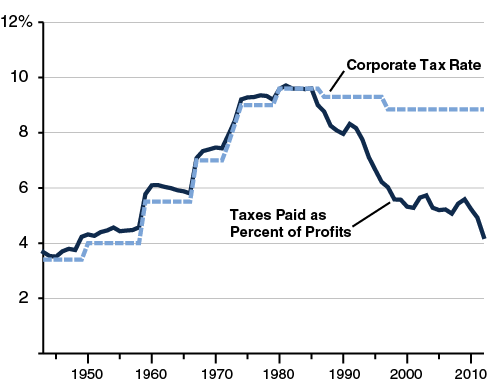
- Using various provisions of state tax law, such as tax credits, corporations may reduce their tax liability. This can result in the firms’ final tax liabilities—as a percent of their California profits—being less than the main 8.84 percent corporate tax rate in state law.
- The state has made various major changes in corporate tax law in recent decades. These include expansions of some tax credits and other changes. Such changes have contributed to a sharp decline in corporation tax liabilities as a percent of profits. In prior decades, these tax liabilities were closely linked with the state tax rate.
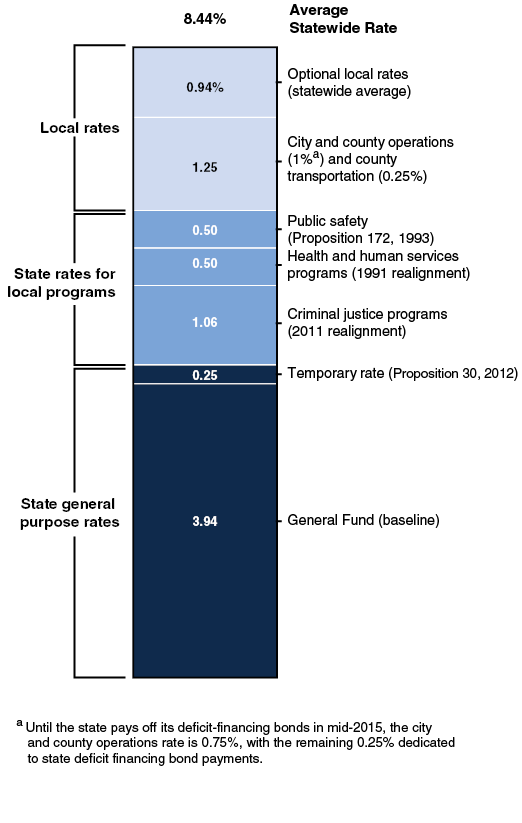
- Since 1970, the state’s sales tax base, “taxable sales,” has grown 6.3 percent per year, while personal income—the total income earned by businesses and individuals in California—has grown 7 percent per year. Californians are spending more of their income on housing, health care, and other services not subject to the sales tax.
- Total state and local sales tax revenue has grown 7.4 percent per year since 1970. Revenue growth has outpaced taxable sales growth because the average sales tax rate has increased from 5 percent to 8.4 percent.
|
Proposition (Year)
|
Key Provisions
|
|
13 (1978)
|
Limits property tax rates and assessment increases. Requires two–thirds vote of Legislature for state taxes and two–thirds voter approval for certain local taxes.
|
|
4 (1979)
|
Sets annual state and local spending caps. Requires state to reimburse local governments for some state mandates.
|
|
98 (1988)
|
Establishes minimum funding requirement for schools and community colleges.
|
|
172 (1993)
|
Imposes half–cent sales tax for local public safety programs.
|
|
218 (1996)
|
Limits local government authority to impose certain taxes, fees, and assessments.
|
|
39 (2000)
|
Lowers voter approval requirements to 55 percent for certain local school bonds.
|
|
1A (2004)
|
Restricts state from reducing local property tax, sales tax, and vehicle license fee revenues.
|
|
22 (2010)
|
Reduces state’s authority to use or redirect state fuel and local property taxes
|
|
25 (2010)
|
Lowers Legislature’s vote requirement for state budget to a simple majority.
|
|
26 (2010)
|
Broadens definition of taxes to include some additional fees and charges.
|
|
30 (2012)
|
Temporary state tax increases. Guarantees certain funding for 2011 local realignment.
|
|
2 (2014)
|
Sets new rules for state and school budget reserves and debt payments.
|
General Fund and Special Funds
As Percent of Personal Income
- State spending as a percent of personal income increased steadily from the late 1950s through the mid–1970s. Since the late 1970s, spending generally has ranged between 7 percent and 8 percent of personal income. (Personal income is one broad measure of the overall size of the California economy.)
- By a different measure—adjusted for inflation and population growth—spending generally grew steadily throughout the period displayed. By this measure, spending tripled over the second half of the 20th century, but is now about the same as it was in 2000.
2014–15 General Fund
- Funding for school districts, community colleges, and universities makes up $58 billion of the state’s $108 billion General Fund budget in 2014–15. Health and human services spending, including that for the Medi–Cal Program, totals $30 billion.
- $78 billion of the 2014–15 budget—72 percent of the total—was paid to local governments, such as school districts and counties. State personnel costs, excluding university employees, accounted for about 13 percent of the budget.
- In 2013–14, the state employed about 354,000 full–time staff at a salary cost of roughly $26 billion (all funds).
- The state long has had many positions that are authorized but not filled. The current vacancy rate across state departments is about 13 percent.
- Over the past 30 years, state employment has averaged 9.0 state employees per 1,000 population. In 2013–14, there were about 9.3 employees per 1,000 population. On this basis, California ranked 46th among the states in 2012.
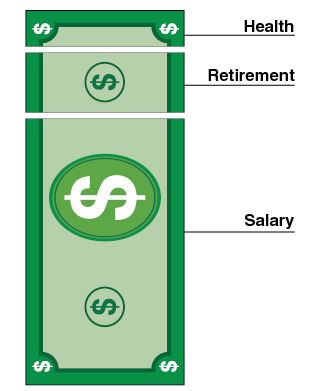
- Excluding university, legislative, and judicial employees, the state spent about $20 billion (all funds) in employee compensation costs in 2012–13. About 30 percent of these costs were for retirement benefits (including pensions, Medicare, and Social Security) and health benefits (including vision and dental).
- Over the last two decades, state costs for pensions have grown faster than state costs for salaries or health care. Over the next few decades, recent legislation that decreased pension benefits for new hires is likely to reduce state pension costs.
(In Billions)
- The state's $280 billion in key liabilities are summarized above. The state has budgeted funds or scheduled payments to address about $160 billion of these liabilities.
- Under a 2014 law, the state will pay for about $20 billion of the $74 billion unfunded liability of the state’s teacher pension system known as CalSTRS. School and community college districts and teachers will pay for the remaining $54 billion.
|
Measure
|
Governing Body
|
Voters
|
|
State
|
|
|
|
Tax
|
2/3
|
—
|
|
Fee
|
Majority
|
—
|
|
General obligation bond
|
2/3
|
Majority
|
|
Lease revenue bond
|
Majority
|
—
|
|
Initiative proposing revenue or debt
|
—
|
Majority
|
|
Constitutional amendment proposed by the Legislature
|
2/3
|
Majority
|
|
Local
|
|
|
|
Tax:
|
|
|
|
Funds used for general purposes
|
2/3a
|
Majority
|
|
Funds used for specific purposes
|
2/3a
|
2/3
|
|
Property assessment
|
Majority
|
Majorityb
|
|
Fee
|
Majorityc
|
—
|
|
General obligation bond:
|
|
|
|
K–14 districts
|
2/3
|
55 percent
|
|
Cities, counties, and special districts
|
2/3
|
2/3
|
|
Revenue bond
|
Majority
|
Majoritya
|
|
Other debt
|
Majority
|
—d
|
2012–13 (Dollars in Billions)
|
|
Counties
|
Cities
|
Special Districts
|
|
Total Revenues
|
$61.0
|
$68.3
|
$43.3
|
|
Sources of Revenues
|
|
|
|
|
Property taxes
|
19%
|
16%
|
11%
|
|
Sales and other taxes
|
3
|
19
|
1
|
|
User charges and enterprise revenues
|
22
|
40
|
55
|
|
Intergovernmental transfers
|
48
|
9
|
15
|
|
Other revenues
|
7
|
16
|
18
|
- Counties receive nearly half of their revenues from the state and federal government and must spend these funds for specific purposes, primarily health and social service programs.
- Cities and special districts receive a significant share of their funding from various user charges. Cities and special districts use these funds to pay for electric, water, and other municipal services.
- The property tax is the largest source of local tax revenue for all local governments. Other local taxes—such as sales, hotel, utility, and business taxes—make up about one–fifth of city revenues.
|
Selected
Years
|
Revenue
|
Tax Revenue Distribution
|
|
Schools
|
Counties
|
Cities
|
Other
|
|
1977–78
|
$10.3
|
53%
|
30%
|
10%
|
6%
|
|
1979–80
|
5.7
|
39
|
32
|
13
|
16
|
|
1993–94
|
19.1
|
51
|
21
|
11
|
18
|
|
2012–13
|
49.9
|
40
|
25
|
19
|
16
|
- The state contributes the largest share of funding for school operations (63 percent). A small share of state funding comes from the California Lottery.
- Local funding (26 percent) comes primarily from property taxes. A relatively small amount comes from various other sources, including parcel taxes and fees for certain district services (such as transportation).
- The federal government contributes funding for several specific purposes, such as supporting low–income students and educating students with disabilities (11 percent).
- More than $6 of every $10 is spent on instruction and instructional support—largely paying teacher salaries and benefits.
- Almost $2 of every $10 is spent on facilities, including land acquisition, construction, and maintenance.
- About $1 of every $10 is spent on pupil services, including school meals, pupil transportation, counseling, and health services.
- Less than $1 of every $10 is spent on central administration, including the compensation of superintendents as well as central business, legal, and human resource functions.
Funding Per Pupil, (In Thousands)a
- State revenues and school funding dropped in 2008–09. (Schools received federal stimulus funding and special fund monies to offset some of this reduction.)
- School funding increased quickly in 2012–13 as the state economy recovered from the recession and voters approved state income and sales tax increases.
- Proposition 98 funding in 2014–15 was $9,080 per–pupil—about $400 above the inflation–adjusted 1988–89 level.
Proposition 98 K–12 Funding by Program, 2014–15
- The 2014–15 budget provided $54 billion for schools from a combination of state General Fund and local property tax revenues. The state provides the vast majority of funding—$47 billion—through the Local Control Funding Formula (LCFF).
- The state created the LCFF in 2013–14, replacing dozens of previous formulas and programs. The LCFF has a base rate for each grade span, with higher grades generally funded at higher rates. On top of these base rates, the LCFF provides additional funding for certain students.
- Because the LCFF has target rates that are much higher than existing funding levels, the state intends to phase in the formula over the next several years. In 2014–15, the state was funding 80 percent of full–implementation costs. Closing the gap entirely in 2014–15 would have cost an additional $11 billion.
- More than 60 percent of K–12 students are low income, English learners, or foster youth (which are counted as low income).
- Under the Local Control Funding Formula (LCFF), these students generate supplemental funding equivalent to 20 percent of the base rate.
- If these students comprise more than 55 percent of a district’s enrollment, the district also receives concentration funding equal to 50 percent of the base rate for each student above the threshold.
- For more information on how the formula works, please see our report, An Overview of the Local Control Funding Formula (December 2013).
|
|
California
|
United States
|
|
Overall
|
|
|
|
Total Number
|
268,689
|
3,103,263
|
|
Student/Teacher Ratio
|
23.4
|
16.0
|
|
Gender
|
|
|
|
Female
|
73%
|
76%
|
|
Male
|
27
|
24
|
|
Experience
|
|
|
|
Less than 3 Years
|
9%
|
9%
|
|
3 to 9 Years
|
29
|
33
|
|
10 to 20 Years
|
42
|
36
|
|
More than 20 Years
|
19
|
21
|
|
Education
|
|
|
|
Less than Bachelor’s
|
5%
|
4%
|
|
Bachelor’s Degree
|
43
|
40
|
|
Master’s Degree
|
39
|
48
|
|
Education Specialist or Doctorate
|
13
|
9
|
|
Salary
|
|
|
|
Average Teacher Salaryb
|
$62,010
|
$46,340
|
|
Median Salary, All Bachelor’s Degree Holders (2012)c
|
53,033
|
49,157
|
|
Salary by Years of Experienceb
|
|
|
2 or Fewer Years
|
$47,310
|
$38,330
|
|
6 to 10 Years
|
58,570
|
44,040
|
|
More than 20 Years
|
73,980
|
56,620
|
K–12 Enrollment Trends
Vary Greatly Across State
Projected Change, 2013–14 Through 2022–23
Projected Change (In Thousands), 2013–14 to 2022–23
Share of Students by Disability, 2013–14
- Schools must develop individualized plans to meet the educational needs of students with disabilities. In addition to extra academic supports in a classroom setting, special education services can include language, occupational, and behavioral therapies.
- Spending for special education services totaled $10 billion in 2012–13, comprising 15 percent of K–12 expenditures in California. These costs were paid with a combination of local general purpose (50 percent), state (38 percent), and federal (12 percent) funds.
Second Language Students by Classification
- More than four in ten California students—almost 2.7 million students overall—speak a primary language other than English at home. The vast majority of these students (79 percent) speak Spanish.
- Overall, about half of these students are classified as English learners whereas half are considered Fluent English Proficient (FEP). Elementary students, however, are much more likely to be classified as English learners than secondary students.
- In California, reclassification from English learner to FEP is determined by school districts based on assessments of language and academic proficiency, teacher evaluation, and parental consultation.
- Almost one–third of all English learners in the nation live in California.
2012–13
- California’s low–income students perform significantly below non–low–income students in 3rd grade and 8th grade English language arts and math.
- Seventy–five percent of low–income students graduate within four years. (Some students who do not graduate within four years enroll in a fifth year and graduate later.)
- Low–income students are less likely to complete the minimum coursework necessary to be accepted into universities (30 percent, compared with half of non–low–income students).
- California ranks 46th in the country in national assessments of 4th grade reading and math. California students perform only slightly better in 8th grade. Both low–income and non–low–income students perform lower than their peers in other states.
Slots and Funding by Age of Child, 2014–15
- About 356,000 children will receive subsidized child care or preschool in 2014–15, costing over $2.4 billion. The state is providing 62 percent of total funding, with the federal government providing the remainder.
- Low–income families (up to roughly $42,000 per year for a family of three) are eligible for subsidized child care and preschool programs. With the exception of State Preschool, programs require the parents to be working.
- All families participating in California Work Opportunity and Responsibility to Kids are guaranteed subsidized child care. In addition, the state serves a small share of other low–income, working families.
Headcount Enrollment, 2012–13
- The share of students enrolled in public colleges and universities is higher in California than in the nation (79 percent and 70 percent, respectively). California’s share of students in nonprofit colleges is lower, while the share in for–profit schools is similar.
- Another way to measure enrollment is by full–time equivalent students (FTES). About 72 percent of the state’s FTES are in the public sector compared with 66 percent nationally. (This is smaller than the share of students using headcount due to a disproportionately large number of part–time students in the community colleges.)
Per–Student Education and Student Services Spending, 2014–15
- State support (consisting of direct appropriations to the segments as well as Cal Grants and Middle Class Scholarships) accounts for 62 percent, 66 percent, and 93 percent of educational costs at the University of California, California State University, and California Community Colleges, respectively.
- The student and family share of these costs is about 25 percent at the universities and 6 percent at the community colleges.
- Other sources of support include interest earnings, federal contract and grant overhead, patent royalties, and private gifts.
Systemwide Tuition and Fees for Full–Time Undergraduate California Residents
- Changes in tuition and fees have been irregular, with periods of flat or even falling tuition alternating with periods of steep increases.
- Compared with 20 years ago, tuition levels have more than tripled in actual dollars but less than doubled in inflation–adjusted dollars.
- Currently, California Community Colleges fees are lowest among the 50 states. Undergraduate tuition and fees at the California State University are lower than all 15 of its public comparison universities and at the University of California are below three of four public comparison institutions.
- About half of California students currently enrolled in the public sector receive grants or waivers that fully cover systemwide tuition and fees.
(Dollars Awarded in Billions)
- Over the last 20 years, total state aid has increased more than 12–fold in actual dollars and 6–fold in inflation–adjusted dollars.
- Growth in state financial aid spending has been related to increases in tuition at the public segments (which increase costs of Cal Grants and fee waivers), increases in the number of students receiving aid, and state policy changes.
- In addition to state aid, many students receive federal financial aid, including Pell Grants and federal tax deductions and credits.
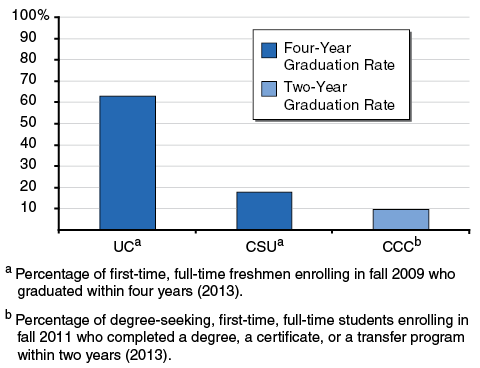
- Some students not graduating on time graduate later. At the University of California and the California State University (CSU), six–year graduation rates rise to 83 percent and 52 percent, respectively. At the California Community Colleges, the three–year graduation rate rises to 25 percent.
- A student can take longer to graduate because he/she (1) enrolls in less than 15 credits some terms, (2) cannot find space in required courses, (3) changes major, or (4) pursues a double major.
- As time goes on, increases in graduation rates drop off. For example, after ten years at CSU, graduation rates rise to 60 percent. Virtually all of the remaining 40 percent of students have left the system.
|
Program
|
Funding
|
|
Total Funds
|
General Fund
|
|
SSI/SSP. Cash assistance to low–income aged (65+), blind, or disabled individuals.
|
$9.9
|
$2.8
|
|
CalFresh. Food assistance to low–income individuals and families. (Formerly known as the Food Stamp Program.)
|
9.6
|
0.7
|
|
IHSS. In–home personal care and domestic services to low–income aged (65+), blind, or disabled individuals.
|
6.4
|
2.0
|
|
CalWORKs. Cash assistance and welfare–to–work services to very low–income families with children.
|
5.4
|
1.1
|
|
DDS—Community Services. Wide range of services in community settings for individuals with developmental disabilities.
|
4.4
|
2.5
|
|
DDS—Developmental Centers. Wide range of services in an institutional setting for individuals with developmental disabilities.
|
0.6
|
0.3
|
|
Foster Care. The temporary placement of children in a foster home when they have been removed from their families’ home due to maltreatment.
|
1.9
|
—
|
(Caseloads in Thousands)
|
Program
|
Caseload
|
|
Percent Change
|
|
2003–04
|
2013–14a
|
2003–04 to 2013–14
|
|
CalFresh
|
1,839
|
4,332
|
|
136%
|
|
IHSS
|
318
|
473
|
|
49
|
|
DDS—Community Services
|
190
|
265
|
|
40
|
|
SSI/SSP
|
1,158
|
1,299
|
|
12
|
|
CalWORKs
|
1,251
|
1,325
|
|
6
|
|
Foster Care
|
90
|
65
|
|
–28
|
|
DDS—Developmental Centers
|
3
|
1
|
|
–62
|
- Between 2003–04 and 2013–14, the caseloads for some major human services grew while others declined.
- The DDS—Developmental Centers and Foster Care caseloads are the only major human services programs to experience a caseload decline over the time period. This decline is primarily due to policy decisions to rely on alternative services for these individuals.
- During the recent economic downturn, unemployment rates increased and income decreased—causing the CalFresh and CalWORKs caseloads in particular to increase. While CalWORKs peaked in 2010–11 and has been declining since, CalFresh continues to grow.
Average Annual Cost Per Consumer (In Thousands)