Wages and salaries typically account for about 60% of total revenue from the personal income tax, which is the state government's largest revenue source. In making projections concerning the state budget, both the administration and our office have to consider historical wage and salary data and make estimates about future changes in wages and salaries. This post provides some background on our respective wage and salary estimates, as of the 2016 May Revision.
Economic Scenario Assumptions and Estimates
U.S. and California Economic Models. In California and other states, budget projections begin with a process of modeling the possible future track for the U.S. economy. Both our office and the administration use national economic analysis firms to help us develop our multiyear assumptions for the U.S. economy. Our office, for example, contracts with Moody's Analytics for this purpose. We then use those U.S. economic assumptions to develop multiyear scenarios for what might happen to California's economy. (We summarized the LAO and administration May 2016 economic scenarios here.)
Bureau of Economic Analysis (BEA) Measurement of Wages and Salaries. The economic statistic known as "personal income" is a broad measure of the economy that we use frequently to gauge national and state-level economic performance. The largest component of personal income, as defined by the U.S. BEA, is the category called "wages and salaries." According to BEA data, wages and salaries made up $1.06 trillion of California's $2.06 trillion of total personal income in 2015. Wages and salaries are measured before deductions such as payroll taxes and employee pension contributions are taken out and include commissions, tips, bonuses, gains from exercising certain stock options, and deferred compensation such as 401(k) contributions.
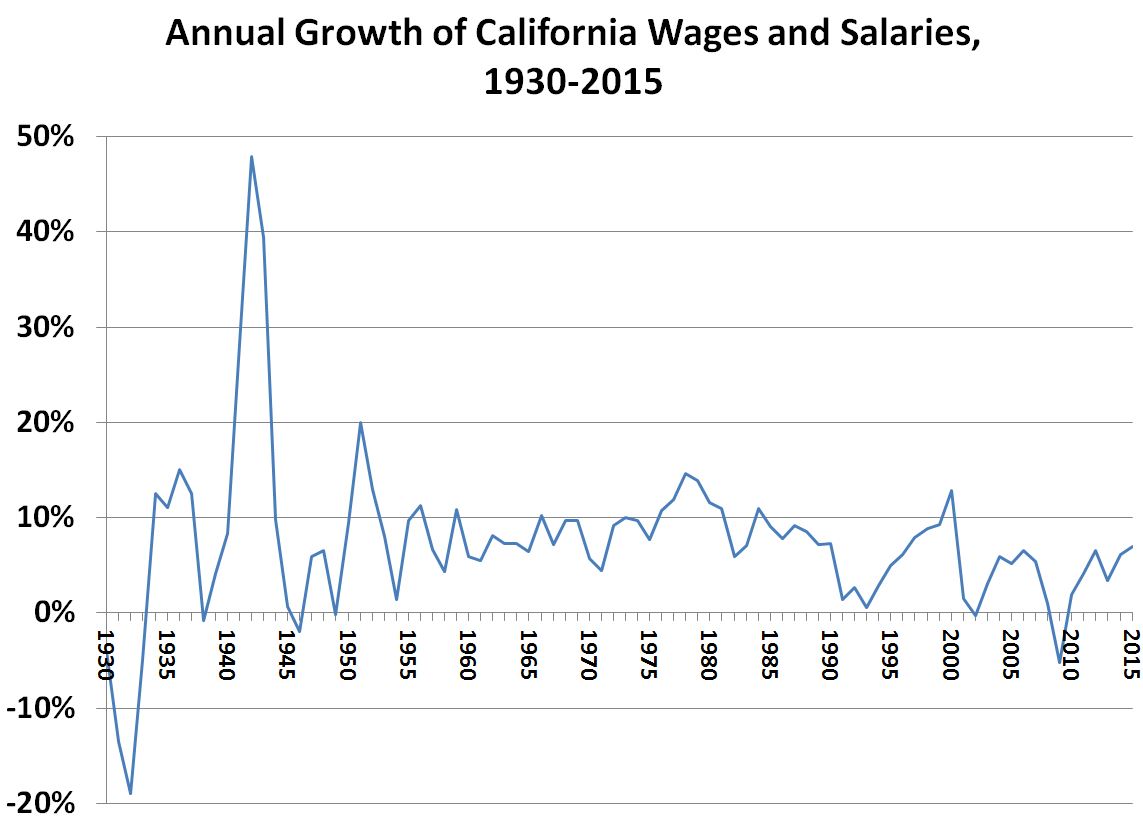
Historical Growth of California Wages and Salaries. The table below shows the annual percentage change in wages and salaries in California since 1930. As a result of the Great Depression, the state's wages and salaries fell from $3.0 billion in 1929 to $1.9 billion in 1933, including a 13.5% drop in 1931 and an 18.9% decline in 1932. The war mobilization effort greatly expanded California personal income in the early 1940s, as wages and salaries climbed 28.3% in 1941, 47.9% in 1942, and 39.4% in 1943. Population growth and inflation helped expand wages and salaries in subsequent decades. From 1945 through 1985, on average, wages and salaries in California grew at 8.2% per year. Since 1985, with slower population growth and inflation, that growth rate has slowed to a simple average of 5.0% per year. Since 2000, the simple average growth rate has been 3.5% per year. (That latter period includes 2002 [0.3% decline] and 2009 [5.2% decline]. Without those two years included, this growth rate since 2000 rises to 4.4% per year.)
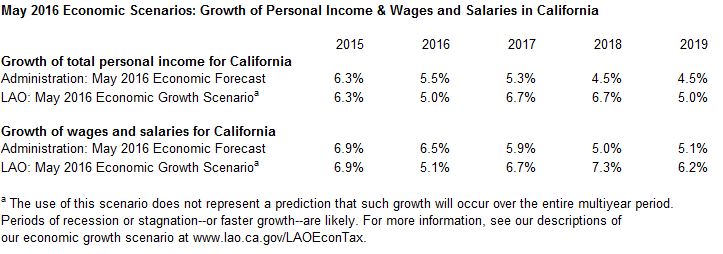
LAO and Administration Economic Scenarios. Each year, when our office and the administration release our economic scenarios, our office summarizes them in tables that show our respective assumptions concerning the annual growth of BEA-defined personal income in California. The key component of this annual growth relates to wages and salaries. As of the 2016 May Revision, our respective economic scenarios included the projections shown below concerning personal income growth and wage and salary growth in California.

How We Make These Estimates. Based on the assumptions in the economic scenario we are using, we make estimates of BEA-defined total wages and salaries for California. Starting with the most recent quarter for which we have data as a baseline (for our May 2016 estimates, the latest data we had was for the fourth quarter of 2015), our projected percentage change in wages and salaries for each quarter is the sum of percentage changes in three components:
- Statewide employment growth, derived from our own economic scenario estimates of future job growth in 22 separate sectors and subsectors.
- National average wage growth, from the national economic scenario developed by Moody's Analytics.
- The difference in wage growth between the state and the nation, based on the trend of the past few years and on scheduled policy changes.
For example, for the second quarter of 2016, our economic growth scenario estimates are that statewide jobs will grow 0.49% and national average wages will grow 0.89%. Assuming that California average wages grow 0.05 percentage points faster than the nation, this means there would be a 1.43% increase in statewide wages and salaries in that quarter (that is, 0.49 + 0.89 + 0.05 = 1.43).
Revenue Outlook Estimates
Taxable Wages and Salaries. For federal tax purposes, wages and salaries are broadly defined as all pay that employees receive for services they perform for their employers. This includes irregular wage payments such as bonuses, commissions, and overtime pay, tips from customers, and various forms of noncash compensation such as certain employee stock options and fringe benefits like employee discounts and the use of employer-owned vehicles. This is all detailed in Internal Revenue Service Publication 15. California’s definition of taxable wages and salaries conforms very closely to the federal definition, and the annual difference between the state and federal totals amounts to less than 0.1 percent.
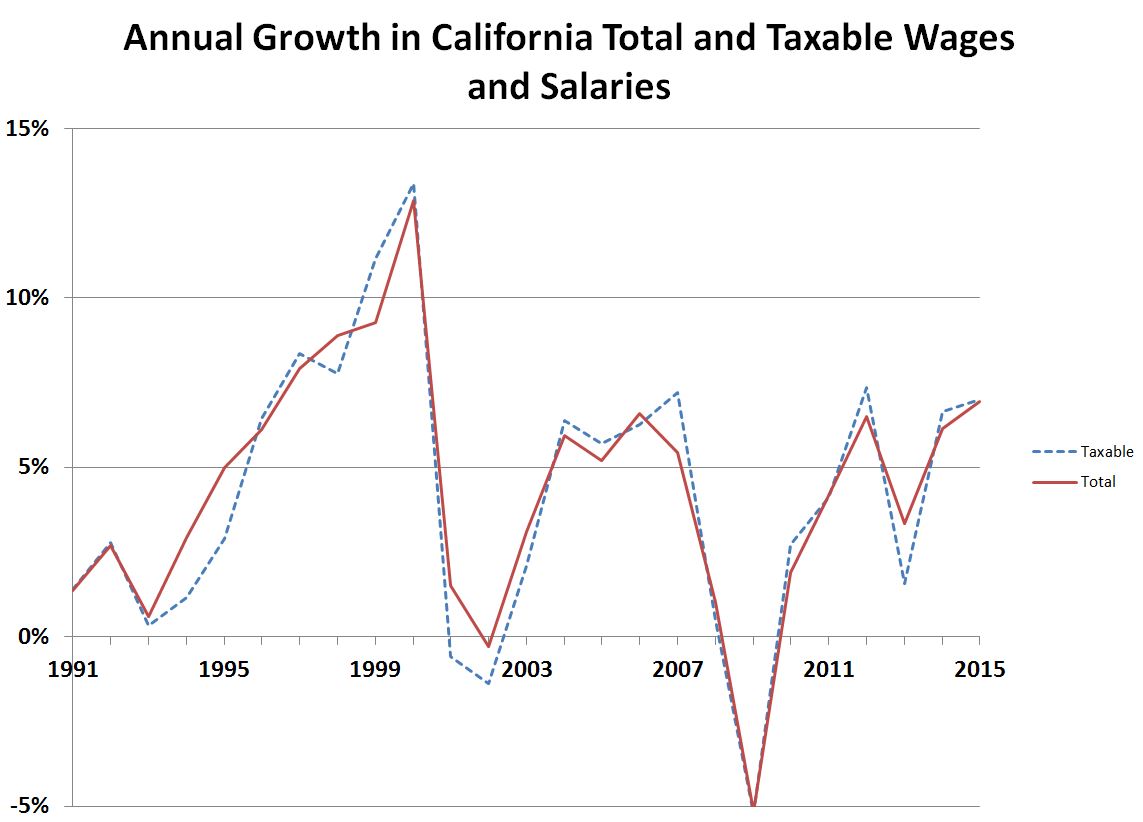
Translating Total Wages and Salaries to Taxable Wages and Salaries. Once we have our annual scenario estimates of growth in total wages and salaries from the quarterly figures described earlier, we then make estimates of what this would mean for growth of taxable wages and salaries based on the historical relationship between the two numbers. As 2014 is the latest year for which the state Franchise Tax Board has hard data, our current growth estimate for 2015 is based on the actual growth rate in total wages and salaries, adjusted (as best we can determine) to "fit" the amount of income tax withholding that the state actually collected in 2015. Projected growth rates for taxable wages and salaries for subsequent years are based solely on projected total wage growth, which we summarized above. The growth rate in taxable wages and salaries is usually within a percentage point or two of the growth rate of total wages and salaries, as shown below.
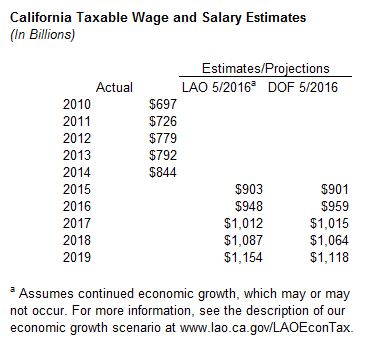
LAO and Administration Taxable Wage and Salary Estimates. Below, we summarize the LAO and administration taxable wage and salary estimates as of the 2016 May Revision. Under the LAO May 2016 economic growth scenario, we have lower estimates for taxable wage and salary growth in 2016, but faster estimates of growth in 2017 which results in our estimates of taxable wages and salaries being virtually identical ("catching up") to the administration's then. Consistent with the higher assumed rates of inflation and wage growth in our economic scenario, our multiyear estimates rise above the administration's in 2018 and 2019. By 2019, our economic growth scenario would have taxable wages and salaries about $36 billion (3.2%) above the administration's multiyear projections.
Follow @LAOEconTax on Twitter for regular California economy and tax updates.


