
For other reports and posts related to our November 2018 Fiscal Outlook, see here.
The single largest source of General Fund revenue is the personal income tax (PIT). One key component in estimating PIT revenue is capital gains on asset sales. Forecasting these gains, however, is especially challenging. This post discusses our method for making these estimates.
What Are Capital Gains? A capital gain is defined as the difference between an asset’s sale price and its original purchase price. This is true for sales of both physical assets (such as land and buildings) and financial assets (such as stocks and bonds).
How Are Capital Gains Taxed in California? Capital gains are taxed at the same rates as other income. (A portion of these gains from primary residence sales, however, are exempt from tax.) Net losses incurred on asset sales can be used to offset gains that the taxpayer received on other sales in the same year, and/or carried forward to offset gains in subsequent years.
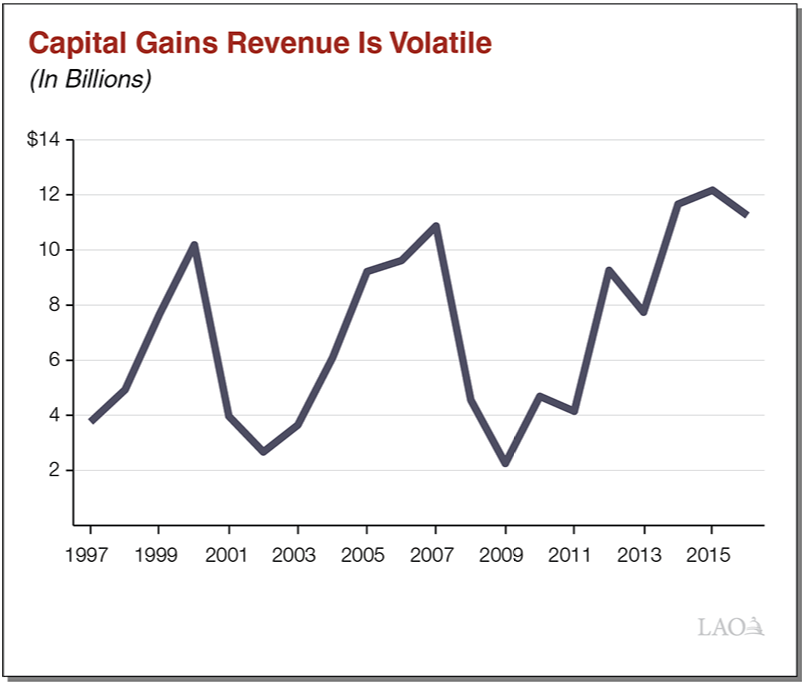
Capital Gains Are Volatile. As seen in the figure below, income tax revenues on capital gains are a volatile component of General Fund revenue, ranging from $2 billion in 2009 to $12 billion in 2015. Capital gains are volatile in part because they depend on differences between purchase prices and selling prices of assets. (We discuss PIT volatility in more detail here.) While 2017 returns are not yet final, revenue collections and asset price movements suggest capital gains revenue near $15 billion.
Determining Future Asset Prices. While past stock and home prices are known, we also must estimate future stock and home prices in order to estimate capital gains. For stock prices we rely on the Moody’s consensus forecast, often with adjustments based on more recent price data. For home prices, we developed a model that estimates home prices based on recent price, sales, and inventory trends.
Estimated Gains Depend on Holding Period. The potential capital gain on any asset depends on how long that asset has been held (the holding period). For example, between March 2005 and October 2018, the S&P 500 grew almost 1,300 points. In contrast, between September of 2017 and October 2018 the S&P 500 grew less than 300 points. Consequently, on average, a share of stock purchased in March 2005 and sold last month would yield a larger capital gain than a similarly priced share of stock purchased in September 2017 and sold last month.
Assets With Shorter Holding Periods Sold More Frequently. For each year, we estimate the gain a typical sale is expected to make based on movements in the S&P 500. Because these gains depend on how long the asset has been held, we make separate estimate for assets with different holding period (1-2 years, 2-3 years, etc.). We then make assumptions about the share of sales that come from assets in each holding period. Based on historical data, we assume a higher share of sales come from assets held for shorter periods of time than from assets held for longer periods of time. This means that each point of increase in the S&P over the past 13 months generates more revenue than each point of increase over the past 13 years. Finally, multiplying our estimate of the gains for a typical sale by the expected number of sales yields an estimate of total capital gains.
Applying the Tax Rate. As with other forms of income that are subject to the personal income tax, we have to project the distribution of capital gains among different income groups. This is important because higher-income filers pay much higher average tax rates on their income than lower- and middle-income filers. Consequently, capital gains earned by higher-income filers are taxed at higher rates. We estimate the income distribution using historical data on filings from the Franchise Tax Board and apply effective tax rates (liability as a fraction of taxable income after deductions) to income based on recent patterns.
Recent Experience. Gains in house prices and especially stock prices since the beginning of 2017 suggest that the state should collect more personal income tax revenue from capital gains in 2017 and 2018 than it did in 2016. While the S&P 500 has fluctuated in 2018 (and is currently close to January levels), prices increased roughly 20 percent in 2017. As a result, most stocks that had been held for more than a year were trading well above their purchase prices for most of 2018, creating a lot of opportunities for large gains.