Revenue from taxation of capital gains is a major component of state personal income tax collections, making up 16 percent of total projected personal income tax revenues for 2018-19. Capital gains depend heavily on movements in financial markets. As such, capital gains revenue is extremely volatile and difficult to predict. In any given year, there is significant risk that capital gains revenue could fall below budgetary expectations. (Some of this volatility is absorbed by the Proposition 2, which allocates a portion of capital gains revenues to debt repayments and reserves.)
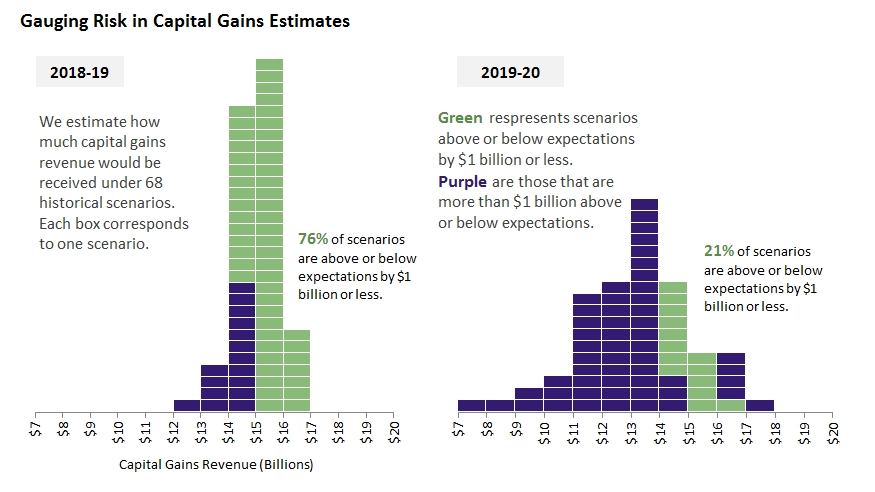
Recognizing the inherent risk of capital gains revenue assumptions, we examined the historical pattern of financial markets in an attempt to gauge the range of possible outcomes for capital gains revenue in 2018-19 and future years. Specifically, we tried to answer the question: how much capital gains revenue would be received if stock prices over the rest of 2019 and future years follow the patterns of previous historical periods? Our analysis covers 68 historical periods in total. We then compare the results from each period to capital gains revenue assumptions in the Governor's 2019-20 May Revision. The results for 2018-19 and 2019-20 are shown in the graphic below. This analysis reflects actual stock prices through May 10, 2019.
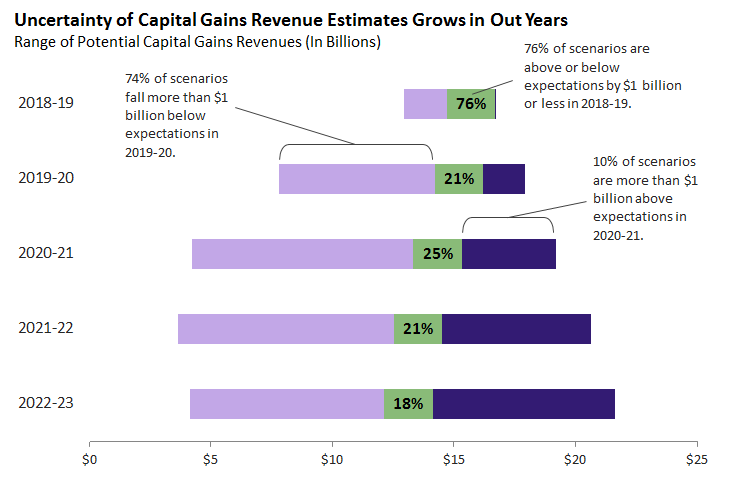
The results suggest that there is a good chance that captial gains revenues will fall within $1 billion (above or below) of budgetary expectations for 2018-19. This relative certainty deteriorates quickly, as the range of potential captial gains revenue scenarios widens significantly in 2019-20. As a result, only about one-fifth of scenarios are $1 billion above or below revenue expecations in 2019-20. The range of potential reveneus widens further in the outyears, as shown in the graphic below. By 2022-23, potential capital gains revenues range from a low scenario of $4 billion to a high scenario of $22 billion.


