LAO Contacts

February 22, 2019
The 2019-20 Budget
Analysis of the Department of
Social Services Budget
Executive Summary
The Department of Social Services Administers Several Major Human Services Programs. California’s Department of Social Services (DSS) administers a number of human services programs that provide a variety of benefits to the state’s residents. These include income maintenance for the aged, blind, or disabled; cash assistance and employment services for low‑income families with children; protecting children from abuse and neglect; and providing home care workers who assist the aged and disabled in remaining in their own homes. This report provides information, analysis, and recommendations on the Governor’s 2019‑20 proposals for the major programs in DSS.
Governor’s Proposed Grant Increase for CalWORKs Is a Step Towards the Legislature’s Goal, but With Some Key Differences. The 2018‑19 budget package included statutory intent language stating the Legislature’s goal to increase the California Work Opportunity and Responsibility to Kids (CalWORKs) grants to ensure participating families’ incomes are above 50 percent of the federal poverty level (FPL) by 2020‑21. The 2018‑19 budget approved the first step of this plan by providing an across‑the‑board 10 percent grant increase effective April 1, 2019. The Governor’s budget proposes to further increase CalWORKs grants by 13.1 percent, which would raise grant levels for CalWORKs cases with three eligible family members to 50 percent of FPL for a family of three. The proposal assumes the grant increase would go into effect October 1, 2019 and cost $348 million in 2019‑20. Full‑year costs are expected to be $455 million in 2020‑21. The administration’s proposal differs from the Legislature’s plan in terms of how grant increases are distributed across CalWORKs cases of different sizes, how much overall grant amounts increase, and when the increases would occur. We provide background on the Legislature’s plan for CalWORKs grant increases, describe how it differs from the Governor’s proposal, and provide the Legislature with options to consider as it shapes its 2019‑20 plan for CalWORKs.
Setting a Target for the CalWORKs Portion of the Safety Net Reserve. In 2018‑19, the Legislature created the Safety Net Reserve account and made an initial deposit of $200 million General Fund into the reserve. Funds in the Safety Net Reserve were to be available for two programs—CalWORKs and Medi‑Cal. (The $200 million initial deposit was made in the CalWORKs subaccount.) These programs are counter‑cyclical—meaning program spending ramps up during economic downturns, as more people become eligible to receive benefits, and slows during periods of economic growth when the labor market is stronger. We provide background on the Safety Net Reserve, review how the Great Recession affected CalWORKs, and simulate three recession scenarios to help the Legislature consider a target level for the CalWORKs portion of the Safety Net Reserve. We estimate that cumulative additional costs in CalWORKs could range from $2 billion (as a result of a minor recession) to more than $6 billion (over the course of a major recession). With these amounts in mind, we recommend that the Legislature set a target based on the share of these additional costs it intends for the Safety Net Reserve to cover during a recession, and assess the Governor’s proposed Safety Net Reserve deposit based on whether it is in‑line with the Legislature’s target.
Governor’s Proposals for IHSS and SSI/SSP Program Appear Reasonable. We have reviewed the administration’s 2019‑20 budget proposals for the In‑Home Supportive Services (IHSS) and the Supplemental Security Income/State Supplementary Payment (SSI/SSP) programs. While we raise a few issues for legislative consideration—for example, questions related to the implementation of the elimination of the SSI cashout policy—overall we find the administration’s proposals to be reasonable at this time. We will continue to monitor IHSS and SSI/SSP programs and update the Legislature if we think any changes to the caseload and budgeted funding levels should be made.
Governor Continues to Implement Continuum of Care Reform (CCR), Some Challenges Remain. The Governor’s budget proposes funding in 2019‑20 to continue to implement CCR in the state’s foster care system. At a high level, CCR aims to reduce reliance on long‑term group home placements and increase the utilization and capacity of home‑based family placements for children in the foster care system. While the Governor’s proposal for CCR does not include any major policy changes, it does reflect more up‑to‑date estimates of the costs of CCR implementation—including the expiration of certain temporary funding augmentations for the counties. We provide background on CCR, highlight a few implementation challenges, describe the Governor’s funding proposal, and raise issues and questions for legislative consideration.
CalWORKs
Background
The California Work Opportunity and Responsibility to Kids (CalWORKs) program was created in 1997 in response to the 1996 federal welfare reform legislation that created the federal Temporary Assistance for Needy Families (TANF) program. CalWORKs provides cash grants and job services to low‑income families. The program is administered locally by counties and overseen by the state Department of Social Services (DSS).
Cash Assistance. Grant amounts are adjusted for family size, income level, and other factors. As an example, a family of three in a high‑cost county that has no other earned income currently receives $714 per month. In 2018‑19, the average CalWORKs grant amount is estimated to be $568 monthly. (As will be discussed later, grant amounts are scheduled under current law to increase in April 2019. The 2018‑19 average grant amount accounts for this increase.) Adults may receive cash assistance for up to 48 months. Adults who exceed the time limit are no longer included as part of the CalWORKs case for purposes of determining the family’s grant amount. (Children and other eligible adults in these families continue to receive assistance.) This has the effect of reducing the family’s monthly grant amount, typically by $100 to $200 per month for each ineligible member. Families enrolled in CalWORKs are typically also eligible for CalFresh food assistance and Medi‑Cal health coverage.
Work Requirement and Employment Services. As a condition of receiving aid, adults are generally required to be employed or to participate in job search and readiness training. People who are enrolled in these activities may also receive services to help them meet these requirements, including subsidized child care, reimbursement for transportation, and housing assistance. Housing assistance may include short‑term vouchers, rental deposits, and long‑term subsidized housing. Adults who do not meet the work participation requirements of the program may be sanctioned. Sanctioned adults are temporarily ineligible to receive cash assistance, meaning grants for these families are reduced by between $100 and $200 per month until the sanction is addressed.
In More Than One‑Half of Cases, Family Size Differs From CalWORKs Assistance Unit Size. Monthly CalWORKs grant amounts are set according to the size of the assistance unit (AU). The size of the AU is the number of CalWORKs‑eligible people in the household. Grant amounts are adjusted based on AU size—larger AUs are eligible to receive a larger grant amount—to account for the increased financial needs of larger families. In almost one‑half of CalWORKs cases, everyone in the family is eligible for CalWORKs and therefore the AU size and the family size are the same. In about 55 percent of cases, though, one or more people in the family are not eligible for CalWORKs and therefore the AU size is smaller than the family size.
Some Family Members May Not Be Counted. People may be ineligible for CalWORKs for a number of reasons. Most commonly, people are ineligible because they (1) have exceeded the 48‑month time limit, (2) are currently sanctioned for not meeting the work participation requirements, or (3) are receiving Supplemental Security Income/State Supplementary Payment (SSI/SSP) benefits and therefore ineligible to receive both SSI/SSP and CalWORKs. Additionally, many individuals are ineligible due to their immigration status. Undocumented immigrants, as well as most immigrants with legal status who have lived in the United States for fewer than five years, are ineligible.
Funding. CalWORKs is funded through a combination of California’s federal TANF block grant allocation ($3.7 billion annually), the state General Fund, realignment funds, and county general funds. To receive its annual TANF block grant, the state must spend a maintenance‑of‑effort (MOE) amount from state and local funds to provide services for families eligible for CalWORKs. This MOE amount is $2.9 billion. In addition to funding for cash grants, counties receive several other funding allocations from the state to administer and operate CalWORKs. The main funding allocation—known as the “single allocation”—funds employment services, eligibility determination and administrative costs, and child care subsidies.
Recent Changes
2018‑19 Budget Enacted Significant CalWORKs Changes. The 2018‑19 Budget Act implemented several changes to the CalWORKs program. The 2019‑20 Governor’s Budget proposes adjustments to these changes. Below, we outline the major CalWORKs components of the 2018‑19 budget agreement.
- Legislature Outlines Multiyear Plan for CalWORKs Grant Increases. As part of the 2018‑19 Budget Act, the Legislature set a goal to increase CalWORKs grants so that monthly grant levels are high enough such that CalWORKs families’ incomes are above 50 percent of the federal poverty level (FPL). (The U.S. Census Bureau designates families with cash resources below 50 percent of the FPL as living in “deep poverty.”) The goal of the Legislature’s plan is to ensure that no children live in families who have monthly cash income that is below the threshold for deep poverty. To meet this objective, budget‑related legislation included a three‑year plan, subject to annual appropriation, to ultimately increase grants to 50 percent of the FPL for a family that is one person larger than the CalWORKs AU size. The Legislature chose this expanded family size as its target because, as discussed earlier, more than one‑half of CalWORKs families include an ineligible family member—typically due to their immigration status, having reached the 48‑month time limit, or not meeting the program’s work requirements. Setting grants to 50 percent of the FPL for a larger family size has the effect of ensuring that families with an ineligible member also have monthly cash incomes above the deep poverty threshold.
- 10 Percent Grant Increase Provided as First Step in Legislature’s Plan. The 2018‑19 budget included a 10 percent across‑the‑board grant increase as the first step in meeting the Legislature’s ultimate goal. Throughout this report, we refer to this upcoming increase as the “current‑law” increase because it is scheduled, under current law, to go into effect April 1, 2019. The maximum grant for a family of three will increase from $714 per month to $785 per month. The administration estimates that the full‑year cost of this increase will be $320 million in 2019‑20. If funded, the second step in the Legislature’s plan would occur in 2019‑20. This interim grant increase would raise grants for all families up to an amount that is halfway between the current‑law grant level and the ultimate goal of 50 percent of poverty for family that is one person larger than the CalWORKs AU size. The final step, to go into effect in 2020‑21 if funded, would raise grants from the interim amount to the ultimate goal.
- Newly Created Safety Net Reserve Receives $200 Million Up‑Front Deposit. The 2018‑19 budget plan created the Safety Net Reserve, which aims to set aside funds for future expenditures of two programs: CalWORKs and Medi‑Cal. (These are programs that, during a recession, typically have increased expenditures as caseload increases.) The 2018‑19 budget plan deposited an initial $200 million in the CalWORKs subaccount and directed the administration to develop a methodology to (1) calculate savings that occur in the programs when the caseload declines and (2) deposit a portion of these savings into the reserve in future years.
- New CalWORKs Home Visiting Initiative. The budget included $158 million in federal TANF funds to begin a three‑year home visitation program within CalWORKs. Under the new program, CalWORKs families with a child under two years old could be eligible to receive regular visits from a nurse, parent educator, or early childhood specialist who works with the family to improve maternal health, parenting skills, and child cognitive development.
Budget Overview
Overall Spending Trends. As shown in Figure 1, the Governor’s budget proposes $5.3 billion in total funding for the CalWORKs program in 2019‑20, an increase of $391 million (8 percent) relative to the most recent spending estimate for 2018‑19. This increase is the net effect of higher spending on cash grants, due to recent and proposed increases in grant levels, offset somewhat by lower underlying costs that result from declining year‑over‑year caseload. We provide an in‑depth analysis of the Governor’s proposed grant increase in the section of this analysis that follows.
Figure 1
CalWORKs Budget Summary
All Funds (Dollars in Millions)
|
2018‑19 |
2019‑20 |
Change From 2018‑19 |
||
|
Amount |
Percent |
|||
|
Number of CalWORKs cases |
391,161 |
371,316 |
‑19,845 |
‑5% |
|
Cash Grants |
$2,685 |
$3,068 |
$384 |
14% |
|
Single Allocation |
||||
|
Employment services |
$841 |
$809 |
‑$32 |
‑4% |
|
Cal‑Learn case management |
20 |
20 |
— |
— |
|
Eligibility determination and administration |
602 |
579 |
‑23 |
‑4 |
|
Stage 1 child care |
290 |
272 |
‑17 |
‑6 |
|
Subtotals, Single Allocation |
($1,753) |
($1,680) |
(‑$72) |
(‑4%) |
|
Home Visiting Initiative |
$29 |
$79 |
$50 |
170% |
|
Other County Allocations |
383 |
405 |
22 |
6 |
|
Othera |
12 |
21 |
— |
— |
|
Totals |
$4,862 |
$5,253 |
$391 |
8% |
|
aPrimarily includes various state‑level contracts. |
||||
Funding CalWORKs. Figure 2 displays the various funding sources for the CalWORKs program. In general, CalWORKs is funded through a combination of California’s federal TANF block grant allocation (which totals $3.7 billion annually), the state General Fund, realignment funds, and county general funds. Federal law allows for a degree of state flexibility in the use of federal TANF funds. Specifically, the state may use its annual TANF block grant to support other state programs, including student financial aid, Child Welfare Services, and services for people with developmental disabilities. As a result of this flexibility, the state does not use its entire TANF grant within the CalWORKs program. Instead, the proposed budget dedicates $2.2 billion of the annual $3.7 billion block grant to CalWORKs and the rest to other areas of the state budget.
Figure 2
CalWORKs Funding Source
(Dollars in Millions)
|
2018‑19 |
2019‑20 |
Change From 2018‑19 |
||
|
Amount |
Percent |
|||
|
Federal TANF block grant funds |
$1,958 |
$2,200 |
$242 |
12% |
|
State General Fund |
295 |
520 |
225 |
76 |
|
Realignment and other county fundsa |
2,609 |
2,532 |
‑77 |
‑3 |
|
Totals |
$4,862 |
$5,253 |
$391 |
8% |
|
aPrimarily various realignment funds, but also includes county share of grant payments, about $60 million. TANF = Temporary Assistance for Needy Families. |
||||
Caseload Continues to Decline Faster Than Anticipated. The Governor’s budget updates prior caseload projections and assumes that a monthly average of 391,161 families will receive CalWORKs benefits in 2018‑19. This represents a 7.6 percent year‑over‑year decline from 2017‑18. This decline is greater than was anticipated—the 2018‑19 Budget Act assumed a 4.4 percent year‑over‑year decline. Looking ahead, the Governor’s budget assumes that a monthly average of 371,316 families will receive CalWORKs during 2019‑20, a decline of 5.1 percent relative to the revised estimate for 2018‑19.
Administration’s Caseload Forecast Appears Reasonable. Both our office and the administration have over‑estimated the CalWORKs caseload in recent forecasts. In other words, since it reached its highest recession‑period mark in 2011, the caseload has declined more rapidly each year than we forecasted. With this tendency in mind, both our office and the administration have recalibrated our caseload forecast models to more accurately account for the ongoing caseload decline. Despite prior over‑estimation, the administration’s updated forecast is generally in‑line with our office’s expectation for the CalWORKs caseload and thus appears reasonable in our view. Updated caseload data will be available for us to fully assess the estimate for the May Revision.
Budget Proposes to Make CalWORKs Home Visiting Initiative Larger and Ongoing. As mentioned previously, the 2018‑19 budget included $158 million in federal funds to begin a three‑year home visiting program in CalWORKs. The Governor’s budget proposes to make the home visiting program ongoing. Funds provided in the 2018‑19 Budget Act, including $79 million proposed to be used in 2019‑20, would support this program for the next two years.
Budget Proposes Placeholder Single Allocation for County CalWORKs Services. As part of the 2017‑18 budget, the Legislature requested that the administration reevaluate the methodology used to determine how much funding counties receive to operate CalWORKs. Last year, the Legislature adopted a new methodology for eligibility and administration operations. The administration is now revising the methodology for county employment services. In the meantime, the proposed budget includes a placeholder funding amount for county employment services. This proposal has the effect of holding funding for employment services at the level provided in the 2018‑19 budget.
Analysis of Governor’s Proposed Grant Increase
LAO Bottom Line. The Governor proposes to increase CalWORKs grants by 13.1 percent across‑the‑board in 2019‑20. The proposal represents a step toward the Legislature’s stated goal of raising grant amounts. However, the Governor’s proposal differs from the Legislature’s plan in several ways. First, instead of raising grants by the same percentage across‑the‑board, as the Governor proposes and as has been done in the past, the Legislature’s plan, as outlined in current law as a statement of intent (that is subject to appropriation), takes a new approach. Specifically, the Legislature’s plan would raise the grant level for each AU size by the amount necessary to reach its target of 50 percent of the FPL. This would have the effect of raising grant levels by varying amounts depending on the size of the AU. Second, in order to reach its stated target, the Legislature’s plan would raise grants to a higher level overall than the Governor’s proposal. The Legislature’s target—50 percent of FPL for a family size one person larger than the AU size—is intended to ensure that no families with children have cash income below 50 percent of the FPL, even if a family member is ineligible to receive cash assistance. Finally, the Governor has proposed a single grant increase, whereas the Legislature’s plan calls for multiple grant increases—the next in 2019‑20 and the final in 2020‑21. (While the administration has proposed a single grant increase for 2019‑20, that does not prevent it from proposing additional grant increases in future years.) As a result of the higher grant amounts overall, the Legislature’s plan would be somewhat more costly than the Governor’s proposal in 2019‑20 and significantly more costly in future years.
In assessing the Governor’s proposal, we recommend that the Legislature consider what it wants to accomplish first—distributing grant increases equally across all AU sizes (similar to the Governor’s approach) or concentrating grant increases among some AU sizes in pursuit of its aim to eventually get all AUs to the same percentage of the FPL (the Legislature’s stated approach)—and how quickly it hopes to reach its final target. The Legislature could then adopt the Governor’s proposal as is, or take a different action, based on what it wants to accomplish first and how quickly it hopes to reach its final target.
13.1 Percent Across‑the‑Board Grant Increase. The Governor proposes a 13.1 percent increase to CalWORKs cash grants, to go into effect October 1, 2019. (This would be in addition to the 10 percent across‑the‑board increase that is scheduled under current law to take effect in April 2019). This increase would raise monthly grants for an AU of three to 50 percent of the FPL for a family of three. As shown in Figure 3, specifically, the Governor’s proposal would increase the maximum grant for an AU of three in a high cost county from $785 per month (the amount scheduled to go into effect April 1, 2019 under current law) to $888 per month. The Governor’s proposal assumes that the grant increase would cost an additional $348 million General Fund in 2019‑20 (reflecting three‑quarters of the fiscal year). Full‑year costs are expected to be $455 million General Fund in 2020‑21.
Figure 3
Governor’s Proposed 13.1 Percent CalWORKs Grant Increase
As Shown, for CalWORKs Families in High‑Cost Counties With No Other Income
|
AU |
Current |
Enacted |
Governor’s Proposal |
|||||
|
Amount |
As a Share |
Amount |
As a Share |
Amount |
As a Share |
|||
|
1 |
$355 |
34% |
$391 |
38% |
$442 |
43% |
||
|
2 |
577 |
41 |
635 |
45 |
718 |
51 |
||
|
3 |
714 |
40 |
785 |
44 |
888 |
50 |
||
|
4 |
852 |
40 |
937 |
44 |
1060 |
49 |
||
|
5 |
968 |
38 |
1065 |
42 |
1205 |
48 |
||
|
aAssistance unit size is the number of family members who are eligible for CalWORKs. bShare of 2019 federal poverty guideline for a family size equal to the AU size. cThe 2018‑19 Budget Act provided a 10 percent grant increase effective April 1, 2019. AU = assistance unit. |
||||||||
Governor’s Proposed Increase Reflects Step Toward Legislature’s Stated Goal . . . The Governor’s grant increase proposal represents a substantial step toward meeting the Legislature’s ultimate goal for CalWORKs grant levels to be reached in 2021.
. . . But Differs From Legislature’s Approach. The Governor’s proposed grant increase for 2019‑20 differs from what would occur under the Legislature’s plan in 2019‑20. Overall, the Governor’s proposed increase would be somewhat smaller but occur six months earlier (in October 2019 instead of April 2020). The Legislature’s approach differs conceptually from the Governor’s proposal in two additional ways, which we describe below:
- Administration’s Proposal Links AU Size to the FPL, Whereas Legislature Aims to Link Family Size to the FPL. Under the Governor’s approach, which would increase grants by 13.1 percent across‑the‑board, a CalWORKs case with an AU of three would be eligible to receive a maximum grant equal to 50 percent of the FPL for a family of three. In this way, the Governor’s proposal links the AU size to the FPL for that size. The Legislature’s plan takes a new approach. Under this approach, the Legislature would raise grants to 50 percent of the FPL for a family size that is one person larger than the AU size. In this way, the Legislature’s plan attempts to account for the fact that the family size is larger than the AU size in cases where there is an ineligible member. For example, a CalWORKs family with an AU size of three would receive a maximum grant of 50 percent of the FPL for a family of four. As a result of this new approach, the grant increase that would occur in 2019‑20 under the Legislature’s approach is higher than the Governor’s proposed increase for 2019‑20.
- Governor Proposes Across‑the‑Board Grant Increase, Whereas Legislature’s Approach Raises Grants by Varying Amounts. Figure 4 shows the percentage increase to grant levels—for different AU sizes—that would occur in 2019‑20 under the Governor’s proposal and the Legislature’s plan. As illustrated in the figure, the Governor’s across‑the‑board approach would increase all grant levels by the same percentage. On the other hand, the Legislature’s approach would raise grants by varying percentages. This is because the current grant amounts for some AU sizes are further from the Legislature’s final target. Therefore, grant amounts for these AU sizes must increase by a larger percentage in order to reach the Legislature’s target grant level for each AU size.
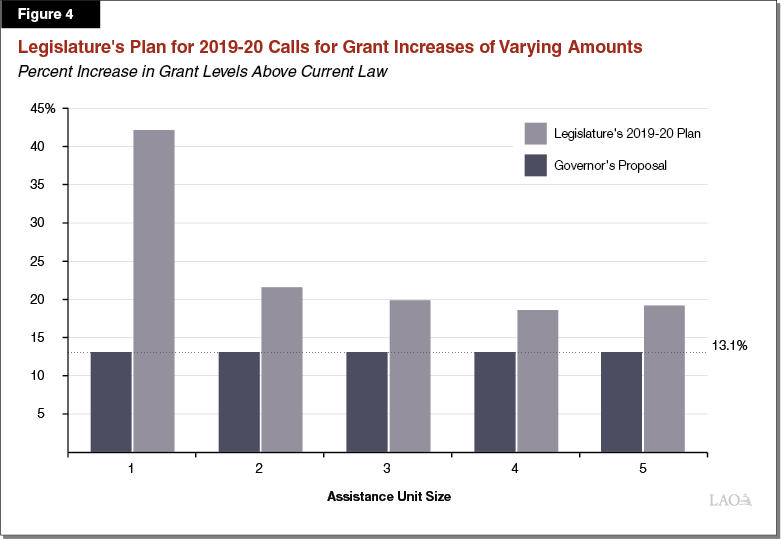
Difference Between Approaches Most Notable for Smallest CalWORKs Families. As previously shown in Figure 3, the current‑law maximum grant for cases with one eligible family member is $391 per month, equal to 38 percent of the FPL for a family of one. However, current‑law grants for other family sizes are higher relative to the FPL—about 44 percent of the FPL on average. The key difference between the Governor’s approach and the Legislature’s plan to raise CalWORKs grants in 2019‑20 relates to proposed grant increases for the smallest cases. This is because the grant amount for the smallest AU size is currently lower, relative to the FPL, than grants for other AU sizes. The Governor’s proposal would increase all grants by 13.1 percent. The Legislature’s approach, which adjusts grants for each AU size, calls for varying increases in grants. The smallest percentage grant increase (for an AU of four) would be 19 percent. The largest percentage grant increase (for an AU of one) would be 42 percent. Figure 5 illustrates this difference by comparing how the two proposals would impact grants for an AU of three and for an AU of one. In 2019‑20, the Governor’s proposal and the Legislature’s approach would increase grants for a family of three by roughly similar amounts. Yet, for a family of one, the Legislature’s approach would increase grants in 2019‑20 by $114 more per month. The figure also shows that the grant increases occur at different times during the 2019‑20 fiscal year.

Legislature’s 2019‑20 Plan Would Be More Costly Than Governor’s Proposal. We estimate that the full‑year cost of the grant increase to occur in 2019‑20 under the Legislature’s plan would be about $250 million higher annually than the Governor’s proposal. (Added costs for 2019‑20 would be a smaller amount, about $60 million above the Governor’s proposal, due to differences in timing between the two approaches.) Overall, relative to the Governor’s proposal, the Legislature’s plan would require a much larger increase in 2019‑20 for cases that have only one eligible family member. (By definition, these cases have at least one ineligible family member.) Higher expenditures under the Legislature’s approach result primarily from the larger grant increases for these cases.
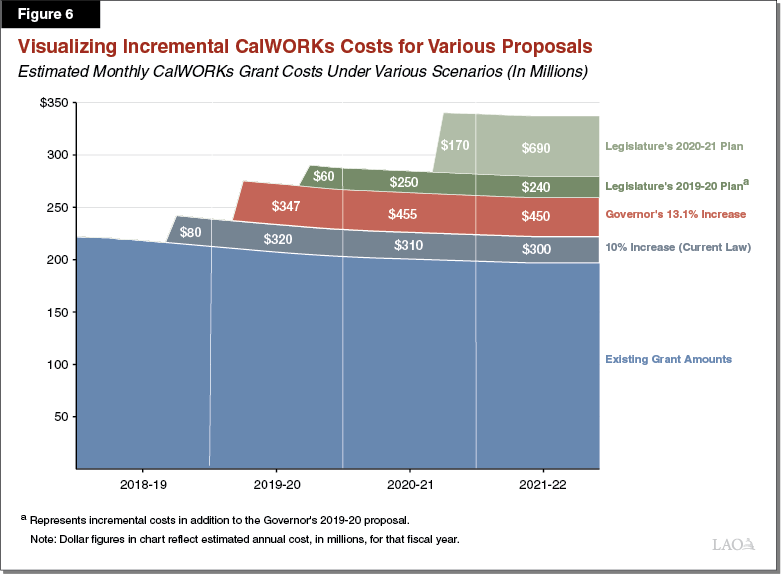
Out‑Year Costs Likely Also Higher Under Legislature’s Approach. It is difficult to compare the cost of the Legislature’s plan to the administration’s proposal in the out years because the Governor has not discussed specific CalWORKs proposals for future years. (While the administration has proposed a one‑time increase in this case, that does not prevent it from proposing further grant increases in future years.) As a point of reference, however, Figure 6 illustrates the estimated multiyear costs of each proposal. The figure displays the monthly total cost of providing CalWORKs grants under (1) current grant levels, (2) the 10 percent increase scheduled to go into effect under current law, (3) the Governor’s 13.1 percent increase, and (4) the two additional steps proposed under the Legislature’s multiyear plan. The dollar figures displayed in the chart show the estimated additional cost of each increase for that fiscal year. As shown in the figure, the Legislature’s final target in 2020‑21 would require more than $900 million in annual ongoing spending above the Governor’s current proposal.
Assess the Governor’s Proposal Based on What the Legislature Hopes to Accomplish First. The Governor’s proposal differs from the Legislature’s plan but nevertheless represents a step in the direction of the Legislature’s ultimate goal. In assessing whether to adopt the Governor’s proposal as is, or take a different action, we recommend that the Legislature consider what it hopes to accomplish first: (1) increasing grant levels by an across‑the‑board amount, or (2) beginning to increase grant levels for each AU size by varying amounts in an attempt to get all AUs to the same percentage of the FPL. The former would distribute grant increases equally across AU sizes. The latter, which would also increase grant levels, would distribute these grant increases differently across AU sizes. After considering what it hopes to accomplish first, we recommend that the Legislature then determine how quickly it hopes to reach its final target. Doing so sooner would require a higher amount of spending in the near‑term, whereas taking longer to reach the final target would allow for a more gradual increase in spending on CalWORKs grants. Below, we discuss how the Legislature might assess the Governor’s proposal depending on what it hopes to accomplish first and how quickly it hopes to reach its final target.
- Legislature Could Prioritize an Across‑the‑Board Grant Increase First. Because the Legislature’s ultimate goal for CalWORKs grant levels requires more than a 13.1 percent increase for all AU sizes, one option to consider is adopting the Governor’s proposal for 2019‑20 and, in subsequent years, providing other increases to reach the Legislature’s ultimate goal. This would be consistent with recent actions—for example, the Legislature took this approach when it enacted the first step of its multiyear plan, a 10 percent across‑the‑board grant increase included in the 2018‑19 budget package. If the Legislature takes this approach, the grant increases that are provided in later years will have to be of varying percentages rather than across‑the‑board. This is because grants for the smallest and the largest AUs have further to go than other AU sizes to reach the Legislature’s final goal of all grant levels being at 50 percent of the FPL for a family that is one person larger than the AU.
- Legislature Could Instead Prioritize Linking Grant Levels to the FPL First. Alternatively, the Legislature could first prioritize increasing grant levels for each AU by varying amounts—effectively bringing grants for all AUs to the same level of the FPL, as it proposed to do in its multiyear plan. Under this approach, grant levels for the smallest and largest AU sizes would increase by more, in percentage terms, than grant levels for AUs of two, three, and four. If the Legislature hopes to accomplish this first, it would have two options in approaching the Governor’s proposal. First, it could modify the Governor’s proposal of a 13.1 percent across‑the‑board increase and instead distribute the same funding amount (estimated to be $347 million over three‑quarters of 2019‑20) differently across the various AU sizes. Under this approach, larger percentage increases could be given to the smallest and largest AUs (those that are currently the furthest away from the Legislature’s goal), with more modest increases given to the AU sizes that are relatively closer to the Legislature’s ultimate goal. For example, under this approach, we estimate that the $347 million proposed by the Governor for 2019‑20 could be used to increase grant levels for all AU sizes to about 48 percent of the FPL. Alternatively, the Legislature could reject the Governor’s proposal and instead move ahead with the second step of its multiyear plan. This approach, which would distribute increases differently across AU sizes, would do so by increasing grants halfway to the Legislature’s final target of 50 percent of the FPL for a family size that is one person larger than the AU size. We estimate that this approach would require an additional $60 million above the Governor’s proposed amount in 2019‑20 and $230 million (full year) above the Governor’s proposal in 2020‑21.
Setting a Target for the CalWORKs Portion of the Safety Net Reserve
In 2018‑19, the Legislature created the Safety Net Reserve account and made an initial deposit of $200 million General Fund into the reserve. Funds in the Safety Net Reserve were to be available for two programs—CalWORKs and Medi‑Cal. These programs are counter‑cyclical—meaning program spending ramps up during economic downturns, as more people become eligible to receive benefits, and shrinks during periods of economic growth when the labor market is stronger. In the following section, we (1) provide a background on the Safety Net Reserve, (2) review how the Great Recession affected CalWORKs, in particular, and (3) simulate three recession scenarios to help the Legislature consider a target level for the CalWORKs portion of the Safety Net Reserve. Overall, we recommend that the Legislature consider its goals for the CalWORKs component of the Safety Net Reserve, set a target amount based on those goals, and assess the Governor’s proposed Safety Net Reserve deposit based on whether it is in‑line with the Legislature’s target. We describe and evaluate the Governor’s proposed structural changes to the Safety Net Reserve in the final section of this analysis.
Background on the Safety Net Reserve
2018‑19 Budget Created New Reserve for Two Social Safety Net Programs. In 2018‑19, the Legislature created the Safety Net Reserve. The reserve has two subaccounts—one for CalWORKs and one for Medi‑Cal. An initial deposit of $200 million General Fund was made into the CalWORKs subaccount. (No initial deposit was made into the Medi‑Cal subaccount.) Reserves were to be available to address cost increases in these programs that occur during a recession. The 2018‑19 budget also directed the administration to determine how to build additional reserves. Specifically, statute directs the Department of Finance to calculate CalWORKs and Medi‑Cal savings that occur when the caseloads in these programs decline, and to propose a plan to deposit part of those savings into the reserve.
Governor Proposes to Deposit $700 Million Into Safety Net Reserve. The 2019‑20 Governor’s Budget proposes to deposit $700 million General Fund into the Safety Net Reserve. In addition to the deposit, the Governor also proposes two structural changes to the Safety Net Reserve. We evaluate these proposals in the final section of this analysis.
State Has Two Major Budget Reserves. The state has two primary general purpose budget reserves: the Special Fund for Economic Uncertainties (SFEU) and the Budget Stabilization Account (BSA). The SFEU is the state’s discretionary budget reserve—that is, the Legislature at any time can appropriate SFEU funds for any purpose. The BSA is the state’s constitutional reserve, and the use of its funds is more restricted. The State Constitution sets specific rules regarding how and when the state must make deposits into, or may make withdrawals from, the BSA.
CalWORKs During the Great Recession
How Does a Recession Lead to Increased CalWORKs Costs? Before describing our estimates of the budgetary effects of the Great Recession on CalWORKs specifically, below we outline how an economic recession leads to increased CalWORKs expenditures.
- Economic Recessions Drive CalWORKs Caseloads Upward. During a recession, there is a slowdown of economic activity that leads to job losses and an increase in unemployment. The loss of earnings for some families may result in them becoming eligible for CalWORKs. (A family of three is currently eligible for CalWORKs if their household income is below $1,430 per month.) A portion of families who become eligible for the program will enroll in CalWORKs and begin receiving monthly cash assistance and job services.
- Higher CalWORKs Caseloads Lead to Increased Program Costs. Expenditure levels for most human services programs depend on the number of participants (caseload) and the average cost per participant (cost per case). As discussed above, caseload depends primarily on economic conditions. On the other hand, CalWORKs cost per case depends on the level of benefits and services the program offers. These benefit amounts are set in state law and do not adjust if caseload increases. As a result, if the state makes no policy changes, program and administration costs generally increase roughly in line with caseload.
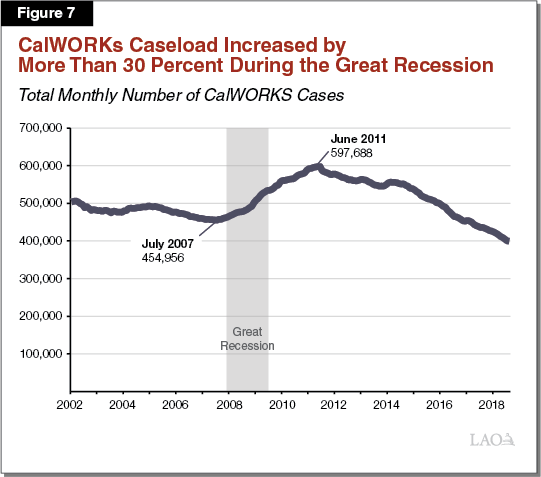
How Much Did CalWORKs Costs Increase as a Result of the Last Recession? Reviewing what happened in the last recession may help the Legislature consider its target reserve amount going forward. Given the severity of the Great Recession, estimates of the caseload increases during that period probably reflect the upper end of potential outcomes going forward. Figure 7 shows the monthly CalWORKs caseload over the last two decades, which began to increase in 2007, a few months before the beginning of the Great Recession. At that time, there were 455,000 families enrolled in the program and total costs were $4.7 billion. Over the next four years—between July 2007 and May 2011—the caseload increased by more than 30 percent. By then, nearly 600,000 families were receiving cash assistance and program costs had increased by $1 billion (to a total of $5.7 billion). These costs would have increased by a greater amount if the state had not enacted policy changes that had the effect of reducing costs within CalWORKs, as we discuss below.
Fiscal pressure in CalWORKs increased as a result of the recession. In this analysis, fiscal pressure is defined as the additional funding needed to operate CalWORKs at its current level of benefits and eligibility when the caseload is increasing. (CalWORKs fiscal pressure ultimately impacts the state’s General Fund. This is because federal TANF funds and county funds that are used to support CalWORKs and other programs’ costs are fixed or relatively flat from year‑to‑year. As such, large annual increases in CalWORKs program costs, such as those that occur during a recession, are borne by the General Fund.) We calculate that annual fiscal pressure in CalWORKs peaked at about $1.6 billion during the Great Recession. Specifically, actual total CalWORKs expenditures were $4.7 billion in 2006‑07 and we estimate that expenditures would have been $6.3 billion annually by 2010‑11 had the state taken no actions to reduce costs. Figure 8 shows the estimated annual fiscal pressure each year that occurred as a result of the recession. Fiscal pressure extends beyond the time period of the recession because the CalWORKs caseload remained elevated for several years following the end of the recession. From 2007‑08 to 2014‑15, the cumulative fiscal pressure in CalWORKs was over $9 billion. The figure also shows how the pressure was addressed—either by the increasing total spending in CalWORKs or by enacting program reductions. (We discuss these approaches below.)
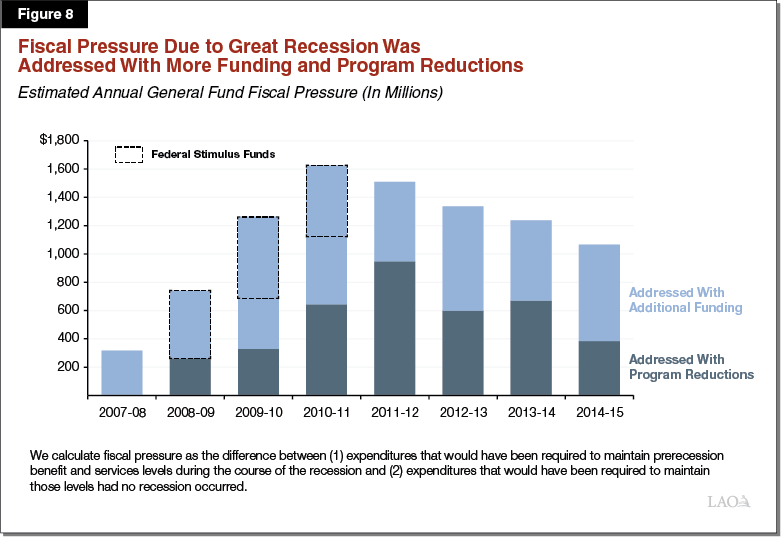
What Actions Did the State Take to Address Fiscal Pressure During the Recession? During the recession, the state enacted several program reductions, including lowering monthly grant levels, that had the effect of reducing CalWORKs expenditures. Despite these reductions (because of elevated caseloads), total CalWORKs expenditures increased during the recession. Overall, program reductions addressed almost one‑half of CalWORKs fiscal pressure in the recession. The state addressed the remaining fiscal pressure by increasing funding for the program. At the time, the state did not have a safety net reserve and had very little set aside in the state’s other general purpose reserve accounts.
The state was able to increase total funding for CalWORKs during the recession due, in part, to additional funding sources that became available during that time. First, the federal American Recovery and Reinvestment Act (ARRA) of 2009 provided roughly $500 million in additional TANF funds annually in 2008‑09, 2009‑10, and 2010‑11. Figure 8 highlights the portion of additional funding attributable to ARRA in those years. Second, voters approved Proposition 30 in 2012, which increased state revenue from the personal income tax and sales tax. These additional sources had the effect of limiting, at least to a degree, the magnitude of CalWORKs program reductions that were enacted during the Great Recession.
Ways to Build a Reserve
Looking ahead to the next recession, the Legislature has several options for building funds in the Safety Net Reserve. One way is to make one‑time discretionary deposits depending on the availability of funds. The Legislature followed this method when it deposited $200 million into the reserve as part of the 2018‑19 budget. The Governor as well follows this method in his proposal to deposit $700 million into the reserve in 2019‑20. Alternatively, the state could take a formula‑driven approach. Under this method, in years when the caseload declines, a portion of caseload savings that materialize due to this decline could be automatically set aside to be used in future years. Budget‑related legislation enacted along with the creation of the Safety Net Reserve directed the administration to put forward an option for this approach. The legislation tasked the administration with calculating annual caseload savings in CalWORKs and proposing a method to deposit some of those savings into the reserve. The administration has proposed to eliminate this requirement. Below, we evaluate how such a mechanism would have fared since the end of the Great Recession. In particular, we describe caseload savings and take a look at how much savings have materialized since the Great Recession ended.
What Are Caseload Savings? Caseload savings occur when the CalWORKs caseload declines from one year to the next. There are savings because fewer families receive benefits and thus program costs are lower relative to the year before. In some years with caseload savings, the state enacts policy changes—such as increasing the monthly grant amount—that increase the average cost per case. Caseload savings, in these instances, in effect help pay for higher benefits. In other years, caseload savings serve to benefit other areas of the state budget. For example, caseload savings have facilitated larger shifts of federal TANF funds to the Student Aid Commission to fund higher education financial aid grants. Such shifts have the effect of reducing the amount of General Fund used for these purposes, thus freeing up funds for other areas of the state budget.
What Amount of Caseload Savings Would Have Been Available to Be Deposited Into the Reserve? Figure 9 displays our estimate of the annual gross caseload savings that have occurred in CalWORKs since the caseload peaked in 2010‑11. The amount of caseload savings generally corresponds with the magnitude of the caseload decline—a greater decline leads to more caseload savings. Caseload savings that materialized during this period were used for various purposes, including restoring some program reductions that were enacted during the recession and offsetting General Fund costs for higher education financial aid.
Figure 9
Estimate of Recent Caseload Savings in CalWORKs
Total Funds (In Millions)
|
Fiscal Year |
CalWORKs Caseload |
Estimated |
|
|
Number |
Change From |
||
|
2011‑12 |
575,910 |
‑2% |
$105 |
|
2012‑13 |
559,871 |
‑3 |
147 |
|
2013‑14 |
550,859 |
‑2 |
88 |
|
2014‑15 |
535,029 |
‑3 |
152 |
|
2015‑16 |
495,554 |
‑7 |
400 |
|
2016‑17 |
454,046 |
‑8 |
461 |
|
2017‑18 |
423,121 |
‑7 |
354 |
|
2018‑19b |
391,161 |
‑8 |
378 |
|
2019‑20b |
371,316 |
‑5 |
244 |
|
aCalculated by estimating how much overall CalWORKs program costs would be reduced if no program or grant changes occurred from one year to the next. It represents an estimate of the effect that a declining caseload has on program costs. bAs estimated based on 2019‑20 Governor’s Budget caseload and expenditures. |
|||
Preparing for the Next Recession
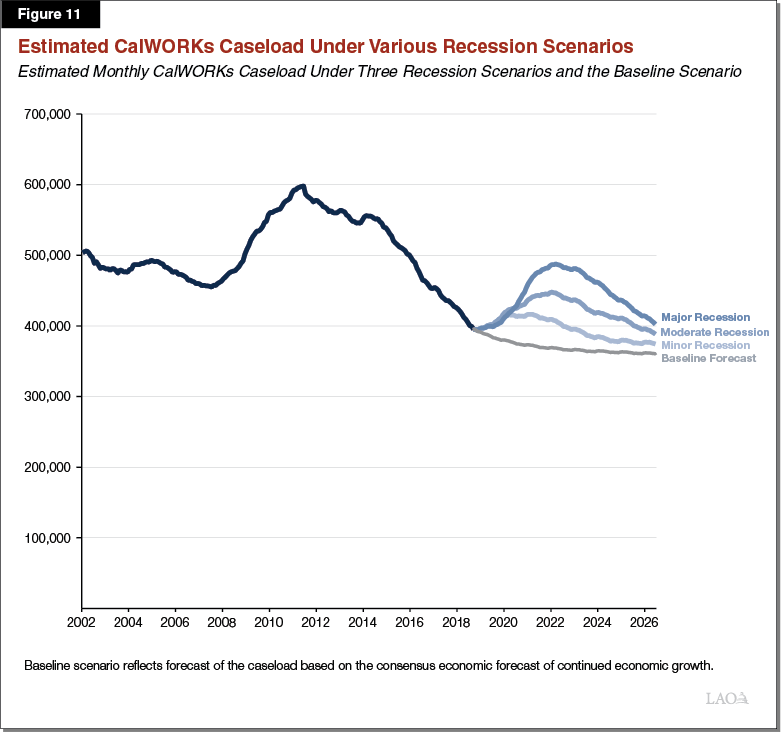
How Much Will CalWORKs Expenditures Increase During the Next Recession? We simulated three recession scenarios of varying degrees of severity to calculate how much CalWORKs expenditures might increase during the next recession. (For these scenarios, we assume current‑law grant levels—that is, grant levels as they will be following the 10 percent increase that is scheduled under current law to go into effect April 1, 2019.) We then compare each scenario to our baseline forecast, which assumes continued growth of the U.S. and California economies. Prior recessions inform our three scenarios. The minor recession scenario is similar to the 2001 dot‑com bust. The moderate recession scenario is similar to the early 1990s recession. And the major recession scenario is similar to the Great Recession. (Although the state often considers the dot‑com bust a more sizeable recession from a budgetary perspective, it was much smaller, and shorter, than these others in terms of its effects on unemployment and the broader economy.) Figure 10 shows the results of this simulation over a seven‑year period. (We selected a seven‑year period, beginning in early 2019, in order to include the peak and subsequent decline under each recession scenario.) The caseload under our baseline forecast declines from about 390,000 cases in 2019 to about 360,000 cases by 2026. Caseloads increase above the baseline forecast under each recession scenario. As shown in Figure 11 , we estimate that the caseload would peak at about 490,000 in a major recession, 450,000 in a moderate recession, and about 420,000 in a minor recession. We note that these peaks in caseload are lower than what occurred in the prior recession because the caseload today has hit an historic low.
Figure 10
Key Details of Each Recession Scenario
Recessions Modeled 2019 Through 2026
|
Scenario |
Modeled After |
Duration of Elevated CalWORKs Caseload |
Peak Unemployment Rate |
Peak CalWORKs Caseload |
Unemployment Rate at End of Forecast |
|
Minor |
Dot‑com bust |
41 months |
6.2% |
417,000 |
4.2% |
|
Moderate |
1990s Recession |
72 months |
8.7 |
448,000 |
5.0 |
|
Major |
Great Recession |
86 months |
11.4 |
488,000 |
5.9 |
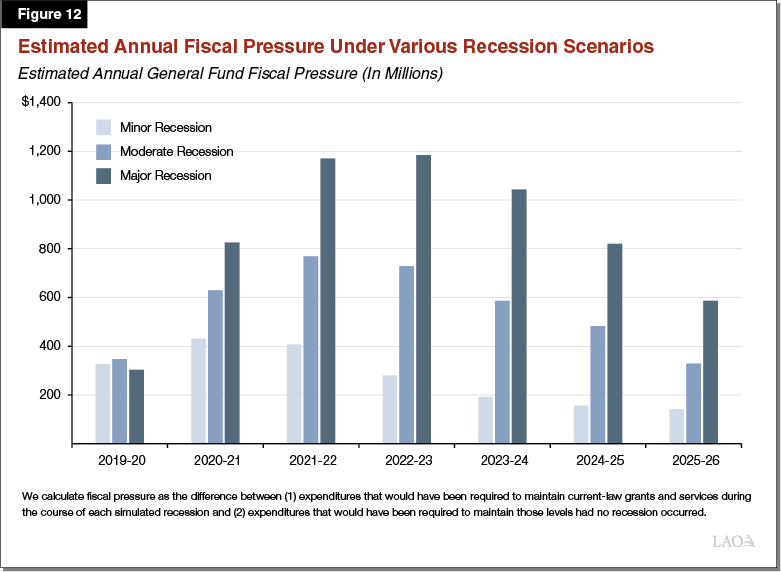
CalWORKs Fiscal Pressure Under Each Recession Scenario. Figure 12 displays estimated fiscal pressure that could occur under each of our scenarios. This represents the extra expenditures necessary to sustain current‑law grants and operations costs during a recession. Under the minor recession scenario, fiscal pressure peaks at about $400 million annually. Fiscal pressure is greater under the other scenarios—about $800 million annually in a moderate recession and $1.2 billion annually in a major recession.
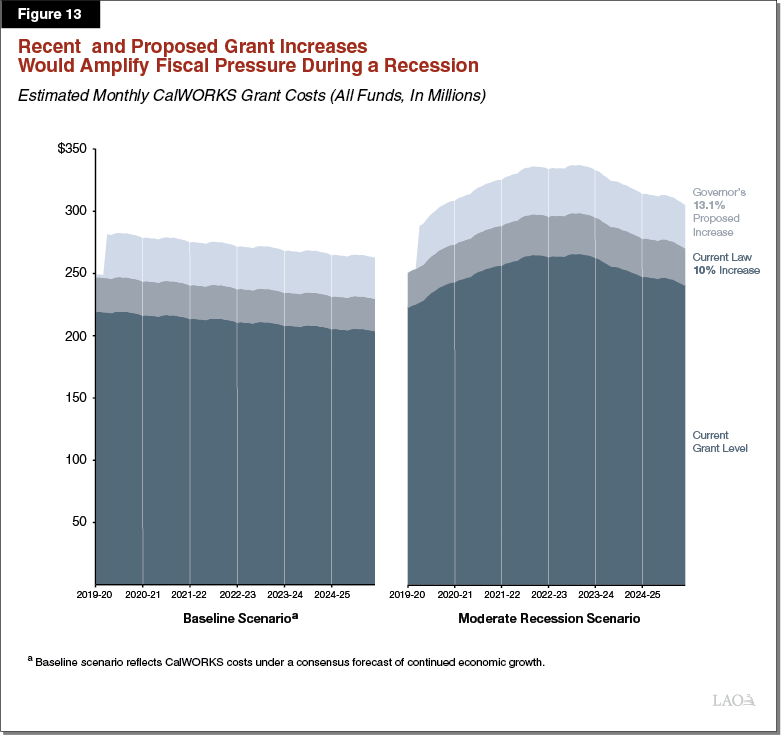
Recent and Proposed Grant Increases Would Amplify Fiscal Pressure in a Recession. The 2018‑19 Budget Act included a 10 percent across‑the‑board CalWORKs grant increase. The administration proposes to enact an additional 13.1 percent across‑the‑board increase in 2019‑20. Higher grant amounts will have the effect of amplifying the fiscal pressure in a recession. As a point of reference, the maximum grant for a family of three in 2017‑18 was $714 per month. Under the Governor’s proposal, this amount will increase to $888 per month (including the 10 percent grant increase enacted in 2018‑19). As such, each new case during the next recession would be associated with more fiscal pressure. Figure 13 illustrates this effect. It compares estimated additional expenditures due to recently approved and proposed grant increases under our baseline economic forecast (left side) and estimated expenditures under our moderate recession scenario (right side).
Setting a Target for the CalWORKs Component of the Safety Net Reserve
First, Identify an Approach for the Safety Net Reserve . . . In determining its goals for the CalWORKs component of the Safety Net Reserve, the first factor the Legislature should consider is the timing, size, and duration of the next recession for which it would like to prepare. No one can predict these factors with certainty ahead of time, but the Legislature could begin by identifying the magnitude of a recession it plans to prepare for and considering how cautious it would like to be. In general, being prepared for a larger recession will mean more reserves are needed. The second factor to consider is whether the Legislature plans to rely on the Safety Net Reserve for the entire duration of a recession. The Legislature could, for instance, identify as its reserve target a level that it anticipates will cover the first year or two of a recession. This would have the effect of delaying the need to take other actions to address fiscal pressure in CalWORKs. The third factor to consider is how willing the Legislature is to enact reductions in CalWORKs or take other actions to increase funding to CalWORKs, as it did during the Great Recession in response to the fiscal pressure at that time. If the Legislature is more willing to take these actions, less reserves are needed. If the Legislature would prefer to use reserves to address most or all of the fiscal pressure, then more reserves would be needed. The fourth factor to consider is whether other reserve funds, including from the SFEU or the BSA, would be available to be used to address fiscal pressure in CalWORKs during a recession. Finally, the Legislature may wish to consider whether additional federal funds will be made available during the next recession, as they were with ARRA in 2009, or whether the state will need to weather a recession on its own. Going forward, we think that the Legislature should not rely heavily on receiving the extraordinary federal aid as it did with ARRA, in future recessions.
. . . And Then Set a Target That Fits That Approach. After forming its approach to the reserve, we next encourage the Legislature to select a target that fits that approach. Our simulation suggests that if a minor recession were to begin in 2018‑19, cumulative CalWORKs costs over the next seven years could increase by $2 billion. Similarly, we estimate that costs would increase by nearly $4 billion in a moderate recession and by about $6 billion in a major recession. (These estimates do not include the additional costs that would be associated with the Governor’s proposed 13.1 percent grant increase.) If, for example, the Legislature chooses as its approach to use the Safety Net Reserve to address all fiscal pressure in a minor recession, we recommend a reserve target of at least $2 billion (for CalWORKs alone). If the Legislature wishes to prepare for a major recession using this approach, a much larger reserve would be necessary. As discussed above, if the Legislature intends for the reserve to be available for a shorter duration, such as the first two years of a recession, fewer reserves would be necessary under each of the recession scenarios. Alternatively, if the Legislature is willing to enact some reductions and/or rely on other funds or reserves, it could set a lower target. This is because the state would rely on the Safety Net Reserve for only part of the overall shortfall.
Assess the Governor’s Proposed Reserve Deposit Based on Legislature’s Target. Once the Legislature sets its desired target, we encourage evaluating the Governor’s proposal as it compares to that target. If the Legislature would like to prepare for a minor recession, the Governor’s proposed reserve deposit (which would build the reserve to $900 million) may be adequate to address CalWORKs costs during a minor recession if the Legislature is willing to enact some reductions and shift funds from other areas or from other reserves. On the other hand, the proposed reserve amount would likely not cover more than one‑quarter of the fiscal pressure in a moderate recession or one‑sixth of the fiscal pressure in a major recession. We note, however, that the Legislature may not need to reach its target reserve amount this year. An additional deposit could be made next year. We nevertheless urge the Legislature to achieve its target amount for the reserve sooner, rather than later. The surplus available under the Governor’s budget is extraordinary. Consequently, this year provides a unique opportunity to build reserves to prepare for a future recession.
Evaluating Proposed Structural Changes to the Safety Net Reserve
The 2019‑20 Governor’s Budget proposes two structural changes to the Safety Net Reserve. First, the Governor proposes to change the statutory parameters for the reserve to allow the state to use the total amount of reserve funds for either CalWORKs or Medi‑Cal. The 2018‑19 budget package established separate subaccounts for CalWORKs and Medi‑Cal within the Safety Net Reserve. Secondly, the proposal would eliminate the current‑law requirement that the administration establish a methodology for calculating savings that occur in CalWORKs and Medi‑Cal when the caseload declines and depositing some portion of those savings each year into the reserve.
Should CalWORKs and Medi‑Cal Have Separate Reserve Subaccounts? As discussed above, the Governor proposes to eliminate the CalWORKs and Medi‑Cal subaccounts within the Safety Net Reserve, in effect creating one reserve account to be used for both programs. The Legislature may wish to consider the trade‑offs between separate and combined accounts. On the one hand, separate accounts for these two programs may allow the Legislature to signal its priority for the use of reserve funds in one program or the other. Additionally, separate reserve subaccounts may make it easier to set target reserve amounts for each program, independently, and assess the Legislature’s progress in meeting those targets. On the other hand, combined subaccounts for Medi‑Cal and CalWORKs might provide some added flexibility in responding to a downturn. We would note, however, that combining the subaccounts may not practically increase the Legislature’s budgetary flexibility. This is because the state could enact statutory changes at any time to allow funds from one subaccount to be transferred to the other subaccount (or, for that matter, elsewhere in the budget).
Should Caseload Savings Be Deposited Automatically Into the Safety Net Reserve? In addition to combining the subaccounts within the Safety Net Reserve, the Governor proposes to eliminate the requirement that the Department of Finance calculate annual caseload savings and propose a way to automatically deposit some of the Medi‑Cal and CalWORKs caseload savings each year. We acknowledge that the proposed deposit of $700 million strengthens the reserve in the near term. As a result, automatic deposits may be less important in the near term than if the reserve were smaller. Even so, the Legislature should look beyond the next recession to consider what system it wants in place when the caseload begins to decline next time. As discussed earlier, a larger CalWORKs component of the reserve would exist today if a portion of recent caseload savings had been deposited each year since the end of the Great Recession. (Of course, these funds would not have been available for other uses.) The Legislature may wish to consider whether the proposal to eliminate the method to count and deposit caseload savings makes it less likely that the state builds sufficient reserves in the future.
In the case of CalWORKs, as an alternative to an automatic deposit, we recommend that the Legislature direct the administration to calculate and publish the amount of caseload savings that it expects to materialize each year. The administration would publish this forecast when it releases the Governor’s Budget and the May Revision. Under this alternative, the Legislature and the administration would know how much funding had been freed‑up for other uses. Then, they could decide whether some of that amount should be deposited into the reserve. Making this forecast more prominent could help ensure that the Legislature and the Governor consider a deposit each year during the budget process. In our view, highlighting the expected caseload savings will further the Legislature’s goal to focus on reserve deposits when the caseload is declining. It would also allow the state to deposit more or less than what would occur under an automatic, formula‑driven, deposit.
In‑Home Supportive Services
Background
Overview of the In‑Home Supportive Services (IHSS) Program. The IHSS program provides personal care and domestic services to low‑income individuals to help them remain safely in their own homes and communities. In order to qualify for IHSS, a recipient must be aged, blind, or disabled and in most cases have income below the level necessary to qualify for the SSI/SSP cash assistance program (for example, about $930 a month for an aged and/or disabled individual living independently in 2018‑19). IHSS recipients are eligible to receive up to 283 hours per month of assistance with tasks such as bathing, dressing, housework, and meal preparation. Social workers employed by county welfare departments conduct an in‑home IHSS assessment of an individual’s needs in order to determine the amount and type of service hours to be provided. In most cases, the recipient is responsible for hiring and supervising a paid IHSS provider—oftentimes a family member or relative. The average number of service hours that will be provided to IHSS recipients is projected to be 110 hours per month in 2019‑20.
IHSS Receives Federal Funds as a Medi‑Cal Benefit. The IHSS program is predominately delivered as a benefit of the state federal Medicaid health services program for low‑income populations (known as Medi‑Cal in California). As a result, IHSS is subject to federal Medicaid rules, including the federal reimbursement rate of 50 percent of costs for most Medi‑Cal recipients. Additionally, about 40 percent of IHSS recipients, based on their assessed level of need, qualify for an enhanced federal reimbursement rate of 56 percent, referred to as the Community First Choice Option. As a result, the effective federal reimbursement rate for IHSS is about 54 percent. The remaining IHSS costs are paid for by counties and the state.
Counties’ Share of IHSS Costs Is Set in Statute. Historically, counties paid 35 percent of the nonfederal—state and county—share of IHSS service costs and 30 percent of the nonfederal share of IHSS administrative costs. However, beginning in 2012‑13, the historical county share of cost model was replaced with an IHSS county MOE, meaning county costs would reflect a set amount of nonfederal IHSS costs as opposed to a certain percent of nonfederal IHSS costs. The 2019‑20 Governor’s Budget proposes to further modify the IHSS county MOE. (We discuss in more detail the evolution of the IHSS county MOE and proposed 2019‑20 changes later in this section.)
Budget Overview and LAO Assessment
The Governor’s budget proposes a total of $12.7 billion (all funds) for IHSS in 2019‑20, which is about $1.3 billion (11.1 percent) above estimated expenditures in 2018‑19. The budget includes about $4.3 billion from the General Fund for support of the IHSS program in 2019‑20. This is a net increase of about $565 million (15.2 percent) above estimated General Fund costs in 2018‑19. The year‑over‑year net increase in IHSS General Fund expenditures is primarily due to caseload growth, increased state minimum wage costs, and the shifting of some county costs to the state. Below, we discuss some of the main components of the Governor’s budget for IHSS and note any issues with them.
Primary Drivers of Increased Costs in IHSS
Caseload growth, a rising number of paid hours per case, and wage increases for IHSS providers are key drivers of increasing IHSS costs. Below, we describe these trends and how these cost drivers affect the Governor’s 2019‑20 budget proposal for IHSS.
Increasing Caseload. The average monthly caseload for IHSS has increased by 25 percent over the past ten years, from about 430,000 in 2008‑09 to an estimated 540,000 in 2018‑19. The IHSS caseload has historically fluctuated, increasing at most by 7.4 percent in 2008‑09 and decreasing by 4 percent in 2013‑14. More recently, average year‑to‑year IHSS caseload growth has remained at 5 percent and is expected to continue growing at a similar rate in 2019‑20. Specifically, the 2019‑20 budget projects that IHSS caseload will increase to 564,000 in 2019‑20—4.5 percent above 2018‑19 caseload estimates. The reasons for the steady caseload growth in recent years are not completely understood, but could be related to the growth in California’s senior population (adults aged 65 and older). We have reviewed the caseload projections in light of actual caseload data available to date and do not recommend any adjustments at this time.
Increasing Paid Hours Per Case. Over the past ten years, the average amount of paid monthly hours per case for IHSS has increased by 26 percent, from about 86 hours in 2008‑09 to an estimated 109 hours in 2018‑19. Between 2008‑09 and 2012‑13, average paid hours per case remained relatively flat—at around 86 hours. However, between 2013‑14 and 2017‑18, average paid hours per case has increased annually by an average of 4.8 percent.
The growth in average paid hours per case reflects, in part, a series of policy changes. For example, one reason for the recent increase in paid hours per case includes the implementation of the federal requirement that IHSS providers be compensated for previously unpaid work tasks, such as time spent waiting during their recipient’s medical appointments. Additionally, similar to the increase in the caseload, as the IHSS population ages there may be an increasing number of more complex IHSS cases that typically require more service hours. For example, as recipients live longer, they may develop more severe needs and require an increasing amount of IHSS service hours.
The Governor’s budget estimates that the average hours per case will be roughly the same in 2018‑19 as they were in 2017‑18 (109 hours) and will then increase slightly to 110 hours in 2019‑20. We have reviewed the estimates of average hours per case in light of actual hours per case data available to date. While we do not raise any major concerns at this time, based on recent growth trends in hours per case, it is likely that average hours per case in 2018‑19 would be higher than (as opposed to remain the same as) actual 2017‑18 average hours per case. To the extent that, similar to the prior years, the average hours per case grow in 2018‑19 and 2019‑20 (about 2 percent annually), the combined General Fund costs for IHSS in 2018‑19 and 2019‑20 could be roughly $200 million higher than estimated in the Governor’s budget.
State and Local Wage Increases. In addition to increasing caseload and paid hours per case, provider wage increases at the county and state levels have contributed to increasing IHSS costs. Since 2008‑09, the average hourly wage for IHSS providers increased by 25 percent, from $9.58 to an estimated $11.96 in 2018‑19. (We note that this average IHSS wage reflects the base hourly wages for IHSS providers averaged across all counties.) IHSS provider wages generally increase in two ways—(1) increases that are collectively bargained or established at the local level and (2) increases that are in response to state minimum wage increases. The Governor’s budget includes $408 million General Fund ($894 million total funds) for the combined impact of the recent state minimum wage increases on IHSS provider wages from $11 per hour to $12 per hour on January 1, 2019 and the scheduled increase from $12 per hour to $13 per hour on January 1, 2020. The General Fund costs associated with state minimum wage increases in 2019‑20 are more than double the estimated 2018‑19 costs. This is primarily due to the fact that a greater number of counties are expected to be impacted by the state minimum wage increase to $13 per hour in 2020 (50 counties) than the increase to $12 per hour in 2019 (44 counties) or the increase to $11 per hour in 2018 (37 counties). (A county is impacted by the state minimum wage increase when the current local wage is below the new state minimum wage level.) We note that in future years, as the state minimum wage continues to increase, more counties will be impacted, resulting in higher IHSS costs.
We note that the Governor’s budget does not take into account locally established wage increases that were negotiated after October 2018. These include scheduled locally established wage increases for Los Angeles County IHSS providers in 2018‑19 and 2019‑20—$12 to $12.60 effective January 1, 2019 and $12.60 to $12.80 effective July 1, 2019 (pending state approval). We estimate that the combined annualized costs of the Los Angeles County wage increases are approximately $70 million General Fund in 2019‑20. We expect that the Governor’s revised estimates released in May will account for these and other locally established wage increases that occurred after the development of the Governor’s budget, but are set to be in effect in 2018‑19 and 2019‑20.
Continues Restoration of IHSS Service Hours by 7 Percent
Since 2016‑17, the state has imposed a tax on managed care organizations (MCOs) that—when combined with a package of associated tax changes—generates a net General Fund benefit of about $1.5 billion by drawing additional federal funds for the state. Under current law, the General Fund has supported the restoration of IHSS service hours, which were previously reduced by 7 percent, so long as the MCO tax is in place. (Additional information on the MCO tax can be found in our report, The 2019‑20 Budget: Analysis of the Medi‑Cal Budget.) While the Governor’s budget does not assume the renewal of the MCO tax once it expires at the end of 2018‑19, it does propose the continued use of General Fund for the 7 percent restoration in 2019‑20. The cost of the 7 percent restoration is estimated to be $342.3 million General Fund in 2019‑20. While the administration is not proposing to eliminate the current statutory language that ties the 7 percent restoration to the existence of the MCO tax, we understand that it intends for the restoration of IHSS service hours to be ongoing. If the Legislature and the administration want to ensure funding for the 7 percent restoration in future years, they may wish to consider legislation that eliminates the link between the restoration and the MCO tax.
Implementation of Paid Sick Leave
Pursuant to Chapter 4 of 2016 (SB 3, Leno), IHSS providers became eligible to receive eight hours of paid sick leave beginning in 2018‑19. The number of paid sick hours is scheduled to increase to 16 hours annually on January 1, 2020 (or when state minimum wage reaches $13 per hour) and ultimately to 24 hours annually on July 1, 2022 (or when state minimum wage reaches $15 per hour). In general, providers must first work a certain number of hours to be eligible to receive and use their paid sick leave hours. The 2019‑20 budget includes about $30 million General Fund for paid sick leave costs—roughly equal to the estimated costs in 2018‑19. The budget assumes that in 2018‑19 and 2019‑20, all IHSS providers—509,289 in 2018‑19 and 534,623 in 2019‑20—will each claim eight hours of paid sick leave.
While we do not raise any major concerns at this time, paid sick leave costs could come in lower or higher depending on the actual number of IHSS providers who use paid sick leave and the amount of paid sick leave hours that they use. This is for a number of reasons. First, 2018‑19 utilization data (September 2018 to December 2018) shows that, so far, about 7,000 IHSS providers (less than 2 percent) each claimed and were paid for about seven of the eight hours of paid sick leave they were eligible to receive. To the extent that this trend continues and fewer than estimated IHSS providers utilize paid sick leave in 2019‑20, General Fund costs would be significantly less than estimated. Second, while the number of paid sick leave hours a provider can claim is expected to double to 16 hours in 2019‑20, the budget assumes that all IHSS providers will claim eight hours of paid sick leave in 2018‑19 and 2019‑20. We note that General Fund costs would be higher if at least some providers claim and get paid for more than eight hours of paid sick leave in 2019‑20. Given the very limited availability of utilization data, we find these budget assumptions reasonable at this time. These estimates, however, should be revised in May when a greater amount of data is available to better reflect actual utilization and paid hours of paid sick leave. We will continue to monitor paid sick leave utilization data relative to current budget assumptions and provide further comments at the time of the May Revision if necessary.
Proposed Changes to the IHSS County MOE
Historically, counties paid 35 percent of the nonfederal—state and county—share of IHSS service costs and 30 percent of the nonfederal share of IHSS administrative costs. Under this historical share‑of‑cost model, counties had a share of costs for all IHSS costs, meaning when total IHSS costs increased (or decreased) county costs would also increase (or decrease) proportionately. However, beginning in 2012‑13, the historical county share of cost model was replaced with an IHSS county MOE. Under an MOE model, counties are responsible for a set amount of IHSS costs, which does not change as a result of changes to total IHSS costs. In 2017‑18, the initial IHSS MOE was eliminated and replaced with a new IHSS MOE. The Governor’s budget proposes additional changes to the IHSS MOE financing structure in 2019‑20. Below, we discuss the recent and proposed changes to the IHSS MOE financing structure.
New IHSS County MOE Established in 2017‑18. In 2017‑18, the initial IHSS MOE was eliminated and replaced with a new county MOE financing structure—referred to as the 2017 IHSS MOE. Under the 2017 IHSS MOE, the counties’ share of IHSS costs was reset to roughly reflect the counties’ share of estimated 2017‑18 IHSS costs based on historical county cost‑sharing levels (35 percent of the nonfederal share of IHSS service costs and 30 percent of the nonfederal share of IHSS administrative costs). Similar to the initial IHSS MOE, the 2017 IHSS MOE increased annually by (1) counties’ share of costs from locally established wage increases, and (2) an adjustment factor (which, depending on certain circumstances, could be 5 percent or 7 percent).
Department of Finance (DOF) Report Finds That 1991 Realignment Revenues No Longer Cover IHSS County MOE Costs Over Time. When the 2017 IHSS MOE was implemented, there was concern that county revenues made available through 1991 realignment—the revenue source used to pay for IHSS county costs—would no longer be able to fully cover the IHSS county costs associated with the new MOE. As a result, current law provides some General Fund assistance to counties to mitigate the cost of the 2017 IHSS MOE. Additionally, the 2017‑18 budget agreement required DOF to review and report on the funding structure of 1991 realignment, how revenues and costs are growing, and the ability of available revenues to meet program costs of the realigned programs. In its January 2019 report, Senate Bill 90: 1991 Realignment Report, DOF found that 1991 realignment could no longer support county costs of IHSS primarily because of programmatic changes that have made IHSS more costly over time. In our report, Reevaluating the 1991 Realignment (October 2018), we reached a similar conclusion. In response to the findings of its report, as part of the 2019‑20 budget, the administration included a proposal to make significant changes to 1991 realignment. We focus here on some of the major proposed changes impacting IHSS, but will be publishing a report that analyzes the administration’s proposal more comprehensively in the coming weeks.
Governor’s Budget Reduces IHSS County MOE Costs to Match 1991 Realignment Revenue Levels, Shifting Costs to the General Fund. As a result of DOF’s 1991 realignment report, the budget proposes to eliminate the General Fund assistance counties were receiving to assist them in covering IHSS costs associated with the 2017 IHSS MOE and instead reduces the IHSS county MOE itself—thereby reducing county IHSS costs. Specifically, proposed changes to the IHSS MOE include (1) reducing the 2019‑20 IHSS MOE from $2 billion to $1.56 billion and (2) reducing the annual adjustment to the IHSS MOE from as high as 7 percent down to 4 percent. Overall, as a result of these changes, the administration estimates that, on net, $242 million of county costs will be shifted to the state in 2019‑20, increasing to $547 million in 2022‑23. (We note that the budget proposes additional changes to the county share of cost for locally established IHSS wage and benefit increases beginning when state minimum wage reaches $15 per hour and how certain funds for social services and health programs are allocated within 1991 realignment. These changes will be discussed in detail in our larger evaluation of realignment‑related proposals that will be released in the coming weeks.)
It is our understanding that the administration lowered the IHSS county MOE costs to an amount that it estimated 1991 realignment revenues could cover in 2019‑20. The administration will revise the new IHSS county MOE base for 2019‑20 in May based on updated estimates of realignment revenues. To the extent that 1991 realignment revenues used to cover IHSS county costs come in lower (or higher) than initial budget estimates, a greater (or lower) amount of IHSS county MOE costs would be shifted to the General Fund. We are still analyzing the details of the administration’s proposed changes to 1991 realignment and will release more detailed comments in the coming weeks.
New IHSS Administrative Funding Methodology. In addition to lowering the IHSS county MOE for counties, the 2019‑20 budget includes a new methodology for funding IHSS administrative costs. Specifically, the Governor is proposing to use the General Fund to fully cover the budgeted nonfederal (state and county) share of IHSS administrative costs—effectively eliminating the county share of costs for administration that had existed historically. The budget includes about $383 million General Fund ($781 million total funds) for IHSS administrative costs in 2019‑20. The amount of General Fund counties receive to pay for IHSS administrative costs will increase year‑to‑year by the rate of growth in the IHSS caseload. The administration will adjust this funding mid‑year if actual caseload growth is higher than estimated, but not if growth in caseload is lower. To the extent that counties increase administrative funding for IHSS beyond what the allocation provides, counties will need to pay for those costs in addition to their overall MOE obligation. Overall, this methodology increases the predictability of funding for IHSS administration for both the state and counties.
SSI/SSP
The SSI/SSP program provides cash grants to low‑income aged, blind, and disabled individuals. The state’s General Fund provides the SSP portion of the grant while federal funds pay for the SSI portion of the grant. Total spending for SSI/SSP grants is estimated to increase by about $125 million—or 1.3 percent—from an estimated $9.8 billion in 2018‑19 to $9.9 billion in 2019‑20. This is primarily due to increased federal expenditures as a result of the estimated increase to the federal SSI grant levels in 2019‑20. Of this total, the Governor’s budget proposes about $2.8 billion from the General Fund, an amount relatively equal to revised estimates of 2018‑19 expenditures.
Caseload Slightly Decreasing. The SSI/SSP caseload grew at a rate of less than 1 percent each year between 2011‑12 and 2014‑15. More recently, however, SSI/SSP caseload has slightly decreased—by 1.2 percent in 2016‑17, 1.5 percent in 2017‑18, and an estimated 1.5 percent in 2018‑19. The budget projects that caseload will be about 1.2 million individual and couple SSI/SSP recipients in 2019‑20, a decrease of 1.2 percent below estimated 2018‑19 caseload levels.
Background on SSI/SSP Grants
Both the State and Federal Government Contribute to SSI/SSP Grants. Grant levels for SSI/SSP are determined by both the federal government and the state. The federal government, which funds the SSI portion of the grant, is statutorily required to provide an annual cost‑of‑living‑adjustment (COLA) each January. This COLA increases the SSI portion of the grant by the Consumer Price Index for Urban Wage Earners and Clerical Workers (CPI‑W). In years that the CPI‑W is negative (as was the case in 2010, 2011, and 2016), the federal government does not decrease SSI grants, but instead holds them flat. The state has full discretion over whether and how to provide increases to the SSP portion of the grant. Until 2011, the state had a statutory COLA. Although this statutory COLA existed, there were many years when, due to budget constraints, the COLA was not provided. As part of the 2016‑17 budget package, the Legislature provided a COLA of 2.76 percent on the SSP portion of the grant, the first since 2005. The Governor’s 2019‑20 budget proposal does not include an increase to the SSP portion of the grant. (We note that the 2018‑19 budget included language on providing future annual COLAs to SSP grant levels beginning in 2022‑23, to the extent that funding is provided in future budget years.)
During Constrained Budget Environment, SSP Grants for Individuals and Couples Reduced to Federally Required Minimum. The state is required to maintain SSP monthly grant levels at or above the levels in place in March 1983 ($156.40 for SSP individual grants and $396.20 for SSP couple grants) in order to receive federal Medicaid funding. During the most recent recession, the state incrementally decreased SSP grants for individuals and couples until they reached these minimum levels in June 2011 and November 2009, respectively. Beginning January 1, 2017, SSP grants for individuals and couples slightly increased above the minimum level due to the COLA on the state’s SSP portion.
Total Grants Have Been Gradually Increasing Largely Due to Federal COLAs, but Remain Below FPL for Individuals. As shown in Figure 14, the maximum SSI/SSP monthly grant amount for individuals (the bulk of the SSI/SSP caseload) and couples have been increasing gradually since 2011‑12—predominantly due to the provision of federal COLAs. However, despite these increases, current maximum SSI/SSP grant levels for individuals remain below the FPL, while grant levels for couples remain just above the FPL. We note that during some difficult budget times prior to 2011‑12, the state negated the impact of federal COLAs by reducing the SSP portion of the grant by the amount of the federal increase, thereby holding total SSI/SSP grant levels flat. After the state reduced SSP grants to the federally required minimum levels, the state could no longer do this.
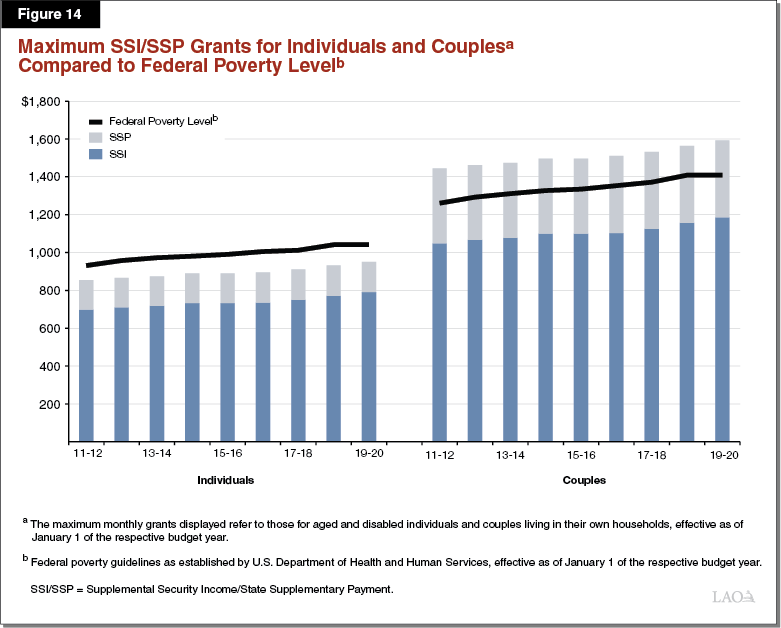
Governor’s Budget Estimates and Proposals
Federal SSI Grant Increase. As shown in Figure 15, the Governor’s budget estimates that the CPI‑W that the federal government will use to adjust the SSI portion of the grant in 2020 will be 2.5 percent, increasing the maximum monthly SSI/SSP grant by $19 for individuals and $29 for couples. This is roughly the same as our estimate of the CPI‑W (2.4 percent). (The actual CPI‑W will not be known until the fall.)
Figure 15
SSI/SSP Monthly Maximum Grant Levelsa Governor’s Proposal
|
2018‑19 |
2019‑20 |
Change |
|
|
Maximum Grant—Individuals |
|||
|
SSI |
$771.00 |
$790.00 |
$19.00 |
|
SSP |
160.72 |
160.72 |
— |
|
Totals |
$931.72 |
$950.72 |
$19.00 |
|
Percent of Federal Poverty Levelc |
90% |
91% |
|
|
Maximum Grant—Couples |
|||
|
SSI |
$1,157.00 |
$1,186.00 |
$29.00 |
|
SSP |
407.14 |
407.14 |
— |
|
Totals |
$1,564.14 |
$1,593.14 |
$29.00 |
|
Percent of Federal Poverty Levelc |
111% |
113% |
|
|
aThe maximum monthly grants displayed refer to those for aged and disabled individuals and couples living in their own households, effective as of January 1 of the respective budget year. bReflects Governor’s budget estimate of the January 2020 federal cost‑of‑living adjustment for the SSI portion of the grant. cCompares grant level to federal poverty guidelines from the U.S. Department of Health and Human Services for 2019. |
|||
Ongoing Funding Proposed for Hold Harmless Programs for Households Negatively Affected by the Elimination of SSI Cash‑Out Policy. Under the SSI cash‑out policy (a state policy in place since 1974), SSI/SSP recipients received an extra $10 payment in lieu of their being eligible to receive federal food benefits (CalFresh benefits) in California. The 2018‑19 budget package included legislation to eliminate the SSI cash‑out policy—effectively making SSI/SSP recipients eligible for CalFresh benefits. Although ending the SSI cash‑out makes some households newly eligible for CalFresh benefits, this policy change also makes some households currently receiving CalFresh benefits either experience a decrease in food benefits or become ineligible for CalFresh. To address this, the 2018‑19 budget established hold harmless programs in the form of state‑funded food benefit programs for households currently receiving CalFresh benefits that would be negatively affected as a result of ending the SSI cash‑out. (We discuss the effects of ending the SSI cash‑out in more detail in our report January 2018 report, The Potential Effects of Ending the SSI Cash‑Out). Based on our conversations with the administration, the implementation date for the elimination of the SSI cash‑out, and the implementation of the hold harmless programs, is scheduled to be June 1, 2019.
The Governor’s budget includes $86.7 million General Fund to provide hold harmless benefits in 2019‑20, with the intent to provide funding for the hold harmless programs on an ongoing basis. Under current law, the hold harmless programs would remain operative so long as funding is appropriated in future budget years. It is our understanding that the administration believes that this statutory language is sufficient to allow for the continuation of the hold harmless programs indefinitely. The Legislature may want to ask the administration why it is not proposing statutory changes to clarify that the program is intended to be ongoing, and what the potential drawback of such statutory changes may be. Additionally, the Legislature may want to ask the administration (1) how it will monitor and evaluate whether implementation activities are on track, (2) what data and metrics it will collect to track the progress of implementation and detect unanticipated challenges (including any workload and resource challenges at the county level), (3) how it will address implementation challenges in a timely manner, and (4) how it will regularly communicate implementation challenges and successes with the Legislature. (We note that the administration is requesting additional limited‑term positions to address the workload associated with eliminating the SSI cash‑out and implementing hold harmless programs. Although we are still analyzing the details of the staffing proposal, given that eliminating the SSI cash‑out is expected to increase programmatic and administrative workload, we believe that it merits consideration.)
Ongoing Funding for Housing and Disability Income Advocacy Program. The Governor’s budget proposes a package of actions and funding augmentations aimed at alleviating homelessness. As a part of this package, the budget proposes the continuation of the pilot Housing and Disability Income Advocacy Program (HDAP), which began in 2017‑18. Under this program, counties assist homeless individuals with disabilities apply for disability benefit programs, including SSI/SSP, and find housing. Initially, the state provided $45 million General Fund in 2017‑18 on a one‑time basis—available to be spent over three years—to establish HDAP. The Governor’s budget provides $25 million in annual ongoing General Fund beginning in 2019‑20 to continue HDAP. Given that the initial funding for HDAP can be expended until the end of 2019‑20, total funding for HDAP in 2019‑20 will likely exceed $25 million. However, at this time, it is not known how much of the initial HDAP funding has been expended. Additionally, at this time, it is unclear how the additional funding will be allocated to counties and whether the program structure will remain exactly the same as the current HDAP pilot or whether the administration will modify program rules and county requirements. We provide additional comments and suggested questions for legislative consideration on the overall homelessness proposal, including the continuation of HDAP, in our brief, The 2019‑20 Budget: Considerations for the Governor’s Housing Plan.
Continuum of Care Reform
California’s child welfare system serves to protect the state’s children from abuse and neglect, often by providing temporary out‑of‑home placements for children who cannot safely remain in their home, and services to safely reunify children with their families. Beginning in 2012, the Legislature passed a series of legislation implementing the Continuum of Care Reform (CCR). This Legislative package—which includes Chapter 35 of 2012 (SB 1013, Committee on Budget and Fiscal Review), Chapter 773 of 2015 (AB 403, Stone), Chapter 612 of 2016 (AB 1997, Stone), Chapter 732 of 2017 (AB 404, Stone), Chapter 35 of 2018 (AB 1811, Committee on Budget), and Chapter 935 of 2018 (SB 1083, Mitchell)—makes fundamental changes to the way the state cares for children in the foster care system. CCR aims to increase the foster care system’s reliance on family‑like settings rather than institutional settings such as group homes. Additionally, CCR makes changes to ensure that the state’s foster children receive mental health and other supportive services regardless of their placement setting. The state pays for the net costs of CCR, which include significant upfront costs for implementation. While not a primary goal, CCR was enacted with the expectation that reforms would eventually lead to overall savings to the foster care system, resulting in CCR eventually becoming cost neutral to the state.
The Governor’s budget estimates 2018‑19 General Fund spending on CCR at $296 million. The 2019‑20 Governor’s Budget proposes $271 million from the General Fund to continue facilitating the implementation of CCR. Estimated CCR spending in 2018‑19 represents a significant increase over what was included in the 2018‑19 budget for CCR. This is because delayed implementation progress has resulted in delayed realization of savings anticipated from reforms. The year‑over‑year decrease in CCR costs between 2018‑19 and 2019‑20 is primarily due to the expiration of some temporary state funding. (For this section of the report, we restrict our CCR funding estimates and projections to what is provided for county child welfare and probation services, where most CCR spending is occurring. We therefore exclude from these estimates CCR spending on county mental health services and state operations.)
This analysis provides a brief overview of the existing foster care system, summarizes the major policy changes under CCR, provides a status update on CCR implementation to date, and assesses the Governor’s CCR budget proposal for 2019‑20 in light of the reform effort’s current successes and challenges.
Overview of the Child Welfare System
California’s child welfare system provides an array of services for children who have experienced, or are at risk of experiencing, abuse or neglect. These child welfare services (CWS) include responding to and investigating allegations of abuse and neglect, providing family preservation services to help families remain intact, removing children who cannot safely remain in their home, and providing temporary out‑of‑home placements until (1) the family can be successfully reunified or (2) an alternative permanent placement can be found. After family reunification, adoption and guardianship are the two most common permanent placement options.
Child Welfare Programs Are State Supervised, County‑Administered. DSS oversees CWS, while county welfare departments carry out day‑to‑day operations and services. DSS is responsible for statewide policy development and enforcing state and federal regulations. Counties have flexibility around the design of their operations and to some extent the range of services they provide. All counties investigate allegations of abuse, engage with families to help them remain intact, and provide foster care payments to foster caregivers and providers. Assisting the counties are several hundred private Foster Family Agencies (FFAs) and congregate care providers that administer services ranging from basic care and supervision to foster parent recruitment to mental health treatment. (We provide a basic overview of FFAs and congregate care—the latter of which is comprised of both group homes and CCR’s recently created “Short‑Term Residential Therapeutic Programs (STRTPs)”—in the sections that follow.)
The Role of County Probation Departments in the Child Welfare System. County probation departments carry out many of the same services provided by county welfare departments but for children who have been declared wards of the court through a delinquency hearing. Unlike the majority of children who enter the child welfare system, children in out‑of‑home care due to probation decisions have not necessarily been subject to abuse or neglect. Instead, probation departments often utilize foster care placements with the aim of rehabilitating the child following a criminal offense.
Foster Care Payments. A significant component of CWS is the making of per child per month payments to foster caregivers and providers to cover costs associated with the care, supervision, and service needs of a foster child. These are referred to as foster care payments. The state sets base‑level foster care payments that can vary from about $1,000 per month to over $13,000 per month depending on the type of placement setting a foster child is in as well as by other factors. (Later, we discuss the various foster care placement settings.) In addition to state‑mandated, base‑level foster care payments, most counties—at their own discretion and with flexible county funding—pay foster caregivers caring for children with high needs supplemental payments known as “specialized care increments (SCIs).” SCI levels vary from county to county, generally ranging from under $100 per child per month with slightly elevated needs to almost $1,800 per child per month for foster children with the highest needs. Counties design their own assessments to determine whether a foster child qualifies for an SCI and what the SCI level should be. As a result, there is great variance in the level of SCIs throughout the state.
CWS Funding
Total funding for CWS is projected to be $6.3 billion for 2019‑20. Below, we describe the major sources of this funding.
2011 Realignment Revenues Are a Major Source of CWS Funding. Until 2011‑12, the state General Fund and counties shared significant portions of the nonfederal costs of administering CWS. In 2011, the state enacted legislation known as 2011 realignment, which dedicated a portion of the state’s sales tax to counties to administer CWS. The 2019‑20 budget projects that more than $2.8 billion will be available from realignment revenues to fund CWS programs in 2019‑20.
As a result of Proposition 30 (2012), under 2011 realignment, counties are either not responsible or only partially responsible for CWS programmatic cost increases resulting from federal, state, and judicial policy changes. Proposition 30 protects counties by establishing that counties only need to implement new state policies that increase overall program costs to the extent that the state provides the funding. Counties are, however, responsible for all other increases in CWS costs—for example, those associated with rising caseloads. Conversely, if overall CWS costs fall, counties get to retain those savings. On the other hand, Proposition 30 also serves to protect the state by freeing it of the responsibility to reimburse counties for increasing costs of child welfare policies that were in place prior to 2011 realignment.
Federal Funding for CWS. Federal funding for CWS stems from several sources and is projected to be near $2.8 billion in 2019‑20.
State General Fund Supports Non‑Realigned Components of Child Welfare and State Oversight Functions. The 2019‑20 budget proposes around $546 million General Fund for county welfare and probation departments to implement components of the child welfare program that were not part of 2011 realignment. CCR implementation spending constitutes a significant portion of total General Fund spending on CWS. In addition to this $546 million, the General Fund supports the state’s CWS oversight function at DSS.
Types of Out‑of‑Home Placements
Counties have historically relied on four primary placement options for foster children—kinship care, foster family homes (FFHs), FFAs, and congregate care. (For this report, we refer to kinship care, FFHs, and FFAs as home‑based family care [HBFC].) In recent years, Supervised Independent Living Placements (SILPs) and transitional housing placements have become increasingly utilized as placement options for older foster youth.
As of October 2018, there were around 59,000 youth in foster care, including over 7,000 nonminors between the ages of 18 and 21 in extended foster care in California. Federal and state law mandate that children be placed in the least restrictive placement setting, which state law describes as a setting that promotes normal childhood experiences and the day‑to‑day needs of the child. Figure 16 shows the number of foster children in each of the above mentioned placement settings over time. The selected placement types vary in their level of restrictiveness, serve children with different though overlapping needs, provide different kinds of specialized services, and receive varying foster care payment rates from the state.
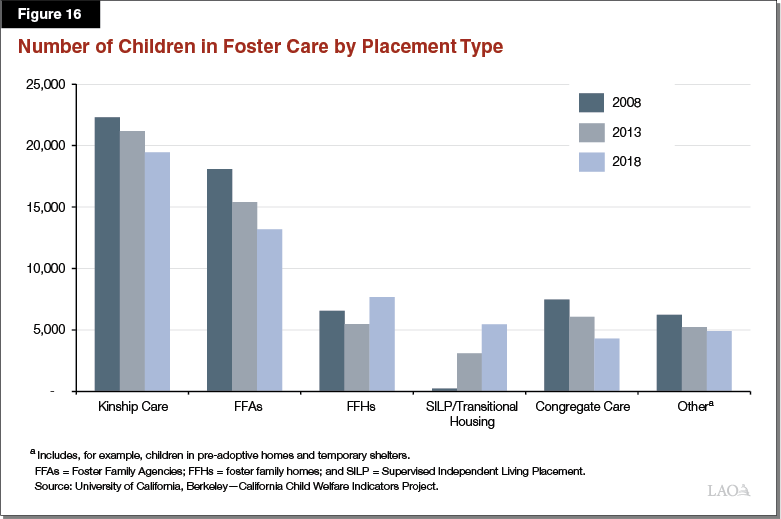
Kinship Care. Established child welfare policy and practice in the state prioritizes placement with a noncustodial parent or relative. Kinship care comprises care from relatives and nonrelative extended family members and is the state’s most utilized placement option at 33 percent of foster placements as of October 2018. Kinship care is a unique foster care placement type in multiple respects. For example, unlike other placement types, kin caregivers can take in foster children on an emergency basis before having been fully approved by counties as foster caregivers. Instead, kin caregivers only must meet basic health and safety standards before an emergency placement is made. Prior to March 30, 2018, kin caregivers were generally not eligible to receive full monthly foster care payments until they received full foster caregiver approval. Instead, they typically received the CalWORKs child‑only grant of almost $400 per month. Chapter 35 of 2018 (AB 1811, Committee on Budget) now provides relative caregivers with a child placed with them temporary grant funding at the base‑level rate while their applications are being processed.
FFHs. County‑licensed foster homes, known as FFHs, are often the preferred placement option when a suitable kin caregiver cannot be found and the child does not have needs requiring a higher level of services. Counties recruit FFH caregivers and provide basic social work services to the approximately 13 percent of foster children statewide residing in an FFH as of October 2018. In 2018‑19, FFH caregivers receive the same minimum foster care payment as kin caregivers of at least $960 per month for the care and supervision of each foster child in their home.
FFA Homes. FFAs do not directly house the children under their care. Instead, FFAs are private nonprofit agencies that recruit and approve foster caregivers, place children into FFA‑supervised foster homes, and provide supportive services to the children in their care, typically children with elevated needs compared to those placed in FFHs. Because they offer a relatively high level of services and often serve children with elevated needs, counties reimburse FFAs at a higher rate than either kin caregivers or FFHs. In 2018‑19, FFAs receive a minimum payment of $2,176 per month for each foster child under their supervision. Of this amount, $960 is passed directly onto the foster child’s caregiver, while the remaining amount funds the FFA’s administrative and supportive services activities. FFA‑supervised foster caregivers have not historically been eligible to receive county‑funded SCIs. Instead, FFA‑supervised foster caregivers historically received a fixed supplemental per child per month payment on top of the standard foster care payment mandated by the state for all HBFC placements. As of October 2018, 22 percent of the state’s foster children were placed through an FFA.
Congregate Care. Congregate care includes group homes and STRTPs, the latter of which are expected to eventually replace group homes under CCR as the permissible congregate care placement setting for CWS‑supervised foster children who need intensive services that are unavailable in an HBFC home. (We discuss the differences between group homes and STRTPs in the “Major Changes Under CCR” section of this analysis.) Operated as private, nonprofit agencies, group homes and STRTPs provide 24‑hour care, supervision, and services to foster children with the highest levels of need, often children whose significant emotional or behavioral challenges can make it difficult for them to successfully remain in home‑based family foster care settings. Professional staff, as opposed to a parent‑like foster caregiver, provide care and supervision to children in group homes and STRTPs. Group homes and STRTPs are considered the most restrictive, least family‑like foster care setting, and are generally the least preferred placement option. Group homes and STRTPs are compensated at significantly higher rates than the other placement types—in 2018‑19, ranging from just under $3,000 to about $13,000 per child per month. As of October 2018, approximately 5 percent of California’s foster children were living in group homes or STRTPs.
SILPs and Transitional Housing. In recent years, counties have increasingly relied upon SILPs and transitional housing placements instead of home‑based family placements and congregate care settings for older, relatively more self‑sufficient youth. SILPs are independent settings, such as apartments or shared residences, where nonminors who remain in the foster care system past their 18th birthday may live independently and continue to receive monthly foster care payments. Nonminor foster youth residing in SILPs receive a monthly foster care payment of $960. Transitional housing placements provide foster youth ages 16 to 21 supervised housing as well as supportive services, such as counseling and employment services, that are designed to help foster youth achieve independence. The monthly foster care payment rate for foster youth in transitional housing placements ranges between more than $2,500 to over $3,000. As of October 2018, 8 percent of all foster youth were residing in either SILPs or transitional housing.
Major Changes Under CCR
CCR aims to achieve a number of complementary goals including: (1) ending long‑term congregate care placements; (2) increasing reliance on home‑based family placements; (3) improving access to supportive services regardless of the kind of foster care placement a child is in; and (4) utilizing universal child and family assessments to improve placement, service, and payment rate decisions. In this section, we first highlight some of the key problems CCR is intended to address and then discuss some of the major changes underway as a result of CCR. Because CCR implementation is already underway, some of the deadlines and requirements included in the original legislation have been modified for various reasons—we include these changes in this section. (We note that the changes we highlight are not an exhaustive accounting of all CCR changes, but are those most relevant in understanding the Governor’s 2019‑20 budget proposal for CCR.)
Congregate Care Placements Are Costly and Associated With Poor Outcomes for Children. Congregate care placements can cost nearly $13,000 per child per month depending on the level of care provided. In contrast, foster care payments for home‑based family settings generally range from nearly $1,000 per child per month for relative and FFH placements to about $2,700 per child per month for FFA placements. (We note that some FFA placements for children who require intensive services can receive grant payments of almost $6,200.) Moreover, long‑term stays in congregate care are associated with elevated rates of reentry into foster care, lower educational achievement, and higher rates of involvement in the juvenile justice system. (We note that given the potentially higher needs of children placed in congregate care, it is difficult to determine whether congregate care placements themselves directly lead to these poor outcomes.) Recognizing the above shortcomings associated with congregate care, CCR aims to end long‑term congregate care placements.
Concerns About the Availability and Capacity of Home‑Based Family Placements. Reducing reliance on congregate care placements has been a priority for the state for some time. A major challenge to achieving this goal has been an inadequate supply of home‑based family placements which are capable of caring for children with elevated needs. Additionally, the mental health and other supportive services to help home‑based family caregivers care for children with elevated needs have not historically been readily accessible at all home‑based family placement types. Improving the capacity and availability of home‑based family placements is a principal goal under CCR.
CCR Created a New Placement Type
STRTPs Replace Group Homes for CWS‑Supervised Foster Children. CCR originally sought to end group homes as a placement option for CWS‑supervised foster children by the end of December 2018. In certain circumstances, recent legislation extended the deadline for some existing group homes to convert to STRTPs to the end of December 2019. (Probation departments may continue to utilize group home placements indefinitely.) CCR aims to encourage probation departments to make similar changes regarding their use of congregate care as child welfare departments. STRTPs are expected to replace group homes as the permissible placement setting for children who cannot safely and stably be placed in home‑based family settings, providing a similar level of supervision as group homes, but with expanded services and supports. In contrast to group homes sometimes serving as long‑term placements for children for whom home‑based family placements cannot be found, STRTPs are intended to exclusively provide short‑term, intensive treatment and other services to allow children to transition to a family setting as quickly and successfully as possible. CCR restricts STRTP placements to children who have been assessed as requiring the high level of behavioral and therapeutic services that STRTPs are required to provide. Children whose level of need may qualify them for STRTP placement include, among others, those assessed as having a serious mental illness and victims of commercial sexual exploitation. To ensure the ongoing appropriateness of all STRTP placements, resident children’s case plans are subject to review every six months by the director or deputy director of the supervising county child welfare or probation department. The case plans specify the reasons for the child’s placement, the expected duration of stay, and the transition plan for moving the child to a less restrictive environment. As a result of the shorter expected durations of stay in STRTPs, as well as the restrictions around which foster children may be placed in STRTPs compared to group homes, it is anticipated that statewide STRTP capacity (number of beds) will be lower than statewide group home placement capacity prior to CCR.
New CCR Foster Care Payment Rate Structure
CCR Foster Care Payment Rates to Generally Vary Based on Children’s Needs. Until January 2017, the state’s foster care payment rates primarily varied by age for children in HBFC. For example, a foster caregiver caring for a child below age 5 would receive a monthly foster care payment of around $700 while a foster caregiver caring for a child over age 14 would receive a monthly payment of around $900. Under the foster care payment rate structure being implemented under CCR, foster care payment rates vary by children’s level of need as determined by a statewide “level of care” (LOC) assessment tool, which we describe below. There are five payment rates under CCR’s “HBFC payment rate” structure, each with a corresponding LOC. LOC 1 represents the lowest level of care and corresponds with the lowest payment rate. Intensive Services Foster Care (ISFC)—a level of care above LOC 4—represents the highest level of care for home‑based family settings and comes with the highest payment rate. In addition to changing the basic structure of foster care payment rates, the new HBFC base foster care payment rates are generally higher than they were prior to CCR. Some form of county‑optional SCIs is expected to continue under the new HBFC foster care payment rate structure. However, counties may make adjustments to their SCI rate structures in order to harmonize their SCI rate structures with the HBFC rate structure. Figure 17 summarizes the HBFC payment rates under CCR.
Figure 17
2018‑19 Home‑Based Family Care Foster Care Payment Rates Under CCR
Per Child Per Month Rates
|
Level of Care |
1 |
2 |
3 |
4 |
ISFC |
|
County‑supervised foster caregivers |
$960 |
$1,068 |
$1,176 |
$1,284 |
$2,505 |
|
FFA payments: |
|||||
|
Foster caregivers |
960 |
1,068 |
1,176 |
1,284 |
2,505 |
|
Services and administration |
1,216 |
1,260 |
1,304 |
1,383 |
3,682 |
|
Total Payment for a Child Placed in an FFA Home |
$2,176 |
$2,328 |
$2,480 |
$2,667 |
$6,187 |
|
CCR = Continuum of Care Reform; ISFC = Intensive Services Foster Care; FFA = Foster Family Agency, |
|||||
LOC Assessment Tool. The DSS developed an LOC assessment tool to determine the foster care payment rate that caregivers will receive. The assessment is designed to identify the care needs of a foster child and to translate those care needs into an appropriate foster care payment rate. We note that, due to concerns with the tool that are explained in more detail later in this report, the LOC tool and rate structure has only been partially implemented.
Single STRTP Payment Rate. Unlike the rate structure that governed group home payment rates—which differentiated group home payment rates by the level of care and supervision different group homes provided—under CCR, there is a single monthly payment rate paid for all STRTP‑placed children. In 2018‑19, STRTPs are paid a per child per month foster care payment rate of $12,993.
CCR Aims to Expand Access to Mental Health and Other Supportive Services
Improving foster children’s access to mental health services has been a longstanding goal of the state. CCR builds on these efforts by requiring STRTPs to directly provide specialty mental health services to resident foster children. In addition, FFAs are required to ensure access to mental health services for the foster children they supervise by either providing the services themselves or contracting with mental health service providers to do so on their behalf. On top of aiming to improve access to mental health services, CCR mandates that certain other “core services” be made available to foster children. These core services include permanency services to help foster children reunify with their parents or, alternatively, secure permanency through guardianship or adoption.
CCR Changed the Caregiver Approval and Placement Processes
Resource Family Approval (RFA) Replaced the Previous Approval, Licensing, and Certification Processes for Home‑Based Family Caregivers. Before foster caregivers may receive full foster care payments, they must be approved to provide care. (As previously noted, relative caregivers with a placement prior to approval may obtain temporary grant funding while their application is being processed.) Prior to CCR, the approval process differed by placement type—for example, nonrelative caregivers were licensed according to one set of criteria while relative caregivers were approved under a different set of criteria. CCR replaced the multiple approval standards with a single, more comprehensive approval process that incorporates features included in assessments for prospective adoptive parents (such as a psychosocial assessment). Because it is a more comprehensive approval process, completing the RFA process is intended generally to automatically qualify a foster caregiver for guardianship and adoption—making it easier for caregivers to transition from providing one placement type to another. CCR legislation required all new prospective foster caregivers to complete the RFA process beginning in January 2017. Obtaining RFA is required of all existing foster caregivers by the end of December 2020 in order for them to continue to serve as foster caregivers.
More Collaborative Placement and Service Decisions Through the Use of Child and Family Teaming. To increase child and family involvement in decisions relating to foster children’s care, CCR mandates the use of child and family “teaming” through every stage of the case planning and service delivery process. The child and family team (CFT) may include, as deemed appropriate, the affected child, her or his custodial and noncustodial parents, extended family members, the county caseworker, representatives from the child’s out‑of‑home placement, the child’s mental health clinician, and other persons with a connection to the child. The CFT is required to meet at least once every six months (or once every 90 days for children receiving specialty mental health services) to discuss and agree on the child’s placement and service plan whenever an important foster care decision is made.
Functional Assessment Tool Used to Inform Placement and Service Decisions. CCR calls for children to receive a comprehensive strengths and needs assessment upon entering the child welfare system in order to improve placement decisions and ensure access to necessary supportive services. In late 2017, the Child and Adolescent Needs and Strengths (CANS) tool was chosen by DSS as the state’s functional assessment tool to be used within the CFT process. In June 2018, 33 counties began a phased implementation of the CANS assessment tool. Most of the remaining counties began implementation in October 2018. Los Angeles was the last county to begin implementation with its start in January 2019. As of October 2018, nearly 45 percent of children entering foster care were documented as having participated in the CFT/CANS process. The tool will be used to inform the decisions of the CFT and will be administered separately from the LOC assessment tool discussed above.
CCR Funding
The budget contains funding for most of the major programmatic components identified above, including, for example, CCR’s new foster care payment rates and the new costs associated with the RFA and CFT processes. This section briefly summarizes how the Governor’s CCR budget is structured.
CCR Creates Some Immediate New Costs for Counties. CCR increases certain costs for counties. For example, county administrative costs are higher as a result of the new RFA and CFT processes, which result in greater time commitments on county social workers. CCR’s relatively higher foster care payment rates also increase county costs.
CCR Expected to Eventually Result in Savings Due to CCR‑Related Caseload Movement. In addition to generating higher county costs, CCR is expected to result in offsetting savings for counties. As previously discussed, CCR aims to shorten foster children’s lengths of stay in congregate care, reduce the number of children ever placed in congregate care, and provide greater resources to home‑based family placements in order to improve their stability. To the extent that CCR succeeds in reducing the number of foster children in more costly placements, such as congregate care, in favor of less costly placement settings, such as HBFC settings, counties are expected to experience savings.
State Provides Funding for Net Costs of CCR. As previously discussed, counties are responsible for the costs of administering CWS that were included in 2011 realignment. Counties are only required to implement new state CWS policies to the extent that the state provides funding to cover the new policies’ costs. CCR creates new costs for counties, for example, in the form of higher administrative costs, while also potentially generating savings for counties as the proportion of foster children in costly placements such as congregate care placements decreases. The state has agreed with counties to fund CCR’s net costs on a county‑by‑county basis. That is, the state will fund the difference between (1) the new costs that CCR creates on a county and (2) any savings that CCR generates for that same county. The state will continue to fund counties’ CCR activities until each county’s CCR‑related savings equal or exceed its CCR costs. The state will not recoup from counties any CCR‑related savings that exceed counties’ CCR‑related costs. It is our understanding that the state and counties have agreed on a methodology to track CCR’s ongoing net costs for counties in order to identify the amount of state funding needed, if any, to pay for CCR on an ongoing basis.
Early on, CCR Was Anticipated to Be Largely Cost Neutral to the State Beginning in 2019‑20. In developing previous years’ budgets for CCR, DSS created a multiyear projection of CCR’s state costs. The last multiyear CCR projection released in May 2017 projected county CCR‑related savings to exceed county CCR costs beginning in 2019‑20, resulting in the end of state CCR funding for counties beginning in that fiscal year. DSS has not since released any updated multiyear projections of CCR and anticipates that CCR will continue to result in costs to the state for the foreseeable future.
Status Update on CCR Implementation
State and county implementation of CCR’s various components has been spread out over several years, with most of CCR’s major components implemented beginning in January 2017. Some elements of CCR implementation have gone relatively smoothly. Other components of CCR implementation have been met with delays and challenges. Our analysis that follows focuses on some of the major challenges of CCR implementation—many of which have already resulted in implementation delays—that remain.
RFA
Despite Attempts to Speed Up RFA Process, Delays Persist. CCR legislation generally directs RFA to be completed within 90 days of application for placements prior to approval. In practice, a large portion of RFA applications have been taking longer than 90 days to approve and many have taken longer than 6 months. While the reasons behind the prolonged RFA process are not entirely known, the relatively intensive set of social worker activities related to the family evaluation—previously known as psychosocial evaluation and which was not a part of the foster caregiver approval process prior to RFA—appears to have been a significant factor behind the slower than previously anticipated RFA process. To help RFA processing times, DSS has been engaged in regular technical assistance calls with counties, and in May of 2018 issued revised instructions to further streamline the process for converting existing foster caregivers with old licenses to approved resource families. That same month, counties with an RFA backlog also submitted their individual plans to mitigate those backlogs. Additionally, due to delays in RFA implementation, Chapter 935 extended the deadline for current foster care providers to obtain resource family approval to the end of 2020. Counties originally had until the end of 2019 to convert all certified family homes to resource families. The 2018‑19 budget provided $33 million General Fund to assist counties in implementing RFA. Nearly $10 million of this was one‑time funding specifically to assist counties in reducing the approval backlog. As of the end of November 2018, nearly 55 percent of open RFA applications for caregivers with placements prior to approval had been processing for greater than 90 days, which is slightly down from over 58 percent in June of 2018. During this same time period, the average number of days for these applications to be approved decreased from 194 days to 182 days.
Additional Funding Authorized for Placements Prior to Approval Set to Ramp Down in 2019‑20. As previously referenced, Chapter 35 of 2018 (AB 1811, Committee on Budget) requires counties to provide grant payments to foster caregivers with a pending RFA application in an amount equal to the basic level rate paid to approved resource families. These grants are funded through Emergency Assistance‑Temporary Assistance for Needy Families (EA‑TANF) funding with counties responsible for the nonfederal share of costs (30 percent). For caregivers of foster children determined to be ineligible for EA‑TANF, the state General Fund covers what would have been the federal share of costs. In 2018‑19, recipients are generally eligible for this funding for up to 180 days (and under certain conditions, up to 365 days) until their applications are approved or denied. Funding for placements prior to approval in 2018‑19 was $12.4 million ($1.5 million General Fund). The law reduces the length of grant funding from up to 180 days to up to 90 days beginning in 2019‑20. This was because it was assumed that the RFA process would likely speed up as counties had more experience with the process.
HBFC Rate Structure
LOC Assessment Tool and Rate Structure Remains Partially Implemented. The LOC assessment tool developed by DSS to determine foster care payment rates began implementation on March 1, 2018. However, currently the tool can only be applied to foster care youth who were placed in FFAs after December 1, 2017. The tool was intended to be applied to all HBFC placements beginning in May 2018, but rollout beyond new FFA placements has been delayed with no new implementation date officially set. Statements from DSS indicate that the administration intends to make the tool available for all remaining FFA placements in the spring of 2019 while placing the rollout for all other HBFC placements on hold until a validity study is conducted on determinations made for children involved in the FFA rollout. Although this reflects our most current understanding of the roll out of the tool, some confusion remains regarding the specific timing of the roll out of the tool to all placement types. The reason behind the delay relates at least in part to longstanding stakeholder concerns about the LOC assessment tool developed by DSS, which we discuss below. DSS has been in consultation with stakeholder groups over the past several months and has expressed their view to us that recent—not yet released—modifications to the tool have appropriately addressed their concerns and that the tool is ready for expanded implementation in mid‑2019.
While the rates determined by the LOC assessment tool currently only apply to new FFA placements, all other HBFC placements have still been receiving the LOC 1 rate rather than an age‑based rate since January 2017. Because even the LOC 1 rate is generally higher than the prior age‑based rates, foster caregivers of newly placed foster children are receiving higher foster care payments with this partial implementation of the HBFC payment rate structure than they would have under the pre‑CCR payment rate structure.
Continued Stakeholder Concerns About LOC Assessment Tool. The delays in the implementation of the LOC tool have largely been the result of longstanding stakeholder concerns around whether the LOC assessment tool developed by DSS to determine the foster care payment rates is reliable. These concerns initially arose over a year ago after initial testing of the LOC assessment tool was done on a sample of foster children in selected counties throughout the state. Stakeholders’ concerns are at least threefold:
- Potential Bias Toward Lower LOC Levels. Stakeholders contend that the LOC assessment tool assigns foster children with elevated needs into inappropriately low LOC levels, resulting in lower foster care payment rates for their foster caregivers. During testing of the LOC assessment tool, the highest proportion of foster children received an LOC 1 determination, with decreasing proportions receiving higher LOC determinations until ISFC, where there was an increase in the number of foster children receiving the highest LOC determination. This distribution has held true for determinations made during the partial LOC tool implementation since March 2018.
- Potential Lack of “Inter‑Rater Reliability.” Stakeholders are concerned about the objectivity of the LOC assessment tool insofar as different social workers using the tool may make different LOC determinations for the same foster child (a challenge referred to as inter‑rater reliability). It is our understanding that DDS has been working with outside researchers to take a closer look at this issue of inter-rater reliability.
- Uncertain Compatibility With Existing County SCI Determination Processes. As discussed earlier, certain counties provide SCIs for foster caregivers of children with elevated needs and have their own need‑based SCI assessment processes that do not necessarily correspond to the state’s new LOC assessment tool. Stakeholders are concerned that certain caregivers could see reductions in their overall foster care payment rates due to inconsistencies between the LOC and SCI assessment processes. Reductions in certain foster caregivers’ SCIs could potentially come about if counties begin using the LOC assessment tool to determine SCI levels and the LOC assessment tool results in a lower SCI determination than the previous, county‑operated assessment process. DSS has indicated in discussions that some counties have already reduced or eliminated their SCI grants, but a systematic analysis of the effect of these changes on the total amount of grant funding that caregivers receive has not been conducted.
Group Homes and STRTPs
Some Group Homes Allowed to Continue Operating Through 2019. Originally, all group homes were required to end operations as congregate care providers or convert into STRTPs by January 1, 2019. Now, DSS may grant group homes that apply for an extension the ability to continue to operate as group homes until January 1, 2020. As of December 2018, there were 165 total licensed STRTPs in the state with a capacity of almost 2,700 beds. An additional 340 group homes with more than 2,800 bed capacity have submitted STRTP applications.
Caseload Movement
Movement From Higher‑Level Placements Into Lower‑Level Placements Expected to Accelerate in 2018‑19 . . . As of October 2018, over 4,000 foster children in both the CWS and probation systems remained in congregate care. The number of children residing in congregate care has been declining without interruption since 2003—long before the implementation of CCR. It is uncertain what portion of the decline in congregate care placements, if any, is attributable to CCR efforts. The rate of caseload movement out of congregate care settings in 2018 was over 11 percent, which is faster than the rate of decline in previous years since the implementation of CCR—generally in the range of 5 percent to 7 percent. However, the rate of caseload movement out of congregate care settings in 2018 was still in the range of caseload declines in some years prior to the implementation of CCR.
The administration projects that total congregate caseload declines will continue to accelerate with less than 2,700 congregate care placements by the end of 2019‑20. Of those placements, 2,366 will be in STRTP placements, while 314 placements will be in group homes and transition out in later fiscal years. Figure 18 compares the Governor’s updated caseload movement projections with previous budgets’ caseload movement projections. In the figure, we show the number of foster children projected to reside in congregate care settings under the Governor’s 2019‑20 proposal (both traditional group homes and STRTPs) compared to prior CCR projections. The latest caseload movement projections assume approximately 2,500 foster children remain in congregate care through 2020‑21—in line with the previous projection in January 2018, despite slower projected caseload movement out of congregate care in the years leading up to 2020‑21.
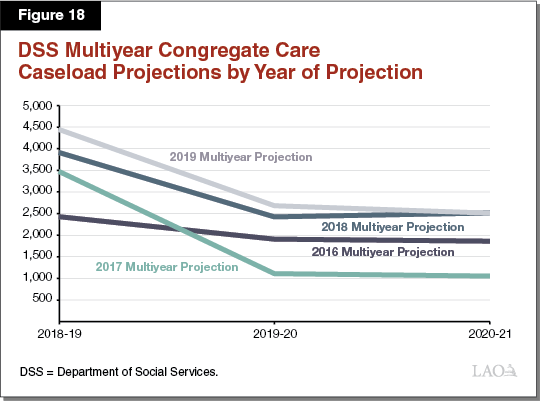 19 is significantly larger than its prior estimate of 321 group home placements transitioning to STRTPs in 2018‑19 released during the 2018 May Revision.
Overview of the Governor’s Budget for CCR
The 2019‑20 Governor’s Budget increases estimated General Fund spending on CCR in 2018‑19 and 2019‑20 compared to previous projections. Higher estimated 2018‑19 and 2019‑20 CCR spending does not result from any major proposed changes in CCR policy. Rather, this higher CCR spending reflects updated cost projections of the various components of CCR implementation. We describe the changes in estimated spending below.
The Governor’s Revised CCR Estimate for 2018‑19
Upward Revision in Estimated 2018‑19 CCR State Spending. Figure 19 breaks down the changes in estimated and projected CCR General Fund spending by CCR component for 2018‑19 and 2019‑20. The 2019‑20 Governor’s Budget revises upward estimated General Fund spending on CCR in 2018‑19 compared to the 2018‑19 Budget Act. In the enacted budget, the General Fund provided $194 million in 2018‑19 to counties through DSS to implement CCR. (We solely focus on state CCR funding for counties through DSS as this comprises the bulk of total CCR‑related spending.) The 2019‑20 Governor’s Budget revises estimated 2018‑19 General Fund spending on CCR upward by $102 million to $296 million.
Figure 19
Differences in Estimated 2018‑19 CCR Spending
Between 2018‑19 Budget Act and the 2019‑20 Governor’s Budgeta
General Fund (In Thousands)
|
2018‑19 |
Difference |
||
|
2018‑19 |
2019‑20 |
||
|
CCR foster care paymentsb |
$82,108 |
$173,548 |
$91,440 |
|
Child and family teams |
52,246 |
52,246 |
— |
|
Foster parent recruitment, retention, and support |
21,630 |
21,630 |
— |
|
Resource family approval (RFA) |
23,145 |
23,145 |
— |
|
RFA processing backlog reduction |
3,161 |
9,461 |
6,300 |
|
Placement with a kin caregiver prior to RFA approval |
— |
1,434 |
1,434 |
|
Level of care protocol tool |
2,491 |
7,291 |
4,800 |
|
Other administrative and automation components |
9,610 |
7,119 |
‑2,491 |
|
CCR Local Assistance Total |
$194,391 |
$295,874 |
$101,483 |
|
aOnly includes local assistance funding through the Department of Social Services. It therefore excludes all state operations spending as well as CCR‑related mental health expenditures. bThis line includes the net costs of the following: (1) the costs associated with the new higher CCR payment structure (2) changes in cost per child due to movements to different placements and (3) changes in total caseload numbers. CCR = Continuum of Care Reform. |
|||
Higher CCR Spending Largely the Result of Updated Caseload Movement Projections. The main driver of higher than previously anticipated state spending on CCR in 2018‑19 is the projected slower speed at which foster children are moving out of congregate care into HBFC settings and higher numbers of children moving from group homes to STRTPs. As previously discussed, anticipated spending on CCR over time depends significantly on the number of children transitioning out of costly placements, such as congregate care placements, and into lower cost placements, such as HBFC settings, which generates savings for counties that the state uses to offset its CCR‑related costs. Previous CCR spending projections included significant movement out of congregate care as a result of CCR efforts beginning as early as 2016‑17. The net costs associated with the most recent updates to projected caseload movement are reflected in the “CCR Foster Care Payments” line of Figure 19 (and Figure 20). This line combines (1) the costs associated with the new higher HBFC payment rate structure and (2) the offsetting savings generated by children moving out of more costly placements, such as congregate care settings, to less costly placements such as HBFC settings. This line also accounts for the additional costs generated by moving children in lower‑cost congregate care settings in group homes to higher‑cost congregate care settings in STRTPs.
Figure 20
Year‑Over‑Year CCR Spending Under the 2019‑20 Governor’s Budgeta
General Fund (In Thousands)
|
2018‑19 |
2019‑20 |
Difference |
|
|
CCR foster care paymentsb |
$173,548 |
$184,008 |
$10,460 |
|
Child and family teams |
52,246 |
52,852 |
606 |
|
Foster parent recruitment, retention, and support |
21,630 |
— |
‑21,630 |
|
Resource Family Approval (RFA) |
23,145 |
8,187 |
‑14,958 |
|
RFA processing backlog reduction |
9,461 |
— |
‑9,461 |
|
Placement with a kin caregiver prior to RFA approval |
1,434 |
1,434 |
— |
|
Level of care protocol tool |
7,291 |
7,291 |
— |
|
CANS functional assessment tool implementation |
— |
9,816 |
9,816 |
|
Other administrative and automation components |
7,119 |
7,411 |
292 |
|
CCR Local Assistance Total |
$295,874 |
$270,999 |
‑$24,875 |
|
aOnly includes local assistance funding through the Department of Social Services. It therefore excludes all state operations spending as well as CCR‑related mental health expenditures. bThis line includes the net costs of the following: (1) the costs associated with the new higher CCR payment structure (2) changes in cost per child due to movements to different placements and (3) changes in total caseload numbers. CCR = Continuum of Care Reform. |
|||
The Governor’s Proposed CCR Budget for 2019‑20
Higher Than Previously Anticipated Proposed State Spending on CCR in 2019‑20. Previous multiyear CCR spending projections anticipated that CCR implementation would become cost neutral to the General Fund by 2019‑20. As Figure 20 shows, the 2019‑20 Governor’s Budget now proposes $271 million in General Fund spending on CCR in 2019‑20.
2019‑20 Proposed Budget Reflects a Year‑Over‑Year Decline in Costs for CCR. While overall CCR costs in 2018‑19 and 2019‑20 are higher than under the administration’s previous projections, the 2019‑20 Governor’s Budget proposal reflects a net year‑over‑year reduction in state General Fund costs for CCR of almost $25 million. Four factors—reflecting both cost increases and cost decreases—largely explain the net decrease:
- Expiring Funding for Foster Caregiver Recruitment and Retention. To respond to an anticipated need for more home‑based family caregivers as a result of CCR’s push to reduce reliance on congregate care, the state implemented a limited‑term, multiyear augmentation of funding to recruit and retain more families as foster caregivers beginning in 2015‑16. The last year of the augmented funding was set for 2018‑19, which included $22 million General Fund. The Governor’s budget does not include an extension of funding for this purpose.
- Decrease in RFA Funding. In 2018‑19, the budget included a total of $32.5 million General Fund in RFA funding, including $23 million to help counties implement the conversion of the previous caregiver approval systems to RFA, as well as $9.5 million that was provided one‑time to reduce the RFA approval backlog. The Governor’s budget proposes to reduce total state funding for RFA to counties by more than $24 million—leaving about $8 million General Fund for this purpose. This reduction includes the $9.5 million one‑time General Fund allocation that expires at the end of 2018‑19. The remaining $15 million reduction is due to the administration’s view that much of the RFA process should be a county responsibility.
- New Funding for CANS Implementation. In accordance with supplemental reporting language last year requiring the administration to estimate costs to counties for implementing CANS, the Governor’s budget proposes General Fund support for close to $10 million worth of estimated costs to counties to implement CANS. The administration intends for this funding to be for temporary start‑up costs and cease at the end of 2019‑20.
- More Children Expected to Transition to STRTPs in 2019‑20. The 2019‑20 Governor’s Budget projects that while a greater number of children currently in group homes will transition into home‑based family care placements in 2019‑20 than in previous years, an even greater number will transition into STRTPs and a few hundred will remain in group homes for the duration of 2019‑20. The greater costs from a high number of children in STRTPs—which have higher reimbursement rates than group homes—will more than offset the savings from lower total number of children in congregate care. As a result, the administration estimates that General Fund spending on the HBFC rate structure will increase by more than $10 million year‑over‑year.
Figure 20 summarizes the change in year‑over‑year General Fund spending on CCR between 2018‑19 and 2019‑20.
CCR Expected to Result in Significant Net State Costs for Foreseeable Future. In the administration’s last multiyear CCR spending projection, released at the 2017‑18 May Revision, the administration projected CCR to be cost neutral to the state by 2019‑20. These projected savings were the result of projected CCR‑related caseload movement savings exceeding the total projected costs of CCR’s other components. The administration no longer expects caseload movement‑related savings to exceed the costs of CCR’s other components within the next few years. The administration did not release an updated multiyear CCR spending projection in 2018‑19. Based on information from the administration, we project CCR to continue to produce significant net state costs for the foreseeable future.
LAO Assessment
Below, we provide a brief assessment of the Governor’s 2019‑20 CCR budget and raise several issues for legislative consideration. This assessment is based on our initial review of the Governor’s CCR budget. We will provide an update to the Legislature as needed as we continue to analyze the Governor’s budget and how CCR implementation is going.
Governor’s Estimated CCR Spending for 2018‑19 and 2019‑20 Reasonable
The 2019‑20 Governor’s Budget revises upward estimated General Fund spending on CCR in 2018‑19. It subsequently projects a year‑over‑year decline in General Fund spending on CCR in 2019‑20. We find these adjustments in estimated CCR spending to be reasonable.
Higher Projected State Costs in 2018‑19 Reasonable in Light of Slower CCR Implementation. The administration’s previous projections of CCR achieving cost neutrality for the state were relatively ambitious, assuming that the changes under CCR would quickly translate into movement of children away from more costly placement settings such as congregate care to less costly placements such as HBFC settings, leading to decreasing General Fund costs over time. Certain components of CCR implementation have taken longer to implement than originally intended. The principal example is the delayed rollout of the full LOC‑based HBFC payment rate structure, originally intended to start in January 2017 and now with an indefinite delay to its full implementation. Given this and other CCR implementation delays, it is reasonable to expect that certain goals of CCR will take longer to be realized, including CCR‑related caseload movement and the associated savings. From the initial data available, it appears that a higher than originally expected proportion of caseload movement out of group homes is shifting to higher cost STRTPs as opposed to lower cost HBFC placements. Additionally, overall caseload movement out of congregate care is taking longer than originally expected. As such, we believe it is prudent to assume a slower long‑term pace of General Fund savings from caseload movement, as the administration has assumed in the 2019‑20 budget.
Lower Projected State Costs in 2019‑20 Reasonable Given the Expiration of Funding for Certain Upfront Costs. The administration has adjusted its methodology for estimating CCR costs associated with foster care rate payments to incorporate more robust data on caseload movement. The administration’s 2019‑20 budget subsequently projects an increase in costs associated with foster care rate payments in 2019‑20 compared to 2018‑19, which we believe is appropriate given previously discussed trends in caseload movement such as the large number of children being placed in high‑cost STRTPs. Notwithstanding higher rate structure costs, we believe it is also reasonable to expect that overall costs to the state for CCR will decrease in the 2019‑20 given the scheduled expiration of significant General Fund support for other components of CCR, such as FPPRS and certain parts of RFA implementation. (We make comments on the expiration of some of this one‑time funding later in this analysis.)
Continuing to Speed Up RFA Process Critical to CCR’s Success
CCR’s success in part depends on the state and counties’ ability to increase the number of HBFC caregivers.
Prolonged RFA Process Has Potential Negative Impact on the Supply of HBFC Settings. A critical first step in increasing the supply and capacity of HBFC caregivers is to complete the foster caregiver approval process, RFA, in a timely manner. The continued prolonged RFA approval process described earlier impedes the state’s ability to increase the number of foster caregivers and, accordingly, prevents the state from moving foster children out of congregate care settings and into HBFC settings as fast as it otherwise could.
RFA Process Remains Prolonged and Cumbersome for Counties and Caregivers, But Aid From the State Is Set to Decline. As previously discussed, various components of the RFA process have experienced delays. The deadline for counties to convert existing FFH caregivers to RFA has been extended by a year and a significant backlog of RFA applications are taking longer than 90 days to process persists. In 2018‑19 DSS released new county directives aimed at shortening the time it takes to complete the RFA process and counties were given temporary additional funding resources to assist in the RFA process. While there has been some moderate improvement in the backlog, progress remains slow. The average number of days to process applications, though lower than it was earlier in 2018, remains far above 90 days. At the same time, General Fund support to help counties with RFA implementation is proposed to be reduced by a total of $24 million General Fund in 2019‑20, from $32.5 million to $8 million. Additionally, pursuant to current law, families taking care of foster children whose RFA applications are pending approval will only receive temporary grant funding for up to 90 days until the application finishes processing—down from the currently authorized 180 days—beginning in 2019‑20.
Recommend the Legislature Continue to Closely Monitor How Long the RFA Process Is Taking and Consider Additional Legislative and/or Budgetary Fixes if Improvement Stalls. We recommend that the Legislature continue to closely monitor whether RFA process times cease to make additional improvements and require DSS to examine and report on whether this is the result of inadequate county resources or cumbersome approval policies. Should little improvement continue to be shown in the speed of the RFA process, the Legislature should consider whether additional policy changes around RFA are necessary.
Consider Extending Current Level of Funding to Assist With the RFA Process. Counties continue to experience persistent delays and backlogs as they implement the RFA process even after receiving additional temporary resources from the state for this purpose. Given the importance of a fully functional RFA process to the overall success of CCR, the Legislature should therefore consider maintaining current levels of RFA funding for counties—currently over $32 million General Fund for 2018‑19—until more substantial progress has been made.
Furthermore, there continue to be many families experiencing delays in RFA approval lasting several months. Caring for a foster child without the full monthly foster care payment can represent a significant economic burden that has potential to impair these placements’ stability. The Legislature might therefore consider the potential trade‑offs of extending the current arrangement of funding payments to foster caregivers with placement prior to RFA approval up to 180 days (and under certain conditions, up to 365 days) until their applications are approved or denied. State funding for kin caregivers who have a child placed with them prior to RFA approval is under $1.5 million General Fund for both 2018‑19 and 2019‑20—reflecting that federal EA‑TANF funds cover the large majority of costs for this program. Regardless of the total number of caregivers experiencing prolonged RFA application processing times, any individual caregiver that experiences a delay in payment could be put at risk for financial instability. Thus, if the Legislature chooses to extend this funding, it might consider making the extension permanent.
Implementation of LOC Assessment Tool‑Based HBFC Rates
Implementation of CCR’s full HBFC payment rate structure requires the use of an assessment to determine foster children’s general level of need and, accordingly, determine an appropriate foster care payment rate. DSS developed the LOC assessment tool to perform this function.
Issues to Consider Related to the Planned Implementation of the Full LOC Assessment Tool. As noted above, there are some longstanding stakeholder concerns related to the LOC assessment tool’s reliability. As such, the administration has repeatedly delayed implementation of the full LOC‑based payment rate structure beyond new and recent FFA placements. On the one hand, because FFA‑supervised children are not eligible for the SCI, concerns about the new rate structure’s compatibility with the SCIs do not apply to existing FFA placements not covered by the current implementation. In addition, implementation of the LOC‑based HBFC payment rate structure for FFAs would give the state and counties additional experience administering the LOC assessment tool and present the state with greater opportunity to refine its guidance and training on using the tool. On the other hand, we recognize stakeholders’ concerns about the LOC assessment tool’s fundamental reliability and validity as well as the potential that FFH caregivers might receive lower overall grant payments as a result of counties reducing SCI payments due to their implementation of the assessment tool.
As a result, we recommend that the Legislature question the administration on issues currently still outstanding regarding the LOC tool including:
- Rollout of the LOC Tool. There are multiple points of uncertainty regarding the administration’s plans to fully implement the tool, such as: (1) how the administration addressed specific concerns over the tool’s validity and reliability when making, or choosing not to make, modifications to the tool for the FFA rollout, (2) what potential risks or uncertainties in that regard remain for the tool, (3) a detailed plan for testing the tool’s validity and incorporating findings into further development of the tool, and (4) a clarification of when and under what circumstances it will roll out the tool to non‑FFA home‑based placements.
- Trade‑Offs Associated With Using an Alternative Assessment Tool. The Legislature and administration may also want to study the viability and merits of using alternative tools for LOC rate determination, such as CANS, which is a widely accepted assessment tool among stakeholders and is already being incorporated into the CFT process.
- Impact of New Rates on SCIs. It is our understanding from the administration that the level of SCIs in some counties has been reduced, which might result in some caregivers receiving lower total grant payments even if the new HBFC rate structure provides higher base grants than the previous age‑based rate structure. We therefore recommend the Legislature require the administration to analyze the net impact on total grant rates received by caregivers resulting from the combined effect of county modifications to their SCI rate structures and the statewide rollout of the HBFC rate structure.