LAO Contacts
- Sara Cortez
- School Nutrition
- Kenneth Kapphahn
- Overall Proposition 98 Package
- The Minimum Guarantee
- Amy Li
- Special Education
- Education Workforce
- Ned Resnikoff
- Local Control Funding Formula
- Addressing the Acheivement Gap
Correction 2/26/20: Corrected reference to the cost of the Governor’s education workforce proposals.

February 24, 2020
The 2020-21 Budget
Proposition 98 Education Analysis
- Introduction
- Overall Proposition 98 Package
- The Minimum Guarantee
- Local Control Funding Formula
- Special Education
- Education Workforce
- Addressing the Achievement Gap
- School Nutrition
- Summary of Recommendations
Executive Summary
In this report, we assess the architecture of the Governor’s overall Proposition 98 budget and analyze his specific proposals for K‑12 education.
Overall Proposition 98 Budget
$3.7 Billion in New Proposition 98 Spending Proposals. The new spending consists of $3.3 billion for K‑12 schools and $388 million for community colleges. Across both segments, slightly more than half ($2 billion) is for one‑time initiatives and the remainder ($1.7 billion) is for ongoing augmentations. Nearly all of the ongoing funding is to cover an estimated 2.29 percent cost‑of‑living adjustment for various K‑14 programs. Total K‑12 funding per student would grow to $12,619 in 2020‑21, an increase of $499 (4.1 percent) over the revised 2019‑20 level.
Many of the Governor’s One‑Time Initiatives Would Not Address Root Issues. Most of the Governor’s one‑time initiatives seek to improve the education workforce or address poor performance among certain districts and schools. Many of the proposals, however, seem unlikely to have much long‑term effect on these issues. We also are concerned that many proposals are missing important details regarding how the funds would be spent. Accordingly, we recommend the Legislature reject most of these proposals, freeing up more than $1 billion in Proposition 98 funds relative to the Governor’s budget. In some cases, we provide alternative options that would align more closely with existing efforts to address the root problems. These alternatives could be structured to cost less than the amounts proposed by the Governor.
Legislature Could Use Freed‑Up, One‑Time Funds to Pay Down Pension Liabilities. School districts face fiscal pressures ranging from rising pension costs to higher costs for special education. Though nearly all districts currently hold positive budget ratings, we expect districts to face more difficulty balancing their budgets in the upcoming year. To the extent the Legislature rejects some of the Governor’s one‑time proposals, we think it should consider using the freed‑up funds to provide fiscal relief. Of all the available options, we think making additional payments toward districts’ unfunded pension liabilities would offer the greatest fiscal benefit. Paying down these liabilities would improve the funding status of the pension systems and likely reduce district costs over time.
Key Messages
Special Education Base Proposal Would Reduce Historical Inequities. The administration proposes to make reforms in special education financing and other areas over a multiyear period. In this first year, the administration’s largest proposal is $645 million ongoing to ensure base rates for all special education local plan areas are at least $660 per student. We recommend the Legislature adopt this proposal. By reducing variations in base rates, the proposed new rate would address inequities that have persisted for decades.
Recommend the Legislature Take Different Approach in Other Special Education Proposals. In addition to the proposed special education base augmentation, the Governor’s budget provides $250 million one time to increase or improve special education services for preschool‑aged students. The proposal sends a confusing message to districts, as districts are unlikely to hire the additional staff necessary to provide these services with one‑time funding. As an alternative, we recommend using the $250 million to provide ongoing funding for preschool‑aged children through the state’s base special education formula. This approach would recognize the ongoing costs associated with serving this age group. The administration also proposes $1.1 million one time for a governance study and two workgroups to inform future special education reforms. We encourage the Legislature to think carefully about the concerns it would like to address and consider funding studies to provide more concrete options on these issues. In adopting its 2020‑21 budget, the Legislature could also address other key priorities not directly related to the special education funding model, such as expanding existing initiatives that provide districts technical assistance to implement inclusive practices.
Recommend Rejecting Opportunity Grants Proposal. The Governor’s budget provides $300 million one time to provide grants and support to low‑performing districts and schools where at least 90 percent of students are low income. Key elements of the Governor’s proposal, including the vision and scope of the grant program, are left entirely to the discretion of the California Collaborative for Educational Excellence and the State Board of Education. As a result, the proposal lacks sufficient detail for the Legislature to determine whether this approach would be an effective way to improve outcomes for low‑performing districts and schools. Additionally, the administration appears to have developed this proposal without considering how this funding would align with existing funding provided to support low‑performing schools and districts. We recommend the Legislature reject the proposal and instead consider a smaller ongoing augmentation to assist a smaller subset of districts with significant performance issues.
Recommend Funding Smaller Community Schools Pilot With Greater Emphasis on Technical Assistance. The Governor’s budget provides $300 million in one‑time funding to provide grants to school districts interested in implementing the community schools model. Our review finds that the community schools model is associated with improved student outcomes, but can be difficult to implement. The Governor’s proposal stipulates that grant recipients will receive technical assistance, but does not include any requirements for the level of assistance they would receive. The Governor’s proposal also includes no rules or requirements for how the grant funds could be spent. To provide greater certainty that grantees would implement a community schools model effectively, we recommend the Legislature fund a smaller grant program that focuses on technical assistance.
Recommend Approving Smaller Package of Proposals to Address School Workforce Shortages. The administration proposes a total of $532 million one time for various proposals aimed at addressing school workforce needs. We recommend the Legislature approve a total of $93.1 million for two programs—one that helps school employees earn a teaching credential and another that trains prospective teachers by pairing them with experienced mentor teachers in the classroom. These programs have shown some promise in expanding teacher supply and improving teacher preparation, respectively. We recommend the Legislature reject the other one‑time proposals in this areas, as they do not address the underlying factors contributing to workforce shortages.
Introduction
In this report, we analyze the Governor’s Proposition 98 budget package. The first section analyzes the architecture of the Proposition 98 budget, with an overview of the new Proposition 98 spending, a review of the key fiscal issues facing school districts, and our overarching comments on the Governor’s proposals. The second section describes the underlying changes in the Proposition 98 minimum guarantee that support the Governor’s proposed spending level and explains how the guarantee could change in the coming months. The five remaining sections of this report examine the Governor’s major proposals involving K‑12 education. Specifically, we analyze his proposals for (1) the Local Control Funding Formula (LCFF), (2) special education, (3) the education workforce, (4) closing achievement gaps, and (5) child nutrition.
Other Education Budget Analyses Complement This Report. The first section of this report summarizes the Proposition 98 spending changes affecting the California Community Colleges, but we analyze specific community college proposals separately in The 2020‑21 Budget: Higher Education Analysis. We analyze the Governor’s proposals for State Preschool in The 2020‑21 Budget: Early Education Analysis. In our January report, The 2020‑21 Budget: School District Budget Trends, we provide detailed information about compensation, staffing, pensions, and other cost pressures affecting school district budgets. On the “EdBudget” portion of our website, we post dozens of tables containing additional details about the Governor’s education proposals.
Overall Proposition 98 Package
In this section, we describe the main features of the Governor’s Proposition 98 spending package, review some key fiscal issues facing school districts, and provide our overall assessment of the Governor’s package.
Overview of New Spending
Governor Proposes $3.7 Billion in New Proposition 98 Spending. The Governor’s January budget package contains a total of $3.7 billion in new Proposition 98 spending across the 2018‑19 through 2020‑21 period. This amount consists of $3.3 billion for K‑12 education and $388 million for the California Community Colleges (Figure 1). Of the new spending, $2 billion is for one‑time initiatives and $1.7 billion is for ongoing commitments.
Figure 1
Governor’s Proposition 98 Spending Proposalsa
(In Millions)
|
K‑12 Education |
|
|
Ongoing |
|
|
COLA (2.29 percent) and attendance changes for LCFF |
$1,206 |
|
COLA for select categorical programs (2.29 percent)b |
126 |
|
Child nutrition reimbursement rate increase |
60 |
|
Other |
6 |
|
Subtotal |
($1,398) |
|
One Time |
|
|
Educator Workforce Investment Grants |
$350 |
|
Community school grants |
300 |
|
Opportunity grants |
300 |
|
Special education preschool grant |
250 |
|
Grants to address school staffing shortages |
193 |
|
Teacher Residency Grant Program |
175 |
|
Stipends for teachers in hard‑to‑staff subjects/schools |
100 |
|
Inclusive Early Education Expansion Program |
75 |
|
Classified employees credentialing program |
64 |
|
Literacy grants |
53 |
|
County coordination grants |
18 |
|
Computer science resources for educators |
18 |
|
Refugee student services |
15 |
|
Other |
21 |
|
Subtotal |
($1,932) |
|
Total K‑12 Education |
$3,329 |
|
California Community Colleges |
|
|
Ongoing |
|
|
COLA for apportionments (2.29 percent) |
$167 |
|
Enrollment growth (0.5 percent) |
32 |
|
Apprenticeship instructional hours |
28 |
|
COLA for select categorical programs |
22 |
|
Immigrant legal and support services |
16 |
|
California Apprenticeship Initiative |
15 |
|
Other |
16 |
|
Subtotal |
($296) |
|
One Time |
|
|
Funding for current‑year apprenticeship costs |
$20 |
|
Work‑based learning initiative |
20 |
|
Deferred maintenance |
17 |
|
Faculty diversity fellowships |
15 |
|
Other |
20 |
|
Subtotal |
($93) |
|
Total California Community Colleges |
$388 |
|
Total Spending Proposals |
$3,717 |
|
aReflects all proposals scored to 2018‑19, 2019‑20, or 2020‑21, including reappropriations. bApplies to special education, state preschool, child nutrition, mandates block grant, charter school facility grants, services for foster youth, adults in correctional facilities, and American Indian education. |
|
|
COLA = cost‑of‑living adjustment and LCFF = Local Control Funding Formula. |
|
Largest Share of One‑Time Funding Allocated for Improving the Education Workforce. The largest allocation of one‑time funding consists of $882 million for five initiatives aimed at improving school employee training, recruitment, and retention. Most of these initiatives would be allocated as competitive grants. According to the Governor’s budget summary, the goals of these initiatives include (1) addressing teacher shortages in high need areas, including special education, science, and math; and (2) better preparing teachers and administrators to address the social‑emotional needs of their students.
Budget Funds Two One‑Time Initiatives Intended to Close Achievement Gaps. The budget provides $600 million for two new grant programs intended to address poor academic outcomes for specific student subgroups. The Opportunity Grant program would provide $300 million for grants to help improve academic outcomes for low‑performing schools and districts. Grant recipients also would receive additional technical assistance through the California Collaborative for Educational Excellence (CCEE). The Community Schools program would provide $300 million to support the implementation and expansion of the community schools model—an approach that integrates health, mental health, and other services for students and families and provides these services directly on school campuses.
Nearly All Ongoing Funding Dedicated to Covering Cost‑of‑Living Adjustment (COLA). The Governor’s budget dedicates most of the $1.7 billion in new ongoing funding to covering the statutory COLA (projected at 2.29 percent) and changes in student attendance. Specifically, the budget provides an associated $1.2 billion for the LCFF, $167 million for community college apportionments, and $147 million for various other school and community college programs (including special education, preschool, and adult education). The other ongoing augmentations besides COLA also relate to existing programs.
Funding Rises Steadily Each Year of the Period. Figure 2 shows the overall distribution of funding by segment over the budget period. For each year, the Governor proposes to set total funding at the amount required to meet the Proposition 98 minimum guarantee. In per‑student terms, funding for K‑12 education would grow to $12,619 in 2020‑21, an increase of $499 (4.1 percent) over the revised 2019‑20 level.
Figure 2
Proposition 98 Funding by Segment
Dollars in Millions Except Funding Per Student
|
2018‑19 Revised |
2019‑20 Revised |
2020‑21 Proposed |
Change From 2019‑20 |
||
|
Amount |
Percent |
||||
|
Funding |
|||||
|
K‑12 Educationa |
$69,253 |
$71,572 |
$74,279 |
$2,707 |
3.8% |
|
California Community Colleges |
9,195 |
9,477 |
9,807 |
330 |
3.5 |
|
Reserve deposit (+) or withdrawal (‑)b |
‑ |
524 |
‑38 |
‑562 |
‑ |
|
Totals |
$78,448 |
$81,573 |
$84,048 |
$2,475 |
3.0% |
|
Enrollment |
|||||
|
K‑12 attendance |
5,912,934 |
5,905,605 |
5,886,490 |
‑19,115 |
‑0.3% |
|
Community college FTE studentsc |
1,122,691 |
1,123,753 |
1,119,421 |
‑4,332 |
‑0.4 |
|
Funding Per Student |
|||||
|
K‑12 Education |
$11,712 |
$12,119 |
$12,619 |
$499 |
4.1% |
|
California Community Colleges |
8,190 |
8,433 |
8,761 |
328 |
3.9 |
|
aIncludes funding for instruction provided directly by state agencies and the portion of State Preschool funded through Proposition 98. bProposition 98 Reserve established by Proposition 2 (2014). cChange from 2019‑20 to 2020‑21 reflects lower baseline enrollment, partially offset by proposed growth. FTE = full‑time equivalent. |
|||||
Funding Per Student at All‑Time High. Adjusted for inflation, the per‑student funding levels proposed by the Governor would be the highest since the passage of Proposition 98 in 1988. Compared with the previous all‑time high in 2000‑01, the proposed funding level for K‑12 education is up nearly $900 per student. The 2020‑21 budget would mark the fourth consecutive year in which per‑student funding exceeds the previous all‑time high.
District Fiscal Issues
Turning to a District Perspective. In this part of the report, we shift from an overview of the Governor’s budget to the fiscal trends affecting school district budgets. While each district’s budget is unique, most districts in the state are being affected by the following issues: (1) rising pension costs; (2) continued pressure to increase compensation; (3) declining attendance; and (4) following several years of strong growth, slower growth in school funding. We discuss each of these issues below.
School Pension Costs Set to Increase. Required district contributions to the California State Teachers’ Retirement System (CalSTRS) and the California Public Employees’ Retirement System (CalPERS) have grown from $3.5 billion in 2013‑14 to $8.7 billion in 2019‑20. (CalSTRS administers pension benefits for teachers, administrators, and other certificated employees, whereas CalPERS administers pension benefits for classified employees, such as cafeteria workers.) The rise in costs primarily reflects efforts to address the large unfunded liabilities the two pension systems accrued over the past few decades. For 2020‑21, school districts’ total contributions to CalSTRS and CalPERS are likely to increase by another $800 million to $1 billion.
Pressure to Increase Compensation Likely to Remain High. Available data show the average teacher in California earned a salary of $82,700 in 2018‑19, an increase of about $11,300 over the 2013‑14 level. (After accounting for inflation, the increase is about $4,000. The state also required teachers to make additional contributions to CalSTRS.) Though classified employees typically have lower salaries than teachers, available data suggest their salaries have grown at a similar rate. Despite these increases, we expect districts to continue facing salary‑related pressure because housing and other personal costs of living in California are relatively high and growing.
Student Attendance Likely to Continue Declining. Student attendance in California has declined every year since 2013‑14 and is projected to continue declining over the next several years. The decline is attributable to decreases in the number of births in California and overall out‑migration of school‑aged children. Some areas, including Los Angeles, Orange, and Santa Clara counties are in the midst of particularly large declines. Attendance declines can sometimes ease certain pressures. For example, districts with declining attendance tend to face less pressure to hire additional teachers. Most districts, however, report that declining attendance usually leads to tighter budgets. This is because state funding tends to decline in tandem with falling attendance, but certain district costs—such as central administration and facility maintenance—do not decline as smoothly. To balance their budgets, districts with declining attendance sometimes need to make notable adjustments (such as closing schools or consolidating programs). Available data also show that most districts are seeing an increase in the number of students with disabilities. This trend means districts face continued pressure to hire aides and other specialists to support these students despite the drops in overall district attendance.
School Funding Growing at a Slower Pace Compared With Recent Years. From 2013‑14 through 2018‑19, annual growth in K‑12 funding per student averaged 5.9 percent—notably higher than the 3.8 percent average dating back to 1988‑89. (These growth rates are unadjusted for inflation.) These increases were due mainly to significant growth in the Proposition 98 minimum guarantee. They also helped districts respond to their various cost pressures. Since 2019‑20, however, growth in the minimum guarantee has begun to slow. Under the Governor’s budget, Proposition 98 funding per student grows by 3.5 percent in 2019‑20 and 4.1 percent in 2020‑21—more in line with the historical average.
Most Districts Currently Hold Positive Budget Ratings. Districts respond to cost pressures in different ways, with decisions about salary, benefits, and staffing often varying notably even among neighboring districts with similar student demographics and overall funding levels. The latest available data suggest that most districts have been able to make trade‑offs among these competing pressures in ways that allow them to balance their budgets. As of December 2019, 96 percent of school districts held positive budget ratings. As funding growth slows, however, districts likely will face more difficulty balancing their budgets moving forward.
Comments
Proposition 98 Package Contains a Cushion in Event of Downturn. One important feature of the Governor’s Proposition 98 plan is that it sets aside funding in the budget year for one‑time activities. Specifically, of the $2 billion in new one‑time funds, $1.4 billion is attributable to 2020‑21. The advantage of this budgeting approach is that if the guarantee falls below projections, the expiration of these one‑time activities provides a cushion that reduces the likelihood of cuts to ongoing K‑14 programs. Such an approach seems particularly prudent this year, given the economic risks we discuss later in this report. Regardless of the specific programs the Legislature decides to fund in 2020‑21, we recommend it adopt a final budget plan that continues to include a mix of ongoing and one‑time spending.
Some One‑Time Proposals Unlikely to Address Root Issues. Most of the one‑time proposals in the Governor’s budget seek to address longstanding issues in K‑12 education, such as recruiting and retaining a well‑trained education workforce and improving outcomes in low‑performing schools and districts. Many of the proposals, however, seem unlikely to have a long‑term effect on these issues. Specifically, we are concerned that the proposals are not directly connected to the underlying problems or aligned with existing state and federal programs intended to address those problems. We also are concerned that many proposals are missing important details regarding how the funds would be spent. As we discuss in subsequent sections of this report, we recommend rejecting most of these proposals, freeing up more than $1 billion inside the guarantee. In some cases, we provide alternative options that would align more closely with existing efforts to address the root problems. These alternatives could be structured to cost less than the amounts proposed by the Governor.
Budget Provides Relatively Little Fiscal Relief for Districts. Nearly all of the one‑time proposals in the Governor’s budget would require districts to implement new programs or expand services as a condition of receiving funding. Most school districts, however, are facing relatively tight budgets compared to previous years. For example, the entire $1.2 billion increase associated with the LCFF COLA is only slightly above the expected increase in pension costs. Given these dynamics, we think districts would have difficulty implementing and sustaining so many new initiatives. To the extent the Legislature rejects some of these proposals, we think it should consider using the freed‑up funds to provide districts with additional fiscal relief. This approach could help districts prioritize the local programs and services they find most effective.
Using One‑Time Funds for Pensions Could Help Address a Key Cost Pressure. Many school districts regard higher pension costs as their most significant fiscal challenge. To help districts address this issue, the Legislature could use a portion of the freed‑up Proposition 98 funding to pay down districts’ unfunded pension liabilities more quickly. Under this approach, the state would make a payment on top of the previously scheduled increase in district contributions for 2020‑21. Paying down unfunded liabilities would improve the funding status of the pension systems. It also would likely reduce district pension costs over the next few decades—potentially making district budgets easier to balance on a sustained basis. Alternatively, if the Legislature wanted to provide more relief specifically in the upcoming year, it could consider using a portion of the one‑time funding to smooth out pension rate increases in 2020‑21. Although this approach lacks the potential for long‑term savings, it could improve districts’ fiscal health in the immediate future. The nearby box describes these options in more detail.
State Could Reduce Districts’ Pension Costs Over the Long Term
Long‑Term Savings Could Be Achieved Through Supplemental Payments. Both California State Teachers’ Retirement System (CalSTRS) and California Public Employees’ Retirement System (CalPERS) have unfunded liabilities—meaning actuaries estimate that, based on various assumptions about the future (for example, investment returns and life expectancy), the pension systems have insufficient assets to pay future benefits that have been earned by members. The state and school districts share responsibility for paying down the CalSTRS unfunded liability, whereas districts are entirely responsible for any unfunded liability in their CalPERS plans. The state could make a supplemental payment to CalSTRS or to CalPERS on behalf of districts. In other words, the state could pay a lump sum toward districts’ share of the pension systems’ unfunded liabilities above what districts already owe in a given year. This action would reduce school districts’ unfunded liabilities and provide annual savings to school districts over the next few decades.
These savings could be significant. Given the estimate of savings is based on future investment returns and other economic and demographic assumptions, however, there is uncertainty about the ultimate amount districts would save. Using a recent CalSTRS analysis that included thousands of possible scenarios, estimated savings over the next few decades from a $1 billion supplemental payment likely could range from $1 billion to $3.3 billion (including the $1 billion supplemental payment). Overall, the average savings was $2.3 billion and in 75 percent of scenarios, the savings exceeded $1 billion. In general, it is our understanding that a supplemental payment to CalPERS has a higher probability of achieving savings over the next few decades. Ultimately, each district’s share of any CalSTRS or CalPERS savings would be proportional to its share of payroll covered by that pension system.
State Could Reduce Districts’ Pension Costs This Budget Year
Immediate Savings Could Be Achieved Through One‑Time Contribution Rate Relief. An alternative option is to provide immediate budget relief by using one‑time funds to lower the cost of districts’ CalSTRS or CalPERS contributions specifically in 2020‑21. Under this alternative, the state’s payment would cover a portion of the contribution that school districts otherwise would be required to make—resulting in a lower effective contribution rate for that year. While this approach would reduce costs to school districts in the budget year, it would have no effect on districts’ outstanding, unfunded liabilities or future contribution requirements. Consequently, such a payment would not result in savings beyond the budget year.
Unique Case Can Be Made for Small Amount of One‑Time CalSTRS Relief. While we think achieving longer‑term savings would be more beneficial to districts than one‑time savings, providing a small amount of a one‑time CalSTRS rate relief in 2020‑21 deserves some special consideration. Districts’ effective CalSTRS rate (as a percent of payroll) is scheduled to increase from 17.1 percent in 2019‑20 to 18.4 percent in 2020‑21, then decrease to around 18.1 percent in 2021‑22 (and remain approximately flat thereafter). One‑time funds could be used to eliminate this rate hump, allowing for smoother increases over the next few years. For example, the state could use one‑time funds to lower districts’ contribution rate by 0.8 percent of payroll in 2020‑21, meaning districts’ effective rate would increase by 0.5 percent in 2020‑21 and another 0.5 percent in 2021‑22. We estimate this rate smoothing would cost approximately $300 million. (All other one‑time funds could be used for supplemental payments to provide districts longer‑term savings.)
The Minimum Guarantee
In this section, we provide background on the Proposition 98 minimum guarantee, analyze the administration’s estimates of the guarantee, and explain how the guarantee could change in response to updated revenue estimates.
Background on Minimum Guarantee
Proposition 98 Established the Minimum Guarantee. Proposition 98 (1988) established a minimum funding requirement for schools and community colleges commonly known as the minimum guarantee. The state meets the guarantee through a combination of General Fund and local property tax revenue.
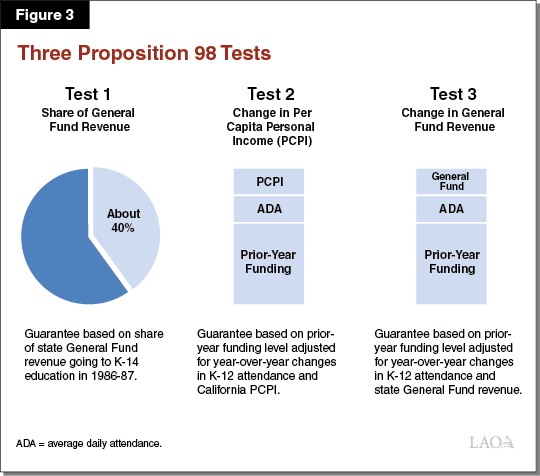
Minimum Guarantee Depends Upon Various Inputs and Formulas. The California Constitution sets forth three main tests for calculating the minimum guarantee. Each test has certain inputs. The most notable inputs are General Fund revenue, per capita personal income, and student attendance (Figure 3). Whereas Test 2 and Test 3 build upon the amount of funding provided the previous year, Test 1 links school funding to a minimum share of General Fund revenue (about 40 percent). The Constitution sets forth rules for comparing the tests, with one of the tests becoming operative and used for calculating the minimum guarantee that year. Although the state can provide more funding than required, in practice it usually funds at, or near, the guarantee. With a two‑thirds vote of each house of the Legislature, the state can suspend the guarantee and provide less funding than the formulas require that year.
At Key Points, the State Recalculates Minimum Guarantee. The guarantee typically changes from the level initially assumed in the budget act as a result of updates to the relevant Proposition 98 inputs. The state continues to update Proposition 98 inputs until the following May after the close of a fiscal year. If these updates show that the revised minimum guarantee exceeds the initial estimate, the state makes a one‑time payment to “settle up” the difference. The Legislature can allocate these settle‑up payments for any school or community college program.
Proposition 98 Reserve Has Rules for Deposits and Withdrawals. Proposition 2 (2014) created a state reserve specifically for schools and community colleges—the Public School System Stabilization Account (Proposition 98 Reserve). The Constitution requires the state to deposit Proposition 98 funding into this account when the minimum guarantee is growing relatively quickly and other conditions are met (see the nearby box). When the guarantee is growing relatively slowly, the Constitution requires the state to withdraw funds from the reserve and allocate them for school and community college programs. The state continues to update its calculation of any required deposits or withdrawals for up to nine months after the close of the fiscal year.
Key Rules Governing the Proposition 98 Reserve
Below, we describe the rules governing Proposition 98 Reserve deposits and withdrawals.
Deposits Predicated on Four Main Conditions. To determine whether a deposit is required, the state first determines whether all of the following conditions are met:
- Revenues From Capital Gains Are Relatively Strong. Deposits are required only when the state receives an above‑average amount of revenue from taxes paid on capital gains (a relatively volatile source of General Fund revenue).
- Test 1 Is Operative. Test 1 years historically have been associated with relatively strong growth in the minimum guarantee due to strong growth in state revenue.
- Formulas Are Not Suspended. If the Governor declares a “budget emergency” (based on a natural disaster or slowdown in state revenues), the Legislature can reduce or cancel a Proposition 98 Reserve deposit. Additionally, if the Legislature votes to suspend the minimum guarantee, any required deposit is automatically canceled.
- Obligations Created Before 2014‑15 Are Retired. Proposition 2 (2014) specified that no deposits would be required until the state paid certain school funding obligations (known as “maintenance factor”) that it accrued during the Great Recession. The state met this condition starting in 2019‑20.
Amount of Deposit Depends Upon Additional Formulas. If the state determines that the conditions for a deposit are satisfied, it performs several calculations to determine the size of the deposit. Generally, the size of the deposit tends to increase when the revenue from capital gains is relatively high and the guarantee is growing quickly relative to inflation. More specifically, the deposit equals the lowest of the following four amounts:
- The Portion of the Guarantee Attributable to Above‑Average Capital Gains. The state calculates what the Proposition 98 guarantee would have been if the state had not received any revenue from capital gains in excess of the historical average. Deposits are capped at the difference between the operative guarantee and the hypothetical alternative guarantee without the additional capital gains revenue.
- The Difference Between Test 1 and Test 2 Levels. Deposits are capped at the difference between the higher Test 1 and lower Test 2 funding levels.
- Growth Relative to the Prior Year. The state calculates how much funding schools and community colleges would receive if it adjusted the previous year’s funding level (excluding any deposits that year) for changes in student attendance and inflation. The inflation factor is the higher of the cost‑of‑living adjustment or growth in per capita personal income. Deposits are capped at the difference between the Test 1 funding level and the inflation‑adjusted prior‑year funding level.
- Room Available Under a 10 Percent Cap. The Proposition 98 Reserve has a cap equal to 10 percent of all funding allocated to schools and community colleges. Deposits are only required to the extent the existing balance is below this threshold.
Withdrawals Required When Guarantee Is Growing Relatively Slowly. Proposition 2 requires the state to withdraw funds from the Proposition 98 Reserve if the minimum guarantee is not growing quickly enough to support the prior‑year funding level, as adjusted for student attendance and inflation.
Administration’s Estimates of the Minimum Guarantee
Minimum Guarantee Revised Upward in 2018‑19 and 2019‑20. Compared with the estimates included in the June 2019 budget plan, the administration revises its estimates of the minimum guarantee to increase by $302 million in 2018‑19 and $517 million in 2019‑20 (Figure 4). In 2018‑19, the increase mainly reflects higher estimates of local property tax revenue. (In Test 1 years like 2018‑19 and 2019‑20, changes in local property tax revenue directly affect the level of the minimum guarantee. They do not offset General Fund spending.) In 2019‑20, the increase in the minimum guarantee mainly reflects higher General Fund revenue.
Figure 4
Tracking Changes in Proposition 98 Guarantee
(Dollars in Millions)
|
2018‑19 |
2019‑20 |
||||||
|
June 2019 Estimate |
January 2020 Estimate |
Change |
June 2019 Estimate |
January 2020 Estimate |
Change |
||
|
Minimum Guarantee |
|||||||
|
General Fund |
$54,445 |
$54,505 |
$61 |
$55,891 |
$56,405 |
$514 |
|
|
Local property tax |
23,701 |
23,942 |
241 |
25,166 |
25,168 |
3 |
|
|
Totals |
$78,146 |
$78,448 |
$302 |
$81,056 |
$81,573 |
$517 |
|
|
Operative Test |
2 |
1 |
yes |
1 |
1 |
no |
|
2020‑21 Guarantee Increases $2.5 Billion Over Revised 2019‑20 Level. The administration estimates that the minimum guarantee is $84 billion in 2020‑21, an increase of $2.5 billion (3 percent) over the revised 2019‑20 level (Figure 5). Test 1 is operative, with the guarantee receiving about 40 percent of the General Fund revenue projected for 2020‑21. Growth in General Fund revenue and local property tax revenue each account for about half of the increase in the guarantee.
Figure 5
Proposition 98 Key Inputs and Outcomes Under Governor’s Budget
(Dollars in Millions)
|
2018‑19 |
2019‑20 |
2020‑21 |
|
|
Minimum Guarantee |
|||
|
General Fund |
$54,505 |
$56,405 |
$57,573 |
|
Local property tax |
23,942 |
25,168 |
26,475 |
|
Totals |
$78,448 |
$81,573 |
$84,048 |
|
Change From Prior Year |
|||
|
General Fund |
$1,554 |
$1,899 |
$1,168 |
|
Percent change |
2.9% |
3.5% |
2.1% |
|
Local property tax |
$1,317 |
$1,226 |
$1,307 |
|
Percent change |
5.8% |
5.1% |
5.2% |
|
Total guarantee |
$2,871 |
$3,126 |
$2,475 |
|
Percent change |
3.8% |
4.0% |
3.0% |
|
Operative Test |
1 |
1 |
1 |
|
Growth Rates |
|||
|
K‑12 average daily attendance |
‑0.8% |
‑0.1% |
‑0.3% |
|
Per capita personal income (Test 2) |
3.7% |
3.9% |
4.1% |
|
Per capita General Fund (Test 3)a |
6.2% |
4.0% |
2.0% |
|
Proposition 98 Reserve |
|||
|
Deposit (+) or withdrawal (‑) |
— |
$524 |
‑$38 |
|
Cumulative balance |
— |
524 |
487 |
|
aAs set forth in the State Constitution, reflects change in per capita General Fund plus 0.5 percent. Note: No maintenance factor obligation is created, paid, or owed over the period. |
|||
Additional Reserve Deposit Required in 2019‑20. As part of the 2019‑20 budget plan, the state made its first deposit into the Proposition 98 Reserve ($377 million). The size of this deposit was determined by the difference between the Test 1 and Test 2 funding levels (described in the previous box). Due to the administration’s higher estimate of the minimum guarantee, this difference has increased to $524 million. The Governor’s budget accordingly provides for an additional deposit of $148 million to meet the higher requirement.
Small Withdrawal Required in 2020‑21. Under the Governor’s budget, the minimum guarantee in 2020‑21 is $38 million below the inflation‑adjusted funding level from 2019‑20. The Constitution requires the state to make up this difference by withdrawing a corresponding amount of funding from the Proposition 98 Reserve. This withdrawal reduces the balance in the reserve to $487 million.
Comments
Estimates of General Fund Revenue Are Reasonable... Of all the factors affecting the calculation of the minimum guarantee, estimates of General Fund revenue typically are the most volatile. Relative to the revenue estimates we prepared for The 2020‑21 Budget: California’s Fiscal Outlook, the administration’s estimates are similar in 2018‑19, higher in 2019‑20, and lower in 2020‑21. Across all three years, however, the administration’s estimates are very close to ours—being less than $100 million below our estimates (roughly 0.01 percent of total tax collections). Given these similarities, we think the administration has provided a reasonable starting point for estimating the minimum guarantee.
…But Have Some Downside Risk. Although the administration’s revenue estimates seem reasonable based on current economic conditions, some signs suggest the economy could slow in the coming months. For example, housing markets have been stagnant, job growth is down, and trade activity is decreasing. Though these signs do not necessarily mean a broader economic slowdown is imminent, they do suggest a higher level of risk for state revenue estimates compared to previous budget cycles.
Guarantee Is Moderately Sensitive to Changes in Revenue Estimates Over the Period. To the extent estimates of General Fund revenue are higher or lower by May, the minimum guarantee would likewise be affected. In general, the relationship between revenue and the minimum guarantee depends on which Proposition 98 test is operative and whether another test could become operative with higher or lower revenue. Under our outlook, Test 1 is the operative test each year of the budget period. After examining many scenarios, we found that the operative test is unlikely to change in 2019‑20 or 2020‑21. Holding other factors constant, Test 1 would be operative given any level of General Fund revenue. This is due mainly to consistent declines in student attendance over the budget period, a trend that contributes to Test 1 being operative. In Test 1 years, the guarantee increases or decreases about 40 cents for each dollar of higher or lower General Fund revenue.
Changes in Revenue Would Affect Guarantee and Size of Reserve Deposits. Changes in revenue estimates and the minimum guarantee likely would affect the amount of funding the state is required to set aside in the Proposition 98 Reserve. If revenue were to decrease in 2019‑20 or 2020‑21, the state likely would be required to make a smaller deposit (in 2019‑20) or withdraw additional funding (in 2020‑21) from the Proposition 98 Reserve. These changes in the Proposition 98 Reserve level could help insulate school and community college programs from drops in the minimum guarantee—though given the relatively small amount currently in the reserve, this buffer would disappear quickly. On the upside, an increase in revenue would tend to require a larger deposit (in 2019‑20) or smaller withdrawal (in 2020‑21), potentially leaving little of the increase available for new spending. (Our analysis holds all inputs other than revenue constant, though changes in these inputs also could affect the guarantee and the reserve.)
Property Tax Estimates Somewhat Above Our Projections. Estimates of local property tax revenue are the other significant factor affecting the minimum guarantee when Test 1 is operative. Relative to our November outlook, the administration assumes schools and community colleges receive somewhat more property tax revenue from local Educational Revenue Augmentation Funds (accounts that shift funding between schools and other local agencies). It also projects slightly faster growth in assessed property values. On the other hand, the administration has somewhat lower estimates of property tax revenue attributable to former redevelopment agencies (the state dissolved these agencies in 2011‑12). Overall, the administration’s property tax estimates are $671 million above our November estimates over the budget period. The majority of this difference is attributable to the administration’s higher Educational Revenue Augmentation Funds assumptions. To the extent that local property tax revenue differs from the administration’s January estimates, the minimum guarantee would change on a dollar‑for‑dollar basis. (As with General Fund revenue, changes in local property tax revenue also could affect the size of reserve deposits or withdrawals.)
Local Control Funding Formula
In this section, we provide background on LCFF, describe the administration’s proposal and associated projections for LCFF costs, and assess those projections.
Background
State Enacted New School Funding Formula in 2013‑14. Prior to LCFF, the state distributed school funding through a combination of general purpose grants (called “revenue limits”) and more than 40 state categorical programs. Districts could use general purpose grants for any educational purpose but had to spend categorical funding on state‑prescribed activities. In the years leading up to LCFF, policy makers were concerned this system had adverse effects. Notably, the system was characterized by a lack of coordination across programs, a compliance‑based rather than student‑based mindset, a disconnect between funding and student costs, historic funding inequities, and limited local control. In response, the state eliminated most categorical programs in 2013‑14, replacing the previous general purpose grants and program‑specific funding formulas with one new formula.
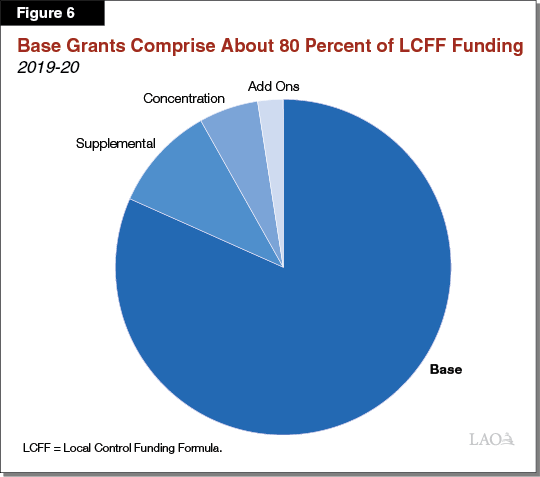
LCFF Has Three Main Components Plus “Add Ons.” LCFF consists of base, supplemental, and concentration grants, as well as several small add ons. Figure 6 shows the share of total LCFF funding attributable to each of these components. We describe each component below.
- Base Grants. The largest component of LCFF is a base grant generated by each student. The number of students is measured using average daily attendance (ADA). Base funding rates differ by grade span, with students in higher grade spans generally generating more funding than those in lower grade spans. The state set per‑student base LCFF funding targets about $500 higher than pre‑recession funding levels adjusted for inflation. Districts may use base funding for any educational purpose.
- Supplemental Grants. For each student who is an English Learner or low income (EL/LI), a district receives a supplemental grant equal to 20 percent of the base grant. A student who is both EL and LI generates the same funding rate as a student who belongs to only one of these groups. Districts must use this funding for the benefit of EL/LI students.
- Concentration Grants. Districts serving a student population of more than 55 percent EL/LI also receive a concentration grant equal to 50 percent of the base grant for each EL/LI student above the 55 percent threshold. Districts also must use this funding for the benefit of EL/LI students.
- Add Ons. The largest add ons are associated with two historical categorical programs—one supporting targeted instructional support and the other supporting home‑to‑school transportation. Though the state no longer requires districts to operate these specific programs, districts continue to receive their 2012‑13 allocations for them.
State Reached LCFF Funding Targets in 2018‑19. In 2013‑14, the state estimated LCFF would cost $18 billion more than the previous system due to its higher per‑student funding targets. Given the size of this additional cost, the state anticipated fully phasing in the rate increases in 2020‑21. Instead, the state slightly surpassed funding targets in 2018‑19.
Since Full Implementation, State Policy Has Been to Adjust LCFF Funding Rates for COLA. Following full implementation, the state adopted a policy of automatically adjusting LCFF per‑student rates for COLA. The specific COLA rate is linked to a national price index designed to reflect the cost of goods and services purchased by state and local governments across the country—the state and local government price index. This index is developed by the federal Bureau of Economic Analysis (a division of the U.S. Department of Commerce).
State Adopted COLA Cap Last Year. Trailer legislation included in the 2019‑20 budget package added a provision that automatically reduces the COLA rate under certain conditions. Specifically, in years in which growth in the Proposition 98 minimum guarantee is insufficient to fund an LCFF increase based on the state and local government price index, the LCFF COLA is reduced to fit within the guarantee.
State Estimated to Spend $63 Billion for LCFF in 2019‑20. LCFF is by far the state’s largest education program. With $42.3 billion supported by the state General Fund (and $20.6 billion supported by local property tax revenue), LCFF also is the largest component of the state’s General Fund budget.
Governor’s Proposal
Provides $1.2 Billion Increase to Make Growth and COLA Adjustments. In keeping with recent state practice, the administration’s largest ongoing augmentation is for LCFF. Specifically, the Governor’s budget for 2020‑21 includes a $1.2 billion increase to LCFF, which reflects funding for a projected 2.29 percent COLA, slightly offset by a projected 0.3 percent decline in ADA. The augmentation brings total LCFF funding in 2020‑21 to $64 billion.
Assessment
Projected COLA Rate and Associated Cost Increase for 2020‑21 in Line With Our Estimates. Using the latest data available, we estimate the 2020‑21 COLA rate is 2.14 percent—roughly tracking with the administration’s estimate of 2.29 percent. The estimated rate will change based upon the release of further data updates over the coming months, with the state locking down the rate in late April 2020. Given the relatively modest growth rate in the federal government’s price index, we believe the administration will likely revise its estimate slightly downward as part of the May Revision.
Special Education
Below, we provide background on special education services and financing, describe the Governor’s proposals to reform these aspects of special education, assess these proposals, and offer associated recommendations.
Background
Federal Law Requires Schools to Provide Students With Disabilities Individualized Education Programs (IEPs). Special education is instruction designed to meet the unique needs of each child with a disability. As a condition of receiving federal funding, the Individuals with Disabilities Education Act requires schools to identify all students with disabilities and provide them individualized support beginning at the age of three. The specific support provided to each student is detailed in his or her IEP, a legal document developed by the student’s teachers, parents, and school administrators. Support services may include specialized academic instruction, speech therapy, physical therapy, counseling, or behavioral intervention services. In 2018‑19, 11.7 percent of K‑12 students received special education in California.
Schools Must Serve Students With Disabilities in the Most Inclusive Setting. Federal law generally requires districts to serve students with disabilities in the educationally appropriate setting that offers the most opportunity to interact with peers who do not have disabilities. The intent is to provide an “inclusive setting” where students with disabilities are taught alongside their peers in general education classrooms with appropriate services. These students may receive special education services within the general education classroom (for example, having an aide or interpreter work with them one on one) or in separate pull‑out sessions (for example, having a one‑on‑one speech therapy session). Other inclusive models may include instruction designed for students with varying learning needs or co‑teaching, where a special education teacher and general education teacher collaboratively teach a class that includes students with and without disabilities. In 2017‑18, 56 percent of all students with disabilities in California were educated in an inclusive setting—placing California 40th out of 47 states for which data are available.
Special Education Supported by Combination of General Purpose and Categorical Funds. Schools receive billions of dollars each year (mostly from LCFF) to educate all students, including students with disabilities. These funds can be used for any educational purpose but primarily cover general education costs such as teacher compensation. Beyond these general education costs, schools incur additional costs to serve students with disabilities (for example, to provide specialized support and adaptive equipment). To help cover these additional costs, both the state and federal governments provide categorical funding specifically for special education. These fund sources together cover about 40 percent of the additional cost of special education services. Schools cover remaining special education costs with general purpose funding (mostly from LCFF).
Most Funding Allocated to Special Education Local Plan Areas (SELPAs). State law requires school districts, charter schools, and county offices of education—collectively referred to as local education agencies (LEAs)—to participate in a SELPA, which is typically a regional consortium of entities that coordinate special education services. Large districts are allowed to serve as their own SELPAs. Most state and federal special education funding is allocated directly to SELPAs. Each SELPA decides how to allocate its special education categorical funding among its members.
State Provides Most Categorical Funding Based on Overall K‑12 Student Attendance. About 80 percent of state special education funding is allocated by a base rate formula commonly called AB 602 (after its enacting legislation in 1997). The formula distributes funding based on total student attendance rather than a more direct measure of special education costs (for example, the number of students identified for special education or the cost of services provided). The formula uses the greater of the current year’s or prior year’s overall attendance. The AB 602 approach ensures schools have little incentive to overidentify students for special education or serve these students in unnecessarily expensive ways. The federal government also allocates most of its special education funding based on overall student attendance.
AB 602 Base Rates Vary by SELPA. Under AB 602, SELPAs are funded based on overall attendance, but the per‑student rate each SELPA receives varies across the state—ranging from $557 to $960 per student in 2019‑20. As described in the nearby box, this variation was present when the state first shifted to the AB 602 model in the late 1990s. Over the last 20 years, the state has occasionally provided funding augmentations to increase base rates for SELPAs with below average rates.
History of Special Education Funding in California
State Has Overhauled Special Education Funding System Twice Previously. State special education funding has gone through three distinct eras. First, between 1860 and 1980 the state created a patchwork system of special education categorical programs mostly based on specific types of disabilities. Second, in 1980 the state introduced a somewhat simpler funding formula—commonly referred to as J‑50—that was based on the types of services provided. Finally, in 1997 the state introduced an even simpler formula commonly known as AB 602 (Davis) that is based on total student attendance.
Earliest System Had Array of Programs and Major Shortcomings. Starting in 1920, the state gradually developed a complex system for funding special education, eventually encompassing almost a dozen categorical programs. Each program had distinct funding rates, eligibility, and programmatic requirements. The system of categorical programs had various limitations. Most notably, the system encouraged schools to identify students with whichever disability generated the most funding rather than whichever best described their specific challenges.
Second System Funded Based on Specific Services Provided. To address these weaknesses, the state overhauled its special education policies between 1975 and 1980. California introduced a simpler funding system commonly referred to as the J‑50 system (after the associated compliance form). This system was based on three types of special education services: (1) special day classes which only students with disabilities attend, (2) resource teachers who provide pull‑out instructional support for students with disabilities served in general education classrooms, and (3) services provided by specialists such as physical therapy. During this time, California also began requiring all districts to organize into special education local plan areas (SELPAs), which would be responsible for coordinating regional special education services.
Second System Also Proved Complicated and Problematic in Practice. In theory, the J‑50 system simplified special education funding, but in practice, it replaced one set of complications with another. The system established unique funding rates for each SELPA based on a statewide survey of special education costs in 1979‑80. Though these rates closely tracked special education costs the first few years after 1980, the state’s failure to update its cost survey resulted in seemingly arbitrary funding inequities by the mid‑1990s. Most importantly, the J‑50 system encouraged schools to serve students with severe disabilities in special day classes, as the funding generated for serving students with disabilities in general education classrooms was intended only to cover students with relatively mild disabilities.
Current Funding System Intended to Simplify and Address Unequal Funding. The state overhauled the funding system for a second time in 1997 with the passage of AB 602. The state shifted to a formula based on overall student attendance to eliminate the complexity and bad incentives characterizing the J‑50 system. However, in transitioning from the J‑50 system, the state set each SELPA’s per‑student funding rate by using its total funding in the last year under the J‑50 system. Because funding rates varied notably under the J‑50 system, the new rates established under AB 602 also varied notably. In an effort to equalize these rates, the state allocated funding in the late 1990s, early 2000s, and in 2019‑20 to increase rates for SELPAs below the statewide per‑student average. Despite unequal rates, AB 602 largely realized the state’s original goals of simplifying funding and removing inappropriate incentives regarding the provision of services.
State Provides Remaining Categorical Funding Through Various Add Ons. In addition to the base funding from AB 602, SELPAs may receive funding from the state’s many special education categorical programs, as summarized in Figure 7. The distribution and spending restrictions of these categorical funds vary. Three of these categorical programs—mental health services, SELPA administration, and professional development—are allocated to all SELPAs based on overall attendance. The Out‑of‑Home Care program provides funding for students living in licensed group homes or health facilities. Funding for group homes and foster children have been held in place since 2016‑17 due to state reforms that phased out the use of group homes. The remaining programs provide funding based on a variety of other factors, such as the size of the SELPA, the number of students with high‑cost placements or low‑incidence disabilities, or the participation in employment training programs.
Figure 7
California Funds Many Special Education Programs
2019‑20 (In Millions)
|
Program |
Distribution Method |
Spending Restrictions |
Funding |
|
AB 602a |
Overall student attendance. |
Any special education expense. |
$3,412 |
|
Preschool |
Per‑child funding for three‑ and four‑year olds with disabilities (one time). |
None. |
493 |
|
Mental health services |
Overall student attendance. |
Mental health services for students with disabilities. |
386 |
|
Out‑of‑Home Care |
Location and capacity of Licensed Children’s Institutions. |
Any special education expense. |
144 |
|
SELPA administration |
Overall student attendance. |
SELPA‑level services, including data management and required reporting. |
100 |
|
Infants and toddlers |
Number of infants and toddlers with special needs served. |
Early intervention services for infants and toddlers with special needs. |
83 |
|
Workability |
Number of students enrolled in employment training programs. |
Job placement and training for students with disabilities. |
40 |
|
Low‑incidence disabilities |
Number of students who are deaf, hard of hearing, visually impaired, or orthopedically impaired. |
Services and materials for students with qualifying conditions. |
19 |
|
Technical assistance leads |
Competitive. |
Support services. |
10 |
|
Extraordinary cost pools |
Individual student placements. |
Expenses associated with very high‑cost residential or nonpublic school placements. |
6 |
|
Necessary Small SELPAs |
Attendance in SELPAs serving fewer than 15,000 students. |
SELPA‑level services, including coordination, data management, required reporting, and fiscal administration. |
3 |
|
Professional Development |
Overall student attendance. |
Staff development related to special education. |
1 |
|
Total |
$4,697 |
||
|
aSpecial education program named after authorizing legislation—Chapter 854 of 1997 (AB 602, Davis). SELPA = special education local plan area. |
|||
Federal Law Requires “Maintenance of Effort” (MOE) on State and Local Spending. In order to receive federal special education funding, both states and LEAs must spend at least as much on special education each year as they did the preceding year. States and LEAs may choose whether their MOE is calculated on the basis of total special education spending or per‑student spending. By “locking in” increased expenditures, this requirement offers an additional incentive for the state and LEAs to contain special education costs.
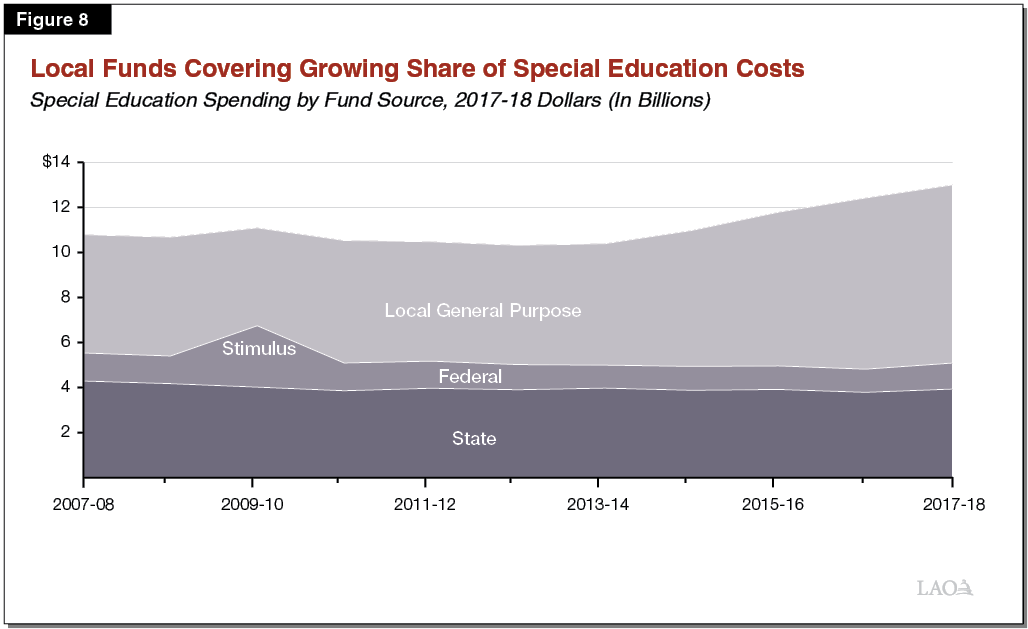
Special Education Expenditures Have Increased Faster Than Associated Funding. Figure 8 shows inflation‑adjusted special education expenditures by fund source between 2007‑08 and 2017‑18. During this ten‑year period, total state and federal special education funding declined (in inflation‑adjusted terms) due to the drop in overall student attendance. However, total special education expenditures increased, largely driven by a growing number of students with relatively severe disabilities requiring more intensive services. Most notably, the share of students with autism has increased from 1 in 600 in 1997‑98 to 1 in 50 in 2017‑18. Expenditures also have increased as a result of schools increasing staff salaries and being required to make larger pension contributions on behalf of their employees. As a result, local general purpose funding has been covering an increasing share of special education expenditures, rising from about 45 percent ten years ago to about 60 percent today.
Special Education Expenditures Vary by Region. In per‑student terms, special education expenditures vary notably among SELPAs. We estimate SELPAs spent an average of about $2,000 per student in 2017‑18 (spreading costs across all students in the region). Per‑student spending among SELPAs ranged from about $600 to more than $4,000. Special education expenditures vary by region for at least three reasons. First, the overall incidence of students with disabilities varies across the state. Second, even SELPAs serving similar proportions of students with disabilities may differ in the intensity of their services. Third, the cost of providing specific special education services varies by region, largely because of differences in the compensation packages that LEAs provide teachers and specialists.
Students With Disabilities Tend to Have Poorer Outcomes Than Other Students. Students with disabilities perform worse than students without disabilities across several measures. Based upon the most recent data, students with disabilities had low scores on standardized tests of reading and math—scoring as a group at the 18th percentile of all test takers. Students with disabilities also have notably lower graduation rates compared to other student groups. In 2017‑18, the four‑year graduation rate for students with disabilities was 65 percent, compared to 83 percent of students statewide. Some students with disabilities, however, just take longer to graduate. Of the students with disabilities exiting high school in 2017‑18, 76 percent left with a high school diploma. Of the remaining students, 13.6 percent dropped out, 3.4 percent aged out (reaching age 22), and 7 percent received an alternative certification called a certificate of completion. (Students can receive a certificate of completion if their IEP team determines they are unlikely to meet all requirements for high school graduation, but can meet an alternative set of requirements developed by the IEP team.)
Current‑Year Budget Included $645 Million One‑Time Funding for Preschool and Low‑Funded SELPAs. The 2019‑20 budget provided $493 million one‑time funding to districts based on the number of preschool‑aged children with disabilities they serve—$9,010 per child. Although districts are required to provide special education services for this age group, the current‑year budget is the first time the state has provided funding for this purpose. Districts were not required to use these funds for additional services. Thus, funds likely will be used to cover the costs of existing preschool services. The 2019‑20 budget also included $153 million one‑time funding to increase AB 602 rates for SELPAs funded below the statewide average of $557 per student.
Current‑Year Augmentations Made Contingent on Future Special Education Reforms. The 2019‑20 budget package also included language specifying that the $645 million in augmentations would only be ongoing if the Legislature makes statutory changes in the 2020‑21 budget designed to improve the academic outcomes of students with disabilities. The specific reforms are to be determined collaboratively by the Legislature and the administration but may include a reconsideration of the role of SELPAs, an expansion of inclusive instructional practices, support for addressing disproportionate identification and placement of certain student subgroups, and review of special education funding allocations.
Governor’s Proposals
Proposes a Multi‑Phased Approach Aimed at Improving Special Education. Given the language in the 2019‑20 budget prompting special education reform, the administration engaged with various stakeholders in the summer and fall of 2019. The administration identified several challenges informed by these discussions, including growing student mental health and social‑emotional needs, teachers not prepared to adapt instruction to students with diverse needs, shortages in special education teachers and specialists, and the lack of clear and consistent messaging from the state to promote inclusive practices that improve outcomes for all students. To address these issues, the Governor proposes to make reforms in special education financing and other areas over a multiyear period.
First Phase Makes $645 Million Augmentation From 2019‑20 Ongoing to Modify Base Formula. The Governor proposes to increase the base rate for most SELPAs to $660 per student. To fund the base rate increase, the Governor proposes to make ongoing the $645 million augmentation provided in 2019‑20. SELPAs that currently have higher rates than the proposed new base rate would be held harmless. The Governor also proposes to modify the base formula to use a three‑year rolling average of student attendance, rather than the greater of the current year or prior year. The average would be calculated for each LEA, but funding would continue to be allocated to SELPAs.
Freezes Categorical Funding and SELPA Membership. In anticipation of future changes to special education funding, the Governor’s budget proposes to freeze allocations for most special education categorical programs at 2019‑20 levels, adjusted for cost of living. In addition, the Governor proposes to prohibit LEAs from changing SELPAs through 2023‑24.
Future Phases to Be Informed by a Privately Funded Study. In the fall of 2019, a study of special education funding in California was commissioned using private foundation funding to potentially inform future changes to the special education funding formula. The scope of the study was developed with input from the administration, the State Board of Education, and the California Department of Education (CDE). Our understanding is the study is expected to recommend a new funding model aimed at addressing variation in student needs and costs, promoting inclusive practices, and encouraging early intervention and identification of students with disabilities. The study is expected to be completed within the next year.
Proposes $1.1 Million for a Governance Study and Two Workgroups to Inform Future Phases. The Governor’s budget provides $500,000 on a one‑time basis to fund a study on special education governance and accountability. The study would provide recommendations on (1) improving delivery of special education services, (2) improving student outcomes, (3) ensuring equitable distributions of services to LEAs, and (4) identifying strategies and challenges for funding and services under the current and recommended models. The findings of the study would be reported to the Legislature by October 1, 2021. The budget also includes a combined $600,000 one time to convene two workgroups. Of this amount, $350,000 is for a workgroup to develop a standardized IEP template and consider the feasibility of a statewide IEP reporting system. The remaining $250,000 is for a workgroup to develop alternate pathways for students with disabilities to receive a high school diploma. Both workgroups would include the Department of Rehabilitation, the Department of Developmental Services, LEAs, SELPAs, legislative staff, and relevant experts. The time frame and the of the workgroups would be similar to that of the governance study.
Includes $250 Million in One‑Time Funding for Preschool Services. The Governor’s budget includes $250 million in one‑time funding to be allocated to districts based on the number of preschool‑aged children with disabilities served by the district. In contrast to the preschool funds provided in 2019‑20, the Governor intends this funding to increase or improve program services.
Provides $4 Million One Time to Create the California Dyslexia Initiative. The Governor proposes to designate a county office of education (COE) to promote best practices regarding the treatment of dyslexia across the state. The COE would find effective models that identify and support students with dyslexia and other specific learning disabilities, create professional development on effective instruction for these students, and host a statewide conference by the end of 2020 to disseminate relevant information and resources. The COE would lead the initiative in partnership with a designated university.
Assessment
Proposal Generally Aligned With Original Legislative Intent. By reducing variations in SELPA base rates, the Governor’s proposal addresses special education funding inequities that have persisted for decades. Moreover, the proposal is consistent with the original intent of AB 602 and our office’s past recommendations.
Three‑Year Average Would Smooth Funding Changes for Districts With Declining Attendance. Given statewide student attendance has been declining since 2013‑14 and is projected to continue declining over the next decade, shifting to a three‑year average would help smooth the associated drops in special education base funding for the majority of districts. In contrast, for the smaller share of districts that are growing, a rolling average would result in annual funding increases somewhat smaller than their growth in attendance.
Unclear How Proposed Reforms Address Key Challenges in Special Education. In explaining the rationale for its proposal, the administration cites several key challenges in special education, such as teachers not being fully prepared for inclusive classrooms and an increasing need for mental health and social‑emotional support for students. However, the nexus between these challenges and the special education funding model remains unclear. The AB 602 base formula provides schools with broad flexibility to use funding in ways that align with the needs of their students, including promoting inclusive classrooms and providing additional student services. Similarly, we do not see a clear connection between the current special education governance system and the challenges cited by the administration.
Current Approach to Studying Problem Limits Legislative Input. Many of the key challenges cited by the administration align with issues the Legislature has deemed key priorities. However, the privately funded study—which may ultimately inform future proposals from the administration—was initiated, funded, and developed outside of the legislative process. This approach leaves little room to ensure the Legislature’s concerns are incorporated in the study. Although the Legislature will be able to review any new funding model that the administration proposes in the future, this provides limited time for the administration to then directly address any concerns that the Legislature may have about the proposed model. For instance, the privately funded study is expected to make recommendations to address the higher costs of serving students with severe disabilities. Providing more funding to LEAs for children with more severe disabilities could address this concern, but also could create incentives for LEAs to overidentify students with disabilities. The Legislature would need sufficient time to evaluate these considerations.
Base Funding Does Not Include Count of Preschool‑Aged Children. Although the federal government requires districts to begin providing special education to children with disabilities on their third birthdays, the AB 602 base formula does not include student attendance for this age group. This is primarily because most children in this age group do not attend school and the state does not collect data on the number of preschoolers who live within each school district’s attendance boundary. As a result, the state provides no funding to account for the costs associated with serving these children. Districts cover related costs with a combination of federal funding and general purpose funding.
One‑Time Preschool Funding Sends Confusing Message to Districts. The administration intends for the one‑time preschool funding to be used to increase or improve services for children. Based on our conversations with various special education stakeholders, effectively increasing or improving services typically requires ongoing spending increases—particularly for hiring additional staff. However, given the one‑time nature of these funds, schools are unlikely to hire additional staff to support these new services. Instead, the funding likely will be used for one‑time activities, such as professional development or technology purchases. Districts are also discouraged from using this funding to provide additional IEP‑related services, as this would raise their local MOE.
Recommendations
Adopt Governor’s General Approach to Modifying Base Funding Formula. We recommend the Legislature adopt the Governor’s general approach of using the $645 million augmentation provided last year to develop new AB 602 base rates. The approach is aligned with the original intent behind AB 602 to eliminate historical variations in base rates. We also recommend adopting the proposed three‑year average of attendance to calculate base funding. This will smooth drops in funding due to declining student attendance in many districts across the state.
Use One‑Time Preschool Funding for an Ongoing Base Increase, Incorporate Preschoolers Into the Base. We recommend the Legislature make the proposed $250 million for one‑time preschool funding, instead, an ongoing base augmentation to fund the addition of preschool‑aged children into the base formula. Expanding the base formula to include preschool‑aged children would allow the state to recognize local costs associated with serving this age group. To address the lack of preschool attendance data, we recommend modifying the base formula to double‑count kindergarten attendance for LEAs that provide preschool, effectively using kindergarten attendance as a proxy for preschool attendance.
Fund Studies and Workgroups Based on Legislative Priority. Considering the administration plans on addressing special education issues over a multiyear period, the Legislature may want to think carefully about what issues it would like to ensure are addressed. To the extent that additional research or stakeholder input may be helpful, the Legislature could consider funding other studies and/or workgroups this year to help inform future changes to special education. Below we describe two options the Legislature could consider:
- Reforms to Special Education Categorical Programs. The Legislature could fund a study or workgroup that makes recommendations for simplifying or updating the state’s special education categorical programs. Many of these programs merit a careful review to ensure they are an effective way to distribute funding. Funding for the Out‑of‑Home Care program has been partially frozen since 2016‑17 because its allocation formula is no longer applicable. Some programs, such as employment training and funding for infant and toddlers, were first established in the 1980s and are only allocated to certain LEAs. The privately funded study may examine some of these issues, but a narrower, specific study might provide the Legislature with more concrete options for reforming the current model.
- Alternative Models That Address High Special Education Costs. As previously mentioned, one ongoing concern in special education is the increasing number of students with high special education costs. The Legislature could fund a study that explores options for funding high‑cost students while also avoiding incentives to overidentify or serve students in more restrictive environments. In particular, the study could examine promising options from other states that could feasibly be adopted in California. Two states, for example, have models primarily based on overall student counts that also provide LEAs with partial reimbursement for high‑cost students. A study specifically focused on this issue could provide some concrete options for the Legislature to consider adopting.
Directly Address Other Key Priorities, Such as Inclusion. Several of the Legislature’s key priorities are not directly related to the state’s special education funding model. For example, the state’s attendance‑based funding model does not discourage schools from placing students in inclusive settings. In these areas, we encourage the Legislature to consider other actions that would improve special education. To further promote inclusion, the Legislature could expand existing initiatives that provide districts technical assistance to implement inclusive practices. Alternatively, the Legislature could consider funding a workgroup to identify the key barriers to implementing inclusive practices and provide recommendations for how to address these challenges. These actions can be taken now without having to wait for the administration to suggest future changes to the special education funding formula.
Education Workforce
In this section, we analyze the Governor’s proposals to address teacher and other staffing shortages, as well as his proposal to provide additional professional development for school staff.
Workforce Shortages
Below, we provide background on teacher and other school staffing shortages, describe the Governor’s proposals related to these issues, assess these proposals, and offer associated recommendations.
Background
California Has More Than 600,000 School Employees. School districts employ a variety of school staff, including teachers, administrators, student services staff, and other school support staff. The state had about 295,000 full‑time equivalent (FTE) teachers in 2018‑19, an increase of 10 percent over the 2010‑11 level (the low point during the Great Recession). Coupled with the effects of declining student enrollment, the statewide student‑to‑teacher ratio, in turn, has dropped every year since its peak in 2010‑11 (23:1). In 2018‑19, this ratio was about 21:1—comparable to the level prior to the Great Recession. The state also has about 26,000 FTE principals and other school administrators. Student services staff include counselors, psychologists, social workers, nurses, speech and language specialists, and librarians. In 2018‑19, the state had about 31,000 school services staff, an increase of about 32 percent over the 2010‑11 level. Teachers, administrators, and student services staff all require credentials issued by the California Commission on Teacher Credentialing (CTC). In contrast, the remaining support staff—including instructional aides, office staff, bus drivers, custodians, and cafeteria workers—do not require credentials and are commonly referred to as classified staff. The state had around 262,000 FTE classified staff in 2018‑19.
Some Districts Unable to Find Credentialed Teachers. Despite recent growth in the teacher workforce, some districts in the state are unable to find credentialed teachers. As shown in Figure 9, prospective teachers have various pathways to earn their teaching credentials. When districts are unable to hire a credentialed teacher for immediate staffing needs, they hire underprepared teachers with emergency credentials. As Figure 10 shows, almost 3 percent of the teacher workforce (about 8,200 teachers) had an emergency credential in 2017‑18. The share of teachers on emergency credentials has risen every year since 2009‑10, when the demand for teachers was low.
Figure 9
Teachers May Receive Credentials Through Various Preparation Pathways
|
Traditional Teacher Preparation |
Internship |
Teacher Residency |
Integrated Teacher Preparation |
|
|
Description |
Prospective teachers enroll at an accredited teacher preparation program, where they complete the required coursework, student‑teaching, and teaching assessments. |
Interns teach in the classroom as the teacher of record and concurrently complete the required coursework and teaching assessments. |
Residents teach with a mentor teacher while completing the required coursework and teaching assessments. Most often, residents commit to working at the school after completing the program. |
Students complete the required coursework, student‑teaching, and teaching assessments during their undergraduate programs. |
|
Length |
BA + 1 year |
BA + 2 years |
BA + 1 to 1.5 years |
BA |
|
Program Sponsor |
University |
School district, COE, or university |
School district or COE in partnership with a university |
University |
|
Cost |
Tuition |
None |
None |
Tuition |
|
Compensation |
None |
Paid |
None |
None |
|
BA = bachelor’s degree and COE = county office of education. |
||||
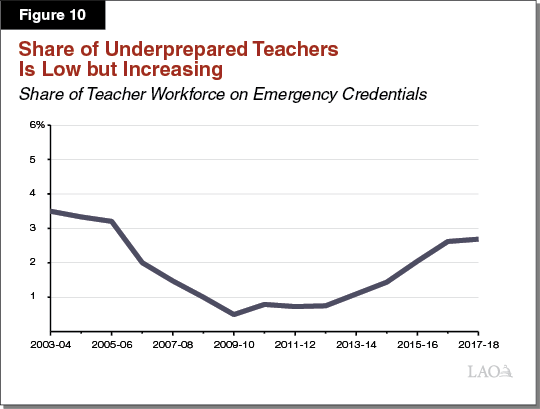
Teacher Workforce Affected by Several Important Factors. Overall, the statewide market for teachers is affected by demand, supply, and turnover. The demand for teachers is largely driven by changes in student enrollment and the level of state funding, as school districts typically use the bulk of state funding increases for some combination of hiring additional teachers and increasing teacher salaries. Demand also is influenced by class size preferences, as class size reduction policies require additional teachers to staff smaller classes. As statewide student enrollment declines, however, class sizes may be reduced without hiring additional teachers. The supply of teachers is driven by multiple factors, including prospective teachers’ perceptions regarding the availability of jobs, the rate at which California can produce newly credentialed teachers, and districts’ ability to recruit teachers from out of state and attract former teachers back into the profession. The rate at which teachers leave the profession also affects the statewide market, as teachers who voluntarily leave the profession must be replaced by new teachers. Factors associated with teachers vacating their current jobs include lack of support from administrators and parents, lack of control over their work, a high prevalence of student misbehavior or tardiness, and lack of access to a teacher mentorship program.
Underprepared Teachers More Common in Certain Subject Areas. The US Department of Education requires states to report teacher shortages using a specified federal methodology. The CDE has identified shortages of special education, science, and math teachers nearly every year since 1990‑91. Such staffing difficulties are consistent with nationwide trends. Special education teachers tend to have higher rates of turnover, likely due to additional stress factors, such as the increased risk of lawsuits and considerable reporting requirements associated with a student’s IEP. Teacher shortages in science and math are attributed to a shortage of undergraduates in science, technology, engineering, and math (STEM) majors and the high salaries that these graduates can receive in other professions. In 2017‑18, about one‑third of new teachers in both special education and STEM fields held emergency credentials.
Low‑Income Urban and Rural Districts Also Rely More Heavily on Underprepared Teachers. Staffing difficulties appear most pronounced in low‑income urban schools, as well as rural schools. Nationwide, teacher turnover tends to be greater in city‑center schools (18 percent from latest available data in 2011‑12) and schools with high rates of poverty (22 percent in 2011‑12). In California, higher turnover also is reported in these types of schools. Rural schools experience different staffing pressures depending on their location and population base. Staffing is most difficult for rural schools with a declining population base. Rural schools close to large population centers with a university may find attracting new teachers easier than more isolated rural schools, but also experience higher rates of turnover as teachers often leave for urban districts offering higher pay. The districts with the largest shares of underprepared teachers are mostly smaller, rural districts. In 2017‑18, 83 of all districts throughout the state had more than 10 percent of their teachers on an emergency credential. Of these, 95 percent had fewer than 5,000 students. A few very small districts had more than one‑third of their teachers on emergency credentials.
In Recent Years, State Has Funded Various Programs to Address Teacher Shortages. Figure 11 describes the programs that have received one‑time funding from the state since 2016‑17 to address teacher shortages. Some programs are aimed at increasing the supply of teachers. For instance, the Classified School Employee Teacher Credentialing Program (Classified Program) provides financial support for classified staff to pursue their teaching credential. Other programs focused on improving or accelerating teacher preparation, particularly in high‑need subject areas. The Teacher Residency Grant Program funds the expansion of residency programs in special education, bilingual education, and STEM fields that provide prospective teachers more support and classroom experience by first teaching alongside a mentor teacher. Other programs, such as the Golden State Teacher Grant Program, targeted teacher recruitment in schools with higher shares of underprepared teachers.
Figure 11
State Has Provided Nearly $300 Million Since 2016‑17 to Address Teacher Shortages
General Fund Unless Otherwise Indicated (In Millions)
|
Program |
Year |
Description |
Funding Allocation |
Amount |
|
Golden State Teacher Grant Program |
2019‑20 |
Provides financial assistance to students enrolled in teacher preparation programs who commit to working in a high‑need subject at a priority school.a |
CSAC awards funds to participating teachers. |
$90 |
|
Teacher Residency Grant Program |
2018‑19 |
Supports establishing and expanding teacher residency programs in special education, STEM, and bilingual education. |
CTC competitively awards grants to districts, COEs, and school‑university partnerships. There are two grant types: (1) planning grants of up to $50,000 and (2) residency grants of up to $20,000 per resident in the new or expanded program. |
75 |
|
Local Solution Grants |
2018‑19 |
Provided funding to local efforts to recruit and retain special education teachers. |
CTC competitively awarded grants of up to $20,000 per participant to districts, COEs, and schools. Grantees required to provide a dollar‑for‑dollar match. |
50 |
|
Classified School Employee Teacher Credentialing Program |
2016‑17 and 2017‑18 |
Provides financial assistance to classified school employees, such as instructional aides, to pursue teaching credentials. |
CTC competitively awarded grants of $4,000 per participant per year for up to five years to districts, COEs, and schools. |
45 |
|
Integrated Undergraduate Teacher Preparation Grants |
2016‑17 |
Supported expanding integrated programs that allow participants to earn a bachelor’s degree and a teaching credential within four years. Programs focused on special education, STEM, and bilingual education received funding priority. |
CTC competitively awarded planning grants of up to $250,000 to universities. |
10 |
|
California Educator Development Program |
2017‑18 |
Assisted districts with recruiting and preparing teachers, principals, and other schools leaders. |
California Center on Teaching Careers competitively awarded grants to 26 districts, COEs, and schools. This program was federally funded. |
9 |
|
California Center on Teaching Careers |
2016‑17 |
Established a statewide teacher recruitment center to recruit qualified and capable individuals into the teaching field, particularly to low‑income schools in special education, STEM, and bilingual education. |
CTC competitively awarded grant to Tulare COE to operate center. |
5 |
|
Bilingual Teacher Professional Development Program |
2017‑18 |
Supported teachers pursuing authorization to teach bilingual and multilingual classes. |
CDE competitively awarded grants to eight districts and COEs. |
5 |
|
Total |
$289 |
|||
|
a A priority school is defined by CTC as having a high share of teachers on emergency credentials. CSAC = California Student Aid Commision; COE = county office of education; STEM = science, technology, engineering, and math; CTC = Commission on Teacher Credentialing; COE = county office of education; and CDE = California Department of Education. |
||||
California Also Has Shortages in Certain Student Services Positions. Most notably, certain types of special education specialists are in particularly short supply. These specialists provide a range of direct services to students with disabilities. Services can include providing a student who has a speech impediment with speech therapy and providing sign language interpretation for a student who is deaf. Most districts try to hire specialists who work exclusively for the district, but they typically contract with third party staffing agencies when unable to hire their own specialists. Contract specialists are generally more expensive than district staff and typically work on one‑year contracts. In 2015‑16, 23 percent of all occupational therapists working in schools were employed through third party staffing agencies, as were 16 percent of all speech and language pathologists. By comparison, 5 percent of all psychologists working in schools were employed through staffing agencies.
Governor’s Proposals
As we discuss below, the Governor’s budget includes a total of $532 million one‑time Proposition 98 General Fund for various proposals aimed at addressing school workforce needs.
Provides $239 Million One Time for Previously Funded Teacher Programs. The Governor’s budget includes $175 million for a second round of funding for the Teacher Residency Grant Program. As Figure 12 shows, the Governor proposes three main changes to the rules for this program. Unlike the funding previously provided for the Teacher Residency Grant Program, the Governor’s proposal does not specify an amount of funding that would go to each shortage area. (The initial funding for the program in 2018‑19 provided $50 million for special education and $25 million for both STEM and bilingual education.) The Governor’s budget also includes $64.1 million for the Classified Program. The program rules would mostly remain the same, but priority would be given to districts, COEs, and schools that have not previously received funding. The amount provided could fund at least 3,200 new participants.
Figure 12
Governor Proposes Three Changes to Teacher Residency Grant Program Rules
|
Current |
Proposed Changes |
|
|
Subject areas |
Special education, STEM, and bilingual education. |
May also include other shortage areas identified by CTC. |
|
Priority |
Applicants with schools that exhibit one or more of the following characteristics: (1) at least 50 percent low‑income students; |
Removes priorities 3 and 4. |
|
Maximum planning grant award |
$75,000 |
$150,000 |
|
STEM = science, technology, engineering, and math; and CTC = Commission on Teacher Credentialing. |
||
Includes $100 Million One Time for New California Teacher Credential Award Program. The Governor’s budget establishes service awards of $20,000 for each newly credentialed teacher in special education, bilingual education, STEM, and computer science who teach in a “high‑need” school for four years. A school is considered high need if (1) 50 percent or more of its students are low income, (2) at least 5 percent of its teachers are underprepared, (3) the school is located in either a rural or densely populated area, or (4) more than 20 percent of its teacher leave within three years. Eligible school districts and COEs, submit award requests to CTC on behalf of their teachers. The service awards are paid out annually, with participating teachers receiving $5,000 for each of the four years they teach at a high‑need school. The proposed $100 million would support around 5,000 service awards.
Provides $193 Million One Time for New Workforce Development Grant Program. The proposed grant program is aimed at increasing the number of student services staff in the state. The CDE would select a COE to develop specific grant criteria and award the grants. Of the proposed $193 million, $20 million would be for planning grants for at least 100 school districts, COEs, and charter schools to develop their own plan to recruit and prepare student services staff. Up to $170 million would be for implementation grants with funds awarded based on the feasibility of the plan to address identified student services workforce shortages. Priority would be given to entities applying in a consortium and planning to provide financial support for tuition, fees, and books. The remaining $3 million would be for administrative costs.
Assessment
Classified Program Is in High Demand… The Classified Program is oversubscribed. The initial two rounds of funding provided enough financial assistance to support 2,260 classified employees. However, an additional 6,000 classified employees requested to participate, and applications from 27 school districts and COEs remain unfunded. Administrators we spoke to viewed the program as a long‑term recruitment and “grow‑your‑own” retention strategy. Administrators also noted that, compared to the current teacher workforce, the participants in the Classified Program are more likely to be from the local community and share the same racial and ethnic backgrounds as the students they serve.
…But Slow to Produce Teachers. Classified Program participants appear to experience some delays earning their teaching credentials. The program requires participants to already have completed two years of college or an associate’s degree. In the first round of funding, however, 679 participants (70 percent) already had a bachelor’s degree and, hence, could expect to complete a teacher preparation pathway in one or two years. By the third year, however, only 196 participants had earned their teaching credential and begun teaching. We heard several possible explanations from districts for the low rates of completion. Most commonly, districts mentioned that some participants had difficulty passing the teaching assessments required for earning a credential, while others were attending courses on a part‑time basis because of work and other commitments. Districts also mentioned that some participants may have decided not to pursue a career in teaching. Because CTC does not track data at the individual participant level, we do not know how frequently and for what reasons participants decided to exit the program. To date, the program has produced 300 new teachers (across the two funding rounds), and CTC anticipates the number of credentialed teachers to increase significantly now that more early participants have completed their bachelor’s degrees.
Classified Program Not Targeted to Statewide Shortage Areas. Although applicants were required to demonstrate a need for credentialed teachers in their applications, those with greater need did not receive priority in the application process. As a result, several districts participating in the program have relatively low shares of underprepared teachers. Of the 23 districts that applied individually (not part of a larger consortium), 14 had a lower percentage of teachers on emergency credentials than the statewide average. Seven districts have both lower shares of teachers on emergency credentials and lower shares of low‑income students than the statewide averages. This differs from most other teacher‑related state programs, which target resources to subject areas and school districts where teacher shortages are most pronounced.
Funding From Previous Teacher Residency Grant Still Available. As previously discussed, $50 million was provided to the Teacher Residency Grant Program in 2018‑19 specifically for special education residency programs. Of that amount, $23 million remains available. The CTC has released a second request for proposals to award these remaining funds. In contrast, the $25 million set aside for STEM and bilingual education has been exhausted.
Residency Programs May Improve Preparation but Are Challenging to Initiate and Sustain. Research suggests that teachers prepared through residency programs tend to feel more prepared than other beginning teachers and typically remain teaching in the same district for a longer period of time. Despite these potential benefits, however, residency programs can be difficult to develop and financially sustain. For example, the districts we spoke to mentioned the following challenges:
- District‑University Collaboration. Establishing a reliable district‑university partnership and tailoring the university’s teacher preparation courses to the residents’ needs required substantial work.
- Attracting Residents. Some programs mentioned losing prospective residents to internship programs, which—unlike residency programs—allow students to earn a teacher salary while they are completing their program.
- Sustainability. Financially sustaining a residency program on an ongoing basis can be challenging, as districts would need to cover costs out of their local general purpose funding.
- Mentor Teachers. Some districts did not consider offering a residency program in special education because they lacked experienced mentor teachers to support residents. Some experienced teachers are hesitant to take on the additional responsibilities required to be a mentor teacher when they find their teaching workload already overwhelming.
- Immediate Staffing Needs. Districts unable to find credentialed teachers may prefer to have a teacher in the classroom immediately as an intern or on an emergency credential rather than wait for a resident to complete their program.
Residency Model Could Be More Suitable for Larger Districts. Given these implementation challenges, residency programs may not be an effective model for some districts to implement—particularly smaller, rural districts. Large districts are more likely to have the key factors for developing and operating a residency program, such as sufficient capacity to support program development, close proximity and preexisting partnerships with local teacher preparation programs, and an adequate supply of mentor teachers.
Proposed Changes Could Result in Residency Programs in Areas With Temporary Shortages. By expanding the grant program to include shortage areas identified by CTC, some grants may ultimately fund residency programs for shortage areas that are not longstanding. Rather, these shortage areas could reflect temporary increased demand due to an economic recovery. For instance, CDE started identifying elementary school teachers as a shortage area in 2015‑16, when district hiring was at its peak. Relative to longstanding shortage areas, however, the shortage of elementary school teachers is less pronounced. In 2017‑18, one‑fifth of all new elementary school teachers were underprepared. In contrast, more than one‑third of new special education teachers were underprepared. The number of newly prepared elementary school teachers has also grown each year since 2013‑14, suggesting that the magnitude of this shortage may be declining.
Impact of Proposed California Teacher Credential Awards Likely Limited. We have identified several concerns with the structure of the proposed California Teacher Credential Awards. By focusing mainly on addressing recruitment challenges at high‑need schools, the program does not address the problems in teacher supply and retention underpinning the state’s teacher shortages. Moreover, the effectiveness of this award as a recruitment incentive is limited. For example, it is possible that the program might provide awards to some recipients who would have taught at a high‑need school even without the award. The proposed program is also very similar to the Golden State Teacher Grant Program funded in 2019‑20, which similarly awards $20,000 to newly credentialed teachers who agree to teach for four years at a school with a high share of underprepared teachers in high‑need subject areas. Some newly credentialed teachers may receive funding from both programs, which would further reduce the effectiveness of this additional funding in addressing teacher shortages.
Workforce Development Grants Unlikely to Address Variety of Challenges in Hiring Student Services Staff. In speaking with various school professional associations, we learned that the underlying reasons for staffing shortages in student services positions vary by credential. For school psychologists, nurses, and speech and language pathologists, the biggest factor is the lack of capacity in existing credentialing programs to meet demand. For instance, only four programs in the entire state currently prepare school nurses. For school counselors, we found no evidence of a shortage. School districts have increasingly hired counselors in recent years as a response to growing student mental health and social‑emotional needs, but districts have been able to fill these positions. Several representatives we spoke to also mentioned that districts tend to disproportionally cut student services staff during downturns, which then results in temporary shortages during economic recoveries as districts begin to hire back staff.
Recommendations
Recommend Approving Smaller Package of Proposals, Freeing Up Funding for Other Priorities. Of the $532 million proposed by the Governor to address workforce shortages, we recommend the Legislature approve $93.1 million for an additional round of funding for the Classified Program and the Teacher Residency Grant Program. We also recommend certain changes to how these programs operate. We recommend rejecting the remaining proposals, as they are unlikely to effectively address teacher and school staff shortages. Collectively, our recommendations would free‑up $439 million in one‑time funds for the Legislature to direct to its other Proposition 98 priorities. (As we discuss earlier in this report, we recommend the Legislature use such freed‑up funding to reduce school districts’ unfunded pension liabilities.) We discuss our specific recommendations in more detail below.
Target Classified Program to Shortage Areas. Given the substantial demand for the Classified Program, we recommend the Legislature approve the Governor’s proposal to provide $64.1 million for this program. In addition, we recommend several modifications to ensure the program is more directly targeted toward addressing teacher shortage areas. Specifically, we recommend giving priority to districts with higher shares of teachers on emergency credentials and higher shares of low‑income students. We also recommend requiring grant recipients to report to CTC data regarding participant retention and turnover. This would help the Legislature better understand how individual participants progress through the pipeline.
Reduce Proposed Teacher Residency Grant Program Augmentation to $29 Million, Reject Other Proposed Changes. We recommend the Legislature provide $29 million for a second round of funding for this program. Along with the $23 million in unspent funding from the previous grant, CTC would have a total of $52 million to award for new residency programs in 2020‑21—equivalent to the amount of funds awarded thus far. Given the challenges in building and sustaining these programs, we believe this amount is sufficient to address additional demand for new residency programs. We also believe the current program rules are more appropriately targeted than the Governor’s proposed changes in addressing the long‑standing shortage areas in the schools most affected by these challenges. As such, we recommend the Legislature reject the proposed changes to broaden the funding to other subject areas and modify the priority areas.
Reject California Teacher Credential Award Proposal. We recommend the Legislature reject the Governor’s proposal to establish the Teacher Credential Award Program. The proposal does not address critical challenges underlying teacher shortages, such as teacher supply and retention. In addition, the state is in the process of administering the Golden State Teacher Grant Program, which addresses the same challenges as the proposed program and may be targeted to the same group of individuals. Should the Legislature be interested in incentive funding for teachers, we suggest focusing efforts on expanding the total supply of teachers in shortage areas. For instance, the Legislature could instead consider targeting the funding to expand enrollment in the integrated teacher preparation programs at the undergraduate level. Under this approach, the state could increase the total supply of teachers by encouraging more undergraduate students to pursue teaching in a high‑need subject when they might have otherwise pursued another profession.
Reject Workforce Development Grant, Explore Other Approaches. We recommend the Legislature reject the Governor’s proposal to establish a new Workforce Development Grant Program. The grants would not address the underlying causes of shortages and could target some student services positions where a shortage is not evident. To the extent the Legislature is interested in addressing school staffing shortages, we suggest exploring ways to expand the capacity of the state’s higher education systems to prepare more student services staff in shortage areas. We note that the state provided $3 million to the California State University in 2019‑20 to expand its speech and language pathology programs over four years. Similar approaches may be more effective in expanding the supply of other student services staff.
Educator Workforce Investment Grant
Below, we provide background on professional development for teachers, describe the Governor’s proposal to provide additional professional development for teachers and other school staff, assess his proposal, and offer an associated recommendation.
Background
Professional Development Activities Are Locally Determined and Funded. Teachers and other school staff negotiate with their school district on the amount of required time dedicated to professional development each year. If these activities occur when school is not in session, the district typically compensates staff at a negotiated hourly or daily rate. If teachers attend professional development during the school day, the district generally must pay the cost of hiring a substitute teacher. The topics of the professional development also can be decided through collective bargaining. Outside of the negotiated activities, teachers and school staff may voluntarily participate in additional professional development opportunities. This time may also be compensated as determined in the local collective bargaining agreement.
Districts Receive Some Federal and State Funding for Professional Development. Districts primarily fund professional development through local general purpose funding (mainly LCFF). In addition, the federal government provides $210 million to California annually to support professional development activities. All districts receive this federal funding, but a majority of the funds go to low‑income districts and schools. Additionally, the state provides districts funding for mandated school staff trainings on HIV prevention education and mandated reporting of child abuse.
Districts Have a Variety of Options for Providing Professional Development. School districts have a variety of options for choosing how to provide training and resources to their employees. Many districts develop their own training and resources based on the specific needs of their workforce. For example, some districts set aside time for professional learning communities, where teachers from the same grade level or subject area work collaboratively to improve their teaching skills throughout the school year. In addition, districts can obtain professional development from a variety of public agencies, such as COEs, SELPAs, CDE, public universities, and various agencies associated with the statewide system of support. These options can be free of charge or on a fee‑for‑service basis. Districts also may receive training from various private entities, including private universities and nonprofit organizations.
New Educator Workforce Investment Grant (EWIG) Program Funded in 2019‑20. The 2019‑20 budget provided $37.1 million in one‑time non‑Proposition 98 General Fund (available over five years) for grants to develop statewide professional development for teachers, administrators, instructional aides, and counselors. Under the EWIG program, CDE and CCEE will award competitive grants to universities or nonprofit organizations in five focus areas. The implementing legislation set aside specific amounts of funding for two of these focus areas—$10 million for English learners and $5 million for students with disabilities. The remaining funding is to be used for grants related to social‑emotional learning and school climate, computer science, and ethnic studies. The CDE is in the process of soliciting applications and anticipates awarding most grants by June 2020.
Governor’s Proposal
Provides $350 Million One‑Time Proposition 98 Funding for Second Round of EWIG. As shown in Figure 13, the Governor’s proposal provides additional EWIG funding in five different focus areas. This includes four of the focus areas funded in 2019‑20, with the computer science grant expanded to include all STEM fields. The Governor’s budget also adds one new grant focused on improving literacy across all subject areas and does not provide additional funding for ethnic studies. In contrast to the first round, where universities and nonprofit organizations were eligible to apply, the second round of funding is available for COEs and school districts. Grantees would be expected to collaborate with the grantees from the first round and various relevant state agencies. Grantees would be required to offer trainings free of charge to participants and to give priority to low income schools, as well as school districts, COEs, and schools identified as needing support under the state’s school accountability system.
Figure 13
Governor Proposes Spending Additional EWIG
Funds in Five Focus Areas
(In Millions)
|
Grant Amount |
|
|
STEM and computer science |
$100 |
|
Literacy |
75 |
|
Social‑emotional learning and school climate |
75 |
|
Students with disabilities |
50 |
|
English learners |
50 |
|
Total |
$350 |
|
STEM = science, technology, engineering, and math; and EWIG = Education Workforce Investment Grant. |
|
Assessment
First Round of EWIG Has Yet to Be Awarded, Second Round Is Premature. The CDE only recently concluded the process of soliciting applications in January and February of this year for the grants in computer science, English learners, and students with disabilities. The CDE intends the request for applications for the social‑emotional learning and school climate grant to be released in March. Given that the first round of grants has not yet been awarded, the Legislature has no information at this time to determine whether the program is an effective use of funding. In deciding whether to augment the program, the Legislature would ideally know more about the training and resources developed with the grant, the number of staff that benefited from the tools developed, feedback on the quality of the professional development, and what changes to the program rules are needed to improve its effectiveness. Providing an augmentation—particularly a tenfold increase—without this information is premature.
Primary Barriers to Professional Development Are Time and Cost, Not Availability of Training. Although the administration intends to significantly increase the amount of professional development available over the next several years, the proposal does not address the common barriers districts and school staff face in accessing professional development. In the fall of 2019, CDE conducted a survey of school staff to identify the key barriers to accessing professional development. Respondents most commonly identified a lack of time as a major barrier, followed by the cost of participating in training. Fewer respondents identified a lack of professional development opportunities available as a major barrier. In our conversations with district administrators, they also identified the lack of time and additional costs as key challenges. Teachers have limited time outside of the classroom to participate in professional development, and participating during the school day requires the district to pay for substitute teachers to take the teacher’s place in the classroom. The Governor’s proposal does not address these barriers to accessing professional development opportunities.
Recommendation
Reject EWIG Augmentation. In view of the above, we recommend the Legislature reject the Governor’s proposal to provide $350 million one time for EWIG. To the extent the Legislature is interested in funding an additional round of EWIG, we suggest to revisit the issue after CDE can share basic information about the resources that have been developed and the number of school staff that have received training with the current EWIG funding. Waiting until resources have been developed also would potentially allow the Legislature to incorporate feedback from the first grant round, further refine the topics covered by the grants, assess remaining demand, and subsequently allocate an appropriate level of funding.
Addressing the Achievement Gap
In this section we analyze the Governor’s proposals to fund Opportunity Grants for low‑performing districts and schools, as well as his proposals related to community schools and coordination of wraparound services.
Opportunity Grants
Below, we provide background on state funding to improve outcomes for low‑performing student subgroups, districts, and schools; describe the Governor’s proposal to support low‑performing schools and districts; analyze the proposal; and offer associated recommendations.
Background
Student Achievement Gaps in California Are Large and Persistent. Year after year, Latino and African American students consistently have lower average state standardized test scores than white and Asian students. Latino and African American students also tend to have worse outcomes on other academic performance measures, such as attendance and suspension rates. Racial and ethnic achievement gaps generally hold even when taking family income into account. Low‑income students, English learners, students with disabilities, homeless youth, and foster youth also have worse outcomes on average than other students. Figure 14 shows disparities in high school graduation rates by race/ethnicity and student subgroup for the class of 2019.
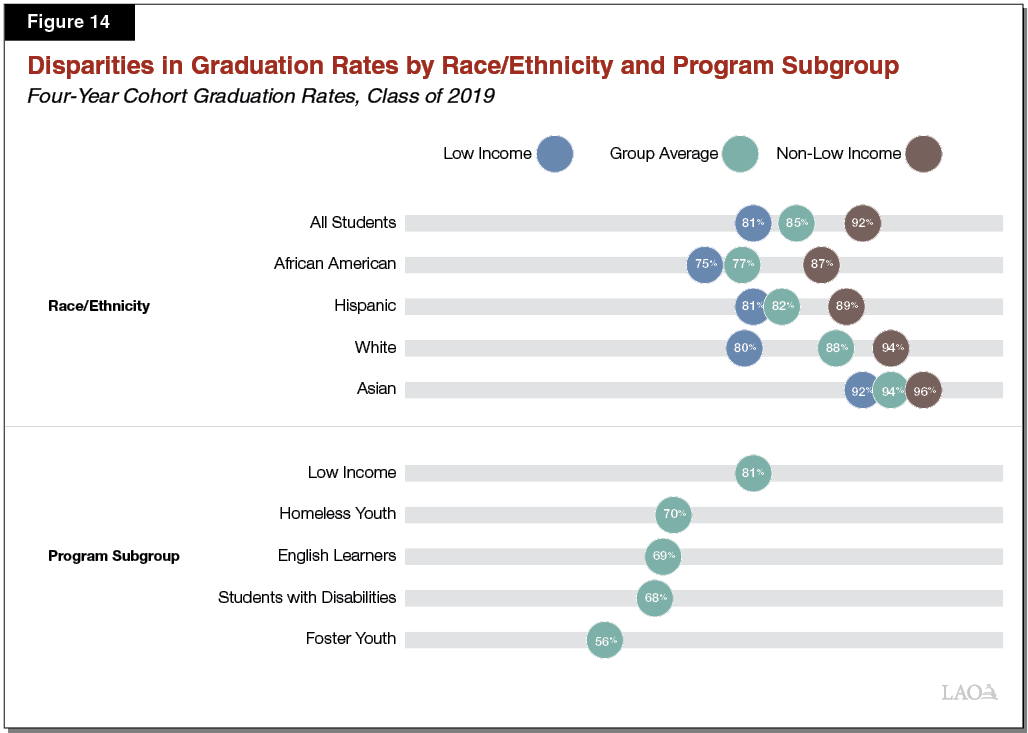
Significant Ongoing State and Federal Funding Allocated for Disadvantaged Students. School districts currently receive $15.2 billion in ongoing state funding and $3.9 billion in ongoing federal funding for supporting student groups that have historically had below‑average student outcomes. The single biggest component of this spending is the $10 billion the state allocates through the LCFF supplemental and concentration grants. The largest component of ongoing federal spending is the nearly $2 billion the state receives through Title I, Part A of the Every Student Succeeds Act (ESSA) to support supplemental educational services for low‑income students.
All Districts Must Develop Plans for Helping Students Improve. In conjunction with establishing LCFF in 2013‑14, the state adopted a new system of accountability for school districts. A core part of the new accountability system is a requirement that each district develop a strategic plan known as the Local Control and Accountability Plan (LCAP). Districts must adopt an LCAP every three years and update the plan annually. State law specifies the various groups (such as teachers and parents) that districts must include in their planning process. In their LCAPs, districts must identify their achievement gaps, set performance goals, and track progress toward meeting those goals.
State Has New System for Supporting School Districts With at Least One Low‑Performing Student Subgroup. In developing its new accountability system, the state also moved to evaluating school district performance based upon multiple measures, including not only test scores and graduation rates but also chronic absenteeism and suspension rates, among others. A district with at least one subgroup that is identified as low performing in two or more of these areas is to receive targeted support—known as differentiated assistance—from its COE, sometimes in consultation with other regional and state partners. As part of differentiated assistance, COEs must do at least one of the following: (1) review the district’s strengths and weakness and identify effective programs that could help the district improve, (2) assign an academic expert to help the school district improve outcomes, or (3) request CCEE provide assistance to the district. (We discuss the role of CCEE in greater detail below.) For a district that has persistent performance issues in three or more student subgroups, the Superintendent of Public Instruction may intervene under certain circumstances.
State Allocates Federal Funds to Some Low‑Performing Schools. Federal law requires that each state devote a share of its ESSA Title I, Part A funds to grants for schools that qualify for comprehensive support and improvement, as defined by the state’s education agency. In California, qualifying schools are those with persistently low high school graduation rates or those where several student groups are very low performing according to the state’s performance standards. Districts must use these funds to improve student performance using evidence‑based strategies that align with the district’s LCAP and are aimed at improving outcomes for low‑performing student subgroups. Last year, the state distributed $127 million for this purpose to assist a total of 814 schools. Grantees received a flat sum of $156,000 per qualifying school.
About One‑Third of Districts Qualify for Differentiated Assistance. Out of California’s 944 school districts, 301 qualified for differentiated assistance in 2019. For a majority of qualifying districts, students with disabilities were one of the subgroups that met the criteria for differentiated assistance. Approximately one‑third of districts that qualified for differentiated assistance were flagged based on the status of either their foster youth, homeless youth, or both. For these three student groups, districts most commonly qualified for assistance because of poor academic performance, low engagement (as measured by graduation and chronic absenteeism rates), and poor school climate (as measured by suspension rates).
State Created CCEE to Support Some Low‑Performing Districts. California established CCEE by statute in 2013 to play a key role in coordinating activities of the statewide system of support. Among its other activities, CCEE works with COEs that have been designated as regional leads to improve support and oversight for districts. The CCEE also provides direct technical assistance to some low‑performing districts. The goal of this technical assistance is to identify areas of improvement for target school districts and assist them in developing better instructional practices.
CCEE Also Provides Intensive Support to Some Districts. Chapter 426 of 2018 (AB 1840, Committee on Budget) allows for CCEE to provide intensive support to districts that receive an emergency state loan. CCEE is currently providing support to three districts that have received and not yet paid back an emergency loan: Inglewood Unified, Oakland Unified, and Vallejo City Unified. To support these districts, CCEE leads a team that includes (but is not limited to) representatives from the district, the COE that oversees the district, and the COE in the region that serves as a geographic lead. This team sets objectives and identifies priority areas for the district, spends approximately eight weeks undertaking a comprehensive instructional assessment, and develops a plan that includes continual monitoring of the district’s progress toward its goals.
Legislature Established Achievement Gap Work Group in 2019 and Required Report. In response to concerns over student achievement gaps, the Legislature tasked our office with convening a work group on the topic and submitting a report by February 1, 2020. As required by the Supplemental Report of the 2019‑20 Budget Act, the group included representatives from both houses of the Legislature, the administration (including the Department of Finance), and CDE. The group met five times over the course of fall 2019. The resulting report, Narrowing California’s K‑12 Student Achievement Gaps, included policy options for better supporting disadvantaged and low‑performing students.
Governor’s Proposal
Provides $300 Million One‑Time Opportunity Grants for Low‑Performing School Districts and Schools. Of this amount, $270 million is for providing grants directly to low‑performing districts and schools where at least 90 percent of students are low income. Recipients could be a school or consortia of schools within a district, a school district with numerous high‑poverty schools, a charter school, or a COE with high‑poverty schools in its jurisdiction. Grant recipients would be required to take certain actions as a condition of receiving this funding. The CCEE is to allocate funding to grant recipients on or before March 30, 2021, and the funds would be available through 2024‑25. The remaining $30 million is for CCEE to fund support for and oversight of grant recipients. A portion of this funding would be for COEs with jurisdiction over grant recipients to assist CCEE in its support and oversight activities. In addition, COEs are to develop resources that could be used by schools statewide.
Leaves Key Decisions Regarding Program Structure to CCEE and State Board of Education. The Governor’s proposal requires CCEE to develop a plan for administration of the grant program by November 30, 2020. This plan must include the vision and scope of the program, grant selection criteria, criteria for identifying low‑performing schools, the role of COEs and grant recipients, and a description of how grant recipients will be evaluated. The plan must be approved by the executive director of the State Board of Education.
Funding to Be Used for Wraparound Services and Improvements to Instruction. Recipients may use the grants for a variety of activities, including staff recruitment and retention, wraparound student services such as mental health care, extended learning time, and acquiring new instructional materials.
Assessment
Proposal Lacks Detail, Gives Too Much Discretion to Other Agencies. Several key elements of the Governor’s proposal are left entirely to the discretion of the CCEE and the State Board of Education, with no requirement that the plan incorporate input from the Legislature. Most notably, the proposal gives authority to CCEE to determine the overall scope of the grant program and set criteria for selecting grant recipients. Although providing CCEE with flexibility in how to best support schools is reasonable, we do not think the Legislature should defer other key decisions—such as the breadth and scope of the program. Moreover, the proposal does not require CCEE’s plan to specify a set of expected outcomes or key metrics to evaluate the effectiveness of the grant. Without this type of information, the Legislature would be unable to assess whether the program is an effective use of funding, particularly in terms of improving low‑performing school and districts.
Not Clear How Governor’s Proposal Meshes With Existing System of Support. Rather than augmenting existing supports for low‑performing schools and districts, this proposal seems to add a new layer to the already complex statewide system of support. The administration has not articulated how this new layer would interact with the existing support provided to school districts by CDE, COEs, CCEE, and other regional and state partners. Additionally, though the administration specifies that CCEE is to consider other funding that Opportunity Grant recipients already have received, it offers no guidance regarding how this funding would be incorporated into the new program. Without carefully considering the support and assistance already being provided, the support provided through the proposed Opportunity Grant program could be duplicative and/or in conflict with existing support.
Using One‑Time Funds for Ongoing Purposes Unlikely to Make Lasting Impact. The Governor’s proposal allows schools and districts to use Opportunity Grants on expenditures such as staffing improvements, extended learning time, and integrated student health care. Many of those activities, however, are ongoing expenditures that would need to be sustained with ongoing funding. If the school is unable to identify additional resources to cover these costs, the benefit of such spending would only last until the Opportunity Grant funding expires. Temporary funding of this nature might be best used for one‑time spending, such as intensive coaching and training, that helps districts and schools make the systemic changes necessary to improve student outcomes.
Recommendations
Reject Governor’s Proposal. The Governor’s proposal lacks sufficient detail for the Legislature to determine whether this approach would be an effective way to improve outcomes for low‑performing districts and schools. As designed, the proposal also does not allow for legislative input. Additionally, the administration appears to have developed this proposal without considering how this funding would align with existing funding provided to support low‑performing schools and districts. As such, we recommend that the Legislature reject the Governor’s proposed Opportunity Grant program.
Consider Smaller Ongoing Augmentation to Provide Intensive Support in Districts With Persistent Challenges. The achievement gap work group that the Legislature asked us to convene in 2019 discussed a policy option that involves establishing a crisis assistance program for districts with poor academic performance. This option, like the Opportunity Grants proposal, was intended to improve outcomes for persistently low‑performing districts. The option that emerged from work group discussions, however, is more targeted and more integrated into the state’s existing system of support. Under this option, the Legislature would allocate funding for CCEE to provide crisis assistance for a small group of districts (for example, no more than ten) with significant achievement gaps that have not narrowed over time. The CCEE would provide these districts with intensive intervention and include CDE and the applicable COE in the improvement redesign process. Keeping the number of districts small could help all the involved groups devote the attention needed to undertaking intensive intervention without spreading their efforts too thin. Such an approach would require a smaller investment of state funds and focus on changing instructional, administrative, and financial practices within participating districts. We recommend that the Legislature further develop this option, giving particular consideration to which of the involved groups (CDE, CCEE, COE, and the district) would be held accountable if a district does not improve after three to five years. If such an approach proved to be successful in improving district outcomes, the Legislature could consider gradually increasing funding to assist a larger number of districts.
Community Schools and Wraparound Services
In this section, we provide background on community schools and wraparound services, describe the Governor’s proposals related to these issues, analyze those proposals, and offer associated recommendations.
Background
State Funds Wraparound Services Through a Few Categorical Programs. In attempting to address concerns with academic achievement gaps in schools, education practitioners and policymakers have increasingly shifted from focusing solely on the quality of academic instruction toward a more holistic assessment of how nonacademic factors—such as health, mental health, safety, and economic security—influence academic outcomes. Approaches to address these factors often focus on providing disadvantaged students with wraparound supports to meet other needs beyond academic instruction. The state currently funds a few programs that provide wraparound services for students. For example, the state provides $650 million annually for before and after school programs that primarily serve children in low‑income schools. The state also allocates $27 million in ongoing funds to wraparound services for foster youth, including counseling and training for independent living.
Some Districts Partner With Other Public Agencies to Offer Wraparound Services. In addition to state and local funds, some school districts utilize the resources of partner agencies to provide wraparound services for students. These partner agencies may be other public institutions, nonprofit organizations, or other private entities. For example, last year Los Angeles Unified School District opened wellbeing centers at 50 high schools in partnership with both public partners (including the COE and County Department of Mental Health) and the nonprofit Planned Parenthood Los Angeles. The new wellbeing centers offer a variety of services, including substance use education and mental health support groups.
Community Schools Model Has Been One Approach to Improve Outcomes for Low‑Income Students. To address nonacademic determinants of student success, a growing number of school districts across the country have implemented the community schools model. As Figure 15 shows, researchers have identified four “pillars” of a fully implemented community schools model. In addition to traditional instruction, community schools typically offer extensive wraparound student services and extended learning opportunities, such as after‑school tutoring. In addition, community schools devote significant resources to community engagement and make use of collaborative leadership structures, such as giving parents and community partners a formal role in setting policy. Though many traditional schools may incorporate one or two of these elements—such as by offering some limited wraparound services—a fully implemented community schools model treats all of these elements as core functions.
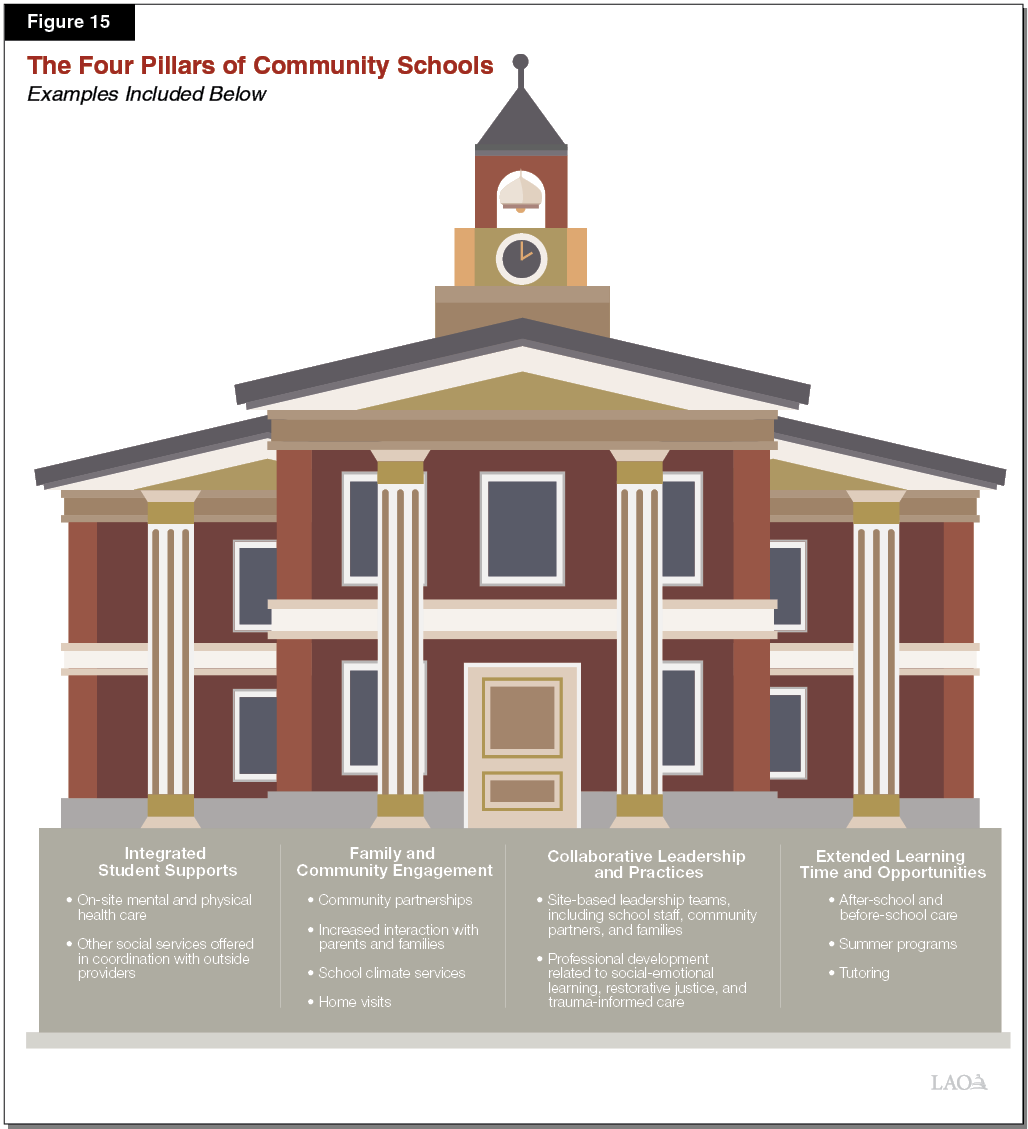
Community Schools Rely on Variety of Funding Sources. Because community schools offer services above and beyond those found at a traditional public school, they tend to have higher per‑student expenses than comparable schools. As a result, most community schools use a variety of different funding sources to operate their programs. In addition to state and local education funding, community schools may rely on other funding sources, such as cash transfers or in‑kind services from other government agencies (such as a county social services office), federal Title I grants, small donor contributions, and philanthropic funding.
Some California Districts Have Adopted the Community Schools Model. Redwood City School District has followed the community schools model since 2000. Five of the district’s schools—comprising one‑third of the district’s student enrollment—currently operate as community schools. Oakland Unified School District adopted the community schools model in 2009 with the intent of becoming the first school district in the country to implement the model district wide. Forty‑one Oakland schools—approximately half of all schools in the district—currently have full‑time community school managers. Students at those schools that do not yet have full‑time community school managers still receive wraparound services, as some wraparound services are coordinated across the entire district. Some COEs have also opted to support community schools. For example, last year Los Angeles COE launched a community schools pilot in partnership with other county agencies, including the Department of Children and Family Services and the Department of Public Health. The pilot program currently operates on 15 high school campuses across Los Angeles county.
Other States Have Supported the Community Schools Model. Some states have offered funding and technical assistance to districts interested in implementing the community schools model. Legislation enacted in New Mexico last year provides competitive grants to schools and districts that adopt the community schools model. Similarly, Florida established a grant program in 2019 to assist up to 12 public schools in adopting the community schools model. The grant is administered by University of Central Florida Center for Community Schools, which since 2014 has provided technical assistance, training, and other resources to develop community schools in Florida. New York has also offered community school funding to districts within the state since 2013.
Governor’s Proposals
Creates One‑Time Community Schools Grant Program. The Governor’s budget provides $300 million in one‑time funding to create the California Community School Partnership Grants program. Grants would be available to LEAs interested in implementing the community schools model. The Superintendent of Public Instruction and State Board of Education would jointly administer the grant, giving priority to applicants who serve high‑poverty student populations. Administration of the grant would include providing technical assistance, first to potential grant applicants and later to grant recipients. Funds would be available until June 30, 2025. Grantees would be expected to share program data with CDE, and the Superintendent would be required to report on the grant program’s impact to the Governor and Legislature by December 31, 2025.
Provides $18 Million One‑Time Funding for COEs to Improve Coordination With Local Wraparound Service Providers. CCEE would administer $18 million in grants to COEs for the purpose of improving coordination efforts with wraparound service providers to ensure that students have access to these services. The funds would be available until June 30, 2025 and would be allocated to COEs based on a methodology developed by CCEE. Grantees would be required to consult with both CCEE and a public institution of higher education. Additionally, grantees would be expected to prioritize grant funds for activities aligned with those of LEAs in their county that receive California Community Schools Partnership Grants or Opportunity Grants.
Assessment
Research Finds Community Schools Are Associated With Improved Outcomes. Formal evaluations of community schools tend to find positive results. In 2017, researchers at the Learning Policy Institute and National Education Policy Center reviewed 143 studies of the community schools model and concluded that “well‑implemented community schools lead to improvement in student and school outcomes.” In particular, they found consistent evidence that implementing a community schools model led to higher attendance and graduation rates, as well as narrower academic achievement gaps as measured by standardized tests. Similarly, a RAND Corporation evaluation of 30 community schools in New York City concluded the city’s community schools initiative had successfully increased graduation rates and decreased chronic absenteeism and disciplinary incidents. Three years after implementation, however, the RAND Corporation found no significant effect on English Language Arts achievement and only a small effect on math proficiency.
Implementation Can Be Challenging. Successfully adopting the community schools model requires fundamental changes to the way school districts and schools operate. As a result, implementation of the community schools model can be a complicated process. Experts say the following elements are critical for successful implementation:
- Planning and Developing Community Partnerships. The lead educational agency behind the implementation of a successful community school may spend a year or more developing its implementation strategy before putting it into action. Researchers suggest the planning stage is key because the most successful implementation plans reconsider the core elements of a school’s governance structure and guiding philosophy, rather than simply adding community school services on top of the existing school structure. Schools may also need time to establish strong relationships with potential service providers and community allies.
- Funding. Community schools typically require a variety of long‑term funding streams, including both public and private funding sources. Because community schools frequently rely on philanthropic support, establishing a sustainable community school in a region where relatively few nonprofits or private foundations operate may be more difficult.
- Support. Researchers emphasize that successfully implementing the community school model requires a substantial amount of technical assistance—sometimes over the course of several years. LEAs without prior experience operating community schools may need help learning how to develop external partnerships, collaborate with other public agencies, identify ongoing funding streams, and rebuild existing governance structures to align with the community schools model.
Proposal Lacks Detail to Ensure Community Schools Model Is Successfully Implemented. To overcome the obstacles associated with implementing the community schools model, the majority of new community schools rely on significant technical assistance from external partners. The Governor’s proposal stipulates that grant recipients will receive technical assistance, but does not include any requirements for the level of assistance the Superintendent and State Board of Education must provide. Similarly, the Governor’s proposal includes no rules or requirements for how community schools grant funds should be spent. In the absence of specific requirements, it is possible that grantees may not fully implement the community schools model, or fail to implement it in compliance with evidence‑based best practices.
Unclear How County Outreach Funds Would Improve Coordination With Service Providers. The Governor’s proposal does not establish clear expectations for how coordination between COEs and wraparound service providers is to improve with additional one‑time funding, nor does it specify what additional costs COEs are expected to incur to improve coordination. It is also unclear why COEs would be required to consult with a public higher education institution.
Recommendations
Fund Smaller Community Schools Pilot With Greater Emphasis on Technical Assistance. To provide greater certainty that grantees would effectively implement a community schools model, we recommend the Legislature fund a smaller grant program that sets aside sufficient funding for intensive technical assistance. We also recommend the Legislature establish a community schools technical assistance office prior to requesting applications for funding. This office would then be able to provide grant applicants with information regarding what implementation of the community schools model entails. Once grant funds are released, the office could provide additional assistance to grant recipients during implementation. Beginning with a smaller grant ensures that the number of LEAs receiving awards at any given time does not exceed the state’s capacity to provide grantees with technical assistance. Focusing on a smaller number of LEAs (for example, no more than ten) would also allow the technical assistance team to provide more intensive support that ensures the LEA will make the systemic changes necessary to successfully implement the community schools model. In addition, we recommend that technical assistance for the community schools grant be provided in coordination with other support grantees are receiving, such as differentiated assistance from their COE. If the results of this approach appear promising, the Legislature could choose to provide grants to a greater number of LEAs in subsequent budget years.
Reject County Outreach Funding Proposal. Given that the administration has not provided a clear explanation as to how the county outreach funds would be used, we recommend rejecting the proposal at this time.
School Nutrition
In this section, we provide background on school nutrition programs, describe and assess the Governor’s proposals, and offer associated recommendations.
Background
State and Federal Government Both Administer Nutrition Programs. California schools that participate in either federal or state school nutrition programs are reimbursed by the number of eligible meals they serve. For example, in 2019‑20, districts that participate in the federal National School Lunch Program generally receive $3.50 per free lunch and $3.10 per reduced‑price lunch. The state program provides an additional 24 cents per free or reduced‑price breakfast or lunch. Both reimbursement rates are adjusted annually for inflation. Districts participating in either the state or federal program must serve meals that meet certain nutritional standards.
Roughly 60 Percent of California Students are Eligible for Free or Reduced‑Price Meals. Students are eligible for free meals if their family’s annual income is at or below 130 percent of the federal poverty level (FPL)—$27,729 for a family of three. The reduced‑price meal eligibility is 185 percent of the FPL ($39,461 for a family of three). Students from families who are not eligible for free or reduced‑price meals can eat the same meals provided to eligible students, but must pay for the meal.
Number of School Lunches Served Has Decreased Statewide. Consistent with statewide declining enrollment in schools, the total number of school lunches served in California through federal nutrition programs has decreased in recent years. In 2013‑14, 555 million lunches in California were served through the federal nutrition program. By 2017‑18, the state served roughly 15 million fewer lunches—a decrease of 2.7 percent. Throughout this period, the bulk of the lunches served (roughly 80 percent), were provided either for free or at a reduced price.
Best Practice Is for School Nutrition Revenue to Cover Costs of the Program. A school district’s primary revenue sources for school nutrition programs are federal and state reimbursements, as well as payments received from students who purchase meals. The largest expenses for a food service program include labor, food, and supplies. School district costs can vary based on staff compensation, quality of food purchased, and how food is prepared and served to students. For example, a school district that cooks food at each school site has a different model and associated costs compared to a district that processes food in a central kitchen before distributing to school sites. Regardless of the exact structure of the nutrition program, the Fiscal Crisis and Management Assistance Team—a team of fiscal experts who conduct in‑depth studies of district budgets and recommend specific steps for improving their fiscal health—recommends labor costs not exceed 45 percent of nutrition revenues, with food and supplies also not to exceed a similar share. Districts also have the option to use their general purpose funding (such as LCFF) to cover costs in the nutrition program that exceed school nutrition revenue.
Federal Law Requires School Food Service Workers Meet Annual Training Requirements. Food service workers are required to complete six hours of training per year if they are employed full time and four hours if they are employed part time. School districts typically provide training to meet this requirement and cover the annual costs within their nutrition program (rather than having employees find training on their own). Districts must offer training that is job related, but have discretion on the exact topics and format of the training. For example, topics can include food safety standards and meal counting procedures. The district could provide this training in person or have its employees watch a prerecorded webinar.
Governor’s Proposal
Increases Reimbursement Rate for School Meals. The Governor’s budget includes $60 million ongoing Proposition 98 General Fund for a rate increase for free and reduced price meals served to eligible students in schools. The budget also includes $4 million ongoing Proposition 98 General Fund for a 2.29 percent COLA. Combined, these proposals would increase the state’s school meal reimbursement from 24 cents per meal in 2019‑20 to 34 cents per meal in 2020‑21. The proposal also requires school districts to report to CDE how they used the reimbursement rate increase to improve the quality of reimbursed school meals or increase participation in the school nutrition program.
Funds One‑Time Food Service Training Initiative. The Governor’s budget also provides $10 million one‑time Proposition 98 General Fund to support training for food service workers on how to promote healthier foods. Funds will be distributed to all districts based on the number of classified school employees. Funds can be used to train staff on food preparation, marketing, or changing the school lunch environment.
Assessment
School Nutrition Programs Appear to Face Certain Cost Pressures. School districts cite various cost pressures associated with their school nutrition program. One notable cost pressure is the declining participation in school nutrition programs driven by overall declining enrollment. With declining school meals served, school districts will receive less federal and state meal reimbursements and will not be able to benefit as much from economies of scale. This is because certain district costs—such as administration and the upkeep of equipment—do not decline proportionally with the number of meals served. School districts also noted cost pressures associated with increasing staff salaries and benefits. These factors are not unique to nutrition programs. Since 2013‑14, increases in state K‑12 funding (primarily from LCFF) have resulted in school districts increasing staff salaries. Over this period, schools also have been required to make larger pension contributions on behalf of their employees. These growing costs are evident in our review of school nutrition financial data. The share of statewide school nutrition costs going towards staff compensation has increased from 48 percent in 2013‑14 to 54 percent in 2018‑19.
Reporting Requirement Unnecessary Given the Funding’s Allowable Uses. The Governor’s proposal allows school districts to use funds associated with the proposed reimbursement rate increase in a variety of ways as long as the spending is intended to (1) improve the quality of foods served or (2) increase student participation. Several examples of how districts can use these funds are listed in the proposed budget trailer legislation, but school districts would not be limited to these options under the Governor’s proposal. Given the broad goals of the funding increases and wide range of allowable uses, virtually any school nutrition expense likely would be deemed as meeting the statutory intent. Accordingly, we find that the proposed requirement for school districts to report how they used the reimbursement rate appears unnecessary.
Limited Use of One‑Time Funds Reduces Opportunity to Promote Nutritious Foods. The Governor’s proposal limits the uses of the proposed one‑time funds for training on three topics—food preparation, healthy food marketing, and changing a school lunch environment. Such limited options reduces the opportunity for districts to make other one‑time purchases that could better promote nutritious foods at a school. Other training topics, such as basic nutrition training for food services workers, also could help school districts promote nutritious foods. School districts also could better promote nutritious foods by making other one‑time purchases. For example, instead of training food workers on how to change the lunch environment, a school district might benefit from using one‑time funding to buy the furniture or supplies needed to make the specific improvements.
Recommendations
Rate Increase for Nutrition Program Seems Reasonable, but Consider Trade‑Offs. The proposed reimbursement rate increase would likely help districts address some cost pressures they cite in regards to their school nutrition programs. However, any ongoing increase for school nutrition means those funds are not available for LCFF or other purposes that also can ease district cost pressures. If the Legislature does provide the reimbursement rate increase for school nutrition, we recommend rejecting the Governor’s proposed reporting requirement. Given that districts would be allowed to use the funding for a wide range of purposes, the reporting language likely would not facilitate greater legislative oversight of the program.
Modify Allocation of One‑time Funds and Allow LEAs to Use Funds for Both Training and Supplies. We recommend the Legislature allow the one‑time funds be used for a broader set of expenses, including supplies, and training topics beyond what would be allowed under the Governor’s proposal. A broader set of allowable uses would provide districts with more flexibility to use funds in a way that best supports districts in further promoting nutritious foods. Since our recommendation would allow districts to use one‑time funds for activities outside of training, we also recommend changing the manner in which one‑time funds are allocated to districts. Instead of allocating funds based on the number of employees, we recommend the Legislature allocate funds based on the number of reimbursable meals the school district serves. This is a more direct indicator of the size of a school district’s nutrition program.
Summary of Recommendations
|
Issue |
Governor’s Proposal |
LAO Recommendation |
|
Overall Proposition 98 Package |
||
|
Mix of one‑time and ongoing spending |
$2 billion for one‑time initiatives (including $1.2 billion attributable to 2020‑21) and $1.7 billion for ongoing augmentations. |
Build a final budget package that continues to rely upon a mix of one‑time and ongoing spending, as this approach minimizes the likelihood of programmatic cuts in the event of an economic downturn. |
|
Use of one‑time funding |
Most funding allocated to several initiatives intended to improve the education workforce and close achievement gaps. |
Reject most of these proposals, as they are unlikely to address the root problems. Use the freed‑up funding to pay down districts’ unfunded pension liabilities, as this alternative would improve the funding status of the pension systems and likely make district budgets easier to balance on a sustained basis. |
|
The Minimum Guarantee |
||
|
General Fund revenue |
General Fund revenue estimates are similar to our projections over the period. |
Use the Governor’s estimates as a reasonable starting point for developing the Proposition 98 budget. Prepare for the possibility that revenue estimates could weaken over the coming months. Expect the minimum guarantee to increase or decrease about 40 cents for each dollar of higher or lower revenue. |
|
Local property tax revenue |
Property tax revenue estimates are $671 million above our projections over the period. |
Expect the minimum guarantee to increase or decrease on a dollar for dollar basis if property tax revenue is higher or lower than the Governor’s estimates. |
|
Proposition 98 Reserve |
Total balance of $487 million by the end of 2020‑21. |
Expect the constitutionally required balance to increase if the guarantee grows and decrease if the guarantee drops. |
|
Local Control Funding Formula |
||
|
Cost‑of‑living adjustment (COLA) |
$1.2 billion to cover 2.29 percent statutory COLA and attendance changes. |
Projected COLA rate and associated cost increase are in line with our estimates. |
|
Special Education |
||
|
Base funding |
$645 million ongoing to increase most base rates to $660 per student. Base rates to be calculated using three‑year average of attendance. |
Adopt proposal. Addresses historical inequities in base funding rates. |
|
Studies and work groups |
$1.1 million one time to fund governance study and two work groups to recommend other special education reforms. |
Fund studies and work groups based on legislative priorities. |
|
Preschool funding |
$250 million one time for increased and improved services. |
Use funds for an ongoing base increase and incorporate preschool‑aged children into base formula. |
|
Education Workforce |
||
|
Educator Workforce Investment Grant |
$350 million one time for professional development grants in five focus areas. |
Reject proposal. Consider additional funding after the state has basic information about how the first round of grants (funded in 2019‑20) were used. |
|
Workforce Development Grant Program |
$193 million one time for grants to address student services staff shortages. |
Reject proposal. Consider addressing underlying causes of shortages, including expanding enrollment in preparation programs. |
|
Teacher Residency Grant Program |
$175 million one time for additional teacher residency grants. Various program changes that modify priority schools and broaden eligibility to other subject areas. |
Provide $29 million, as interest in additional residency programs in longstanding shortage areas may be limited. Reject proposed program changes. Current program rules are better targeted to shortage areas. |
|
California Teacher Credentialing Award Program |
$100 million to establish new service awards for each newly credentialed teacher in a high‑need subject who teaches in a high‑need school for four years. |
Reject proposal, as it would not address underlying causes of teacher shortages in high‑need subjects or high‑need schools. |
|
Classified School Employee Teaching Credential Program |
$64.1 million one time for additional grants to provide financial assistance to classified school employees pursuing a teaching credential. |
Adopt proposal. Give priority to districts with more severe shortages and higher shares of low‑income students. Require districts to report data on participant retention and turnover. |
|
Addressing the Achievement Gap |
||
|
Opportunity Grants |
$300 million one time to provide grants and support to low‑performing districts and schools where at least 90 percent of students are low income. |
Reject proposal. Consider a smaller ongoing augmentation to provide intensive support to a small number of districts with persistent challenges. |
|
Community School Partnership Grants |
$300 million one‑time grants for implementation of the community schools model. |
Fund a smaller community schools pilot with greater emphasis on technical assistance. Consider establishing an office of technical assistance prior to awarding grants. |
|
County Outreach funding |
$18 million one time for county offices of education to improve coordination with county wraparound service providers. |
Reject proposal. |
|
Child Nutrition |
||
|
Rate increase |
$60 million ongoing to increase reimbursement rate for free and reduced price meals served. Reporting language on how funds are used. |
Consider trade‑offs. A nutrition rate increase would likely help districts address some school nutrition cost pressures, but any ongoing increase for school nutrition means funds are not available for other K‑12 purposes. If adopting increase, recommend rejecting proposed reporting requirement. |
|
One‑time training initiative |
$10 million one time to support training for food service workers. |
Allow funds to be used for a broader set of expenses, including supplies, and training topics beyond what would be allowed under the Governor’s proposal. |