
March 11, 2024
California’s Low-Wage Workers and Minimum Wage
Is the Minimum Wage High, Low, or
Somewhere in Between?
Three Ways to Assess the Minimum Wage
Is the current $16 per hour statewide minimum wage high, low, or somewhere in between? Over the last decade, California’s nominal minimum wage has doubled from $8 per hour to $16 per hour. The state’s minimum wage is now more than double the federal minimum wage, which has been $7.25 per hour since 2009. These simple dollars-per-hour comparisons make California’s minimum wage seem high, but they are not necessarily meaningful.
In this post, we compare the statewide minimum wage to various benchmarks that, in our view, are more closely connected to the purposes and economic effects of the policy. These benchmarks are inspired by three key policy issues related to the minimum wage: poverty, inequality, and employment. (The comparisons are based on gross wages. Net incomes also depend on other factors, such as taxes.)
Minimum Wage as Policy to Address Poverty. Many policymakers view minimum wages as a way to raise incomes and to reduce the number of people experiencing poverty. To assess the minimum wage through this lens, we compare it to the official federal poverty level and to county-level housing costs.
Minimum Wage As Policy to Address Inequality. Another common motivation for minimum wage increases is to reduce economic inequalities. To assess the minimum wage through this lens, we estimate some key measures of statewide hourly wage inequality:
The gap between the median and the 10th percentile.
The gap between male and female low-wage (10th percentile) workers.
The gap between white and Latino low-wage (10th percentile) workers.
Although other aspects of hourly wage inequality—such as gaps between other demographic groups, and differences between low-wage workers and high-wage workers—also are of keen interest to policymakers, we focus on these three comparisons due to data limitations.
Minimum Wage as Employment Policy. Wages interact with other labor market conditions in complex ways. Minimum wages can, in principle, affect a wide range of labor market outcomes, such as overall employment, employment for certain industries or demographic groups, or non-wage benefits. Overall, the current body of evidence suggests that past state and federal minimum wage increases likely have had modest effects, at most, on aggregate measures of employment. If, however, California’s current minimum wage is substantially higher than most others observed to date, then it could be difficult to apply those conclusions to additional wage increases (beyond the current-law inflation adjustments). If the state’s minimum wage falls within the range of those studied previously, findings from that research are more directly applicable.
To gauge whether the state’s current $16 per hour minimum wage is high or low from a labor market standpoint, we estimate two statewide numbers:
The ratio of the current minimum wage to the full-time median wage in 2022 and 2023.
The share of workers whose wages were at or below $16 per hour in 2022 and 2023.
Both of these numbers provide a rough summary of how strongly the minimum wage compresses the wage distribution. In turn, this can help us gauge the potential labor market effects of further minimum wage hikes. Recognizing that California, in practice, contains many smaller labor markets, we also examine regional variation in wages.
Other Aspects of Minimum Wages. This post is not a comprehensive evaluation of the statewide minimum wage. It does not encompass values—such as fairness, dignity, or economic liberty—that are very difficult to quantify. It also does not directly quantify cause-and-effect relationships between changes in the minimum wage and economic outcomes. We hope that the estimates presented in this post can complement these other types of information as policymakers consider the costs and benefits of potential changes to the state’s minimum wage policies.
Limitations of Survey-Based Estimates. Like many economic measurements, our estimates come from survey data. As described in the Appendix, various aspects of the data make our estimates imprecise, though we have tried to make them as accurate as possible.
Minimum Wage as Policy to Address Poverty
In this section, we compare the current statewide minimum wage of $16 per hour to two sets of benchmarks: (1) the U.S. Census Bureau’s official poverty measure, and (2) county-level housing cost estimates from the U.S. Department of Housing and Urban Development (HUD).
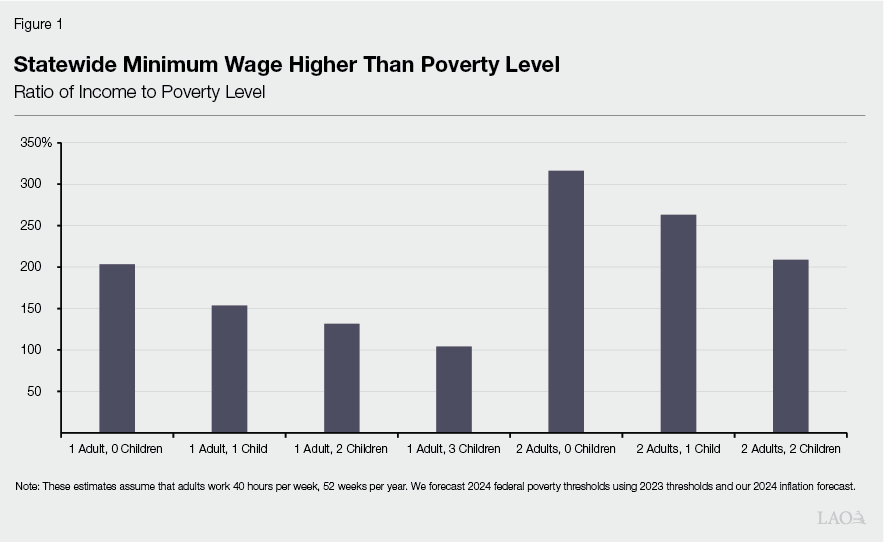
In Most Cases, Minimum Wage at Least Double the Poverty Level. Figure 1 compares the statewide minimum wage to the Census Bureau’s official poverty measure—a specified level of income based on family size. (We estimate the 2024 poverty thresholds using the 2023 thresholds and an inflation forecast.) For this comparison, we assume that each adult works for the statewide minimum wage 40 hours per week, 52 weeks per year, and that the household has no other sources of income. We make this comparison across several different types of households, with varying numbers of adults and children:
For a single parent with three children, the statewide minimum wage is right around the poverty level. For a single parent with four or more children (not shown in the figure), the minimum wage is below the poverty level.
For a single parent with one or two children, the statewide minimum wage is somewhat higher than the poverty level.
For the most common types of low-wage workers—those who do not have children or who live with at least one other worker—the minimum wage is at least two times the poverty level.
Official Poverty Measure Paints an Incomplete Picture. Although the official poverty measure is a prominent benchmark, it has some significant limitations. The measure does not, for example, provide a concrete comparison between household incomes and specific types of expenses. To shed light on this issue, we next compare the statewide minimum wage to housing costs across California’s 58 counties.
Measuring Housing Affordability. To assess housing affordability for minimum-wage workers, we compare monthly earnings for full-time workers making the main minimum wage in each county to HUD’s estimate of “fair market rent” for housing in that county. The main minimum wage is the minimum wage in the county’s biggest jurisdiction, reflecting the fact that many cities and a couple of counties have enacted minimum wages that exceed the state’s. Fair market rent is the 40th percentile of the rent distribution for a given apartment type (such as studios or two-bedrooms). We make these comparisons for seven different types of households, matching each household type to an apartment type that is modest but sufficient to avoid overcrowding (see the Appendix for details). Based on state and federal laws, we define housing as affordable if the rent falls below 30 percent of the household’s gross income.
Housing in Major Metro Areas Unaffordable for Minimum-Wage Workers. As shown in Figure 2, housing in California’s major metro areas and much of the Central Coast is unaffordable for minimum-wage workers in all seven types of households. For minimum-wage workers with a relatively favorable ratio of income to expenses—two workers without children—housing in many rural counties and some mid-size metro areas is affordable. Housing in some of California’s rural counties is affordable for two-minimum-wage-earner households with one or two children. In eight coastal counties, however, a household of two minimum-wage workers and one child faces housing costs that exceed half of their gross income.
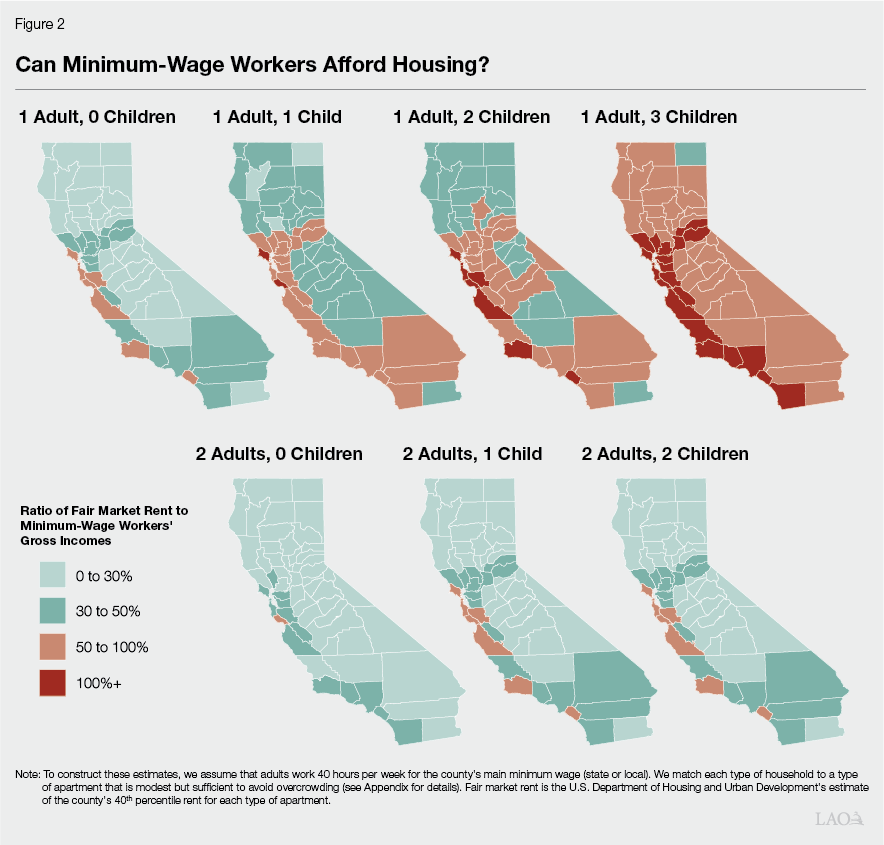
For Single Parents Making Minimum Wage, Housing Unaffordable Throughout California. For a single minimum-wage worker with one child, housing is unaffordable in all but three California counties. The affordability problem becomes more extreme if we focus on coastal areas or single parents with two or three children. In all counties but Modoc, a single minimum-wage worker with three children can expect to face housing costs that exceed half of their gross income. In 20 of those counties—including the most populous ones—such households faced housing costs that exceed 100 percent of their gross income.
Some Areas With Very High Housing Costs Do Not Have Local Minimum Wages. As noted above, the estimates in Figure 2 reflect not just the statewide minimum wage, but also higher minimum wages enacted by local governments. Jurisdictions with local minimum wages tend to be cities in high-cost coastal metro areas. Many high-cost areas, however, do not have such policies. In particular, in five of the of the state’s nine most expensive counties—Marin, Monterey, Orange, Santa Barbara, and Santa Cruz—just one city (Novato, $16.86 per hour) has a local minimum wage. Furthermore, even some of the counties that have relatively widespread local minimum wages—such as Santa Clara County—contain several cities without such policies. For minimum-wage workers in these cities, housing is even less affordable than the figure would suggest.
Minimum Wage as Policy to Address Inequality
In this section, we use data from the monthly Current Population Surveys (CPS) from January 2022 through December 2023 to estimate three measures of wage inequality. We focus on hourly wage inequality in the lower part of the wage distribution—in particular, the 10th percentile. We choose the 10th percentile because:
Nationwide estimates at the 10th percentile from other studies are available, providing convenient comparisons for our estimates.
Estimates of lower percentiles could be less accurate.
Estimates of higher percentiles are less closely connected to the minimum wage.
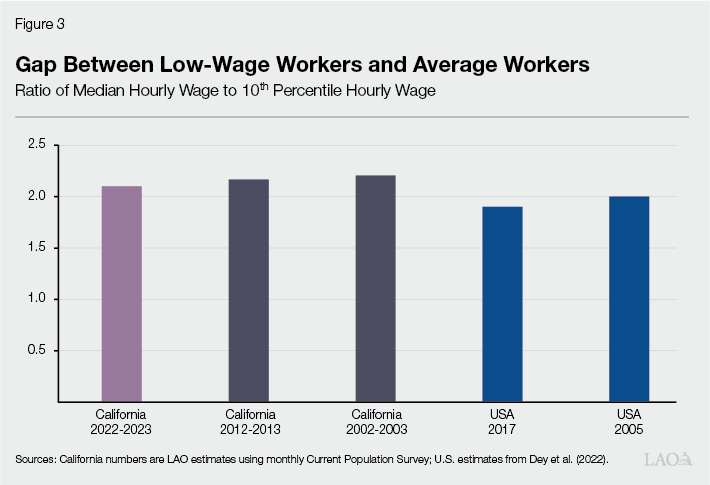
Gap Between Low-Wage and Average Workers Has Not Changed Much Over Last Decade. As shown in Figure 3, although California’s nominal minimum wage has doubled over the last decade, the hourly wage gap between low-wage (10th percentile) workers and average (median) workers has barely changed over that period. Put another way, wages for the average California worker have grown about as fast as wages for low-wage workers. Similarly, although California’s statewide minimum wage is more than double the federal minimum wage, the state’s gap between low-wage and average workers is not much different from recent nationwide estimates.
Minimum Wage Can Affect Other Inequalities. In principle, minimum wages can affect not just wage inequality broadly, but also wage gaps between demographic groups. Summaries of income inequality between gender, racial/ethnic, or other groups often focus on each group’s median annual earnings. We focus instead on each group’s 10th percentile hourly wages.
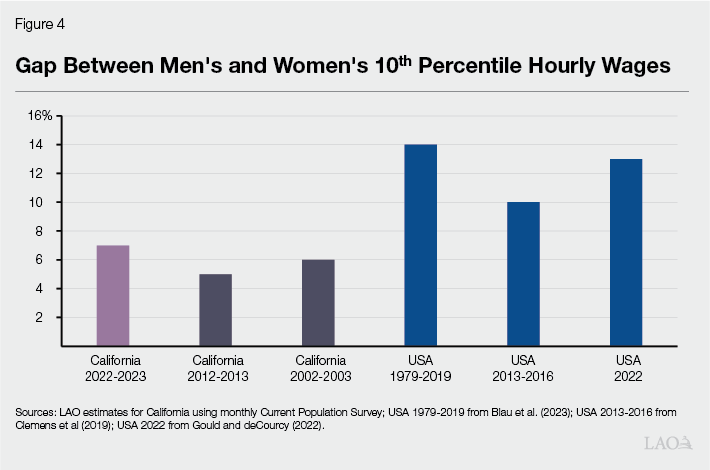
For Low-Wage Workers, Gender Wage Gap Around 5 Percent to 10 Percent. As shown in Figure 4, we estimate the wage gap between California’s male and female low-wage workers to be around 5 percent to 10 percent. In other words, we estimate the 10th percentile hourly wage for men to be roughly 5 percent to 10 percent higher than the 10th percentile hourly wage for women. This wage gap is smaller than national estimates, though still substantial. Like the broad wage gap discussed above, the gender wage gap among California’s low-wage workers does not appear to have changed much over the last couple of decades.
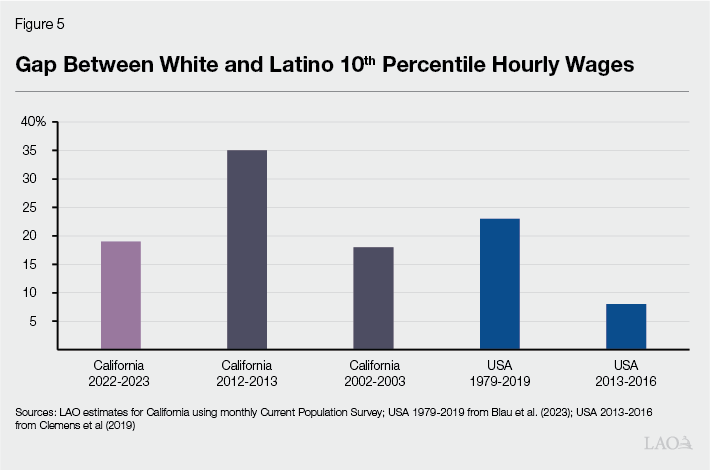
For Low-Wage Workers, White-Latino Wage Gap Around 20 Percent. As shown in Figure 5, we estimate the wage gap between California’s white and Latino low-wage workers to be around 20 percent. In other words, we estimate the 10th percentile hourly wage for white workers to be roughly 20 percent higher than the 10th percentile hourly wage for Latino workers. This is slightly below an estimate by Blau et al. (2023) for the U.S. over the last 40 years and substantially higher than an estimate by Clemens et al. (2019) for the U.S. over the period from 2013 to 2016. California’s white-Latino wage gap appears to have peaked one decade ago, right before the state started raising its minimum wage substantially. We estimate that this gap now is around the same level that it was 20 years ago.
Minimum Wage as Employment Policy
In this section, we consider whether California’s minimum wage is high or low from a labor market standpoint. To do this, we use data from the monthly CPS from January 2022 to December 2023 to compare the state’s current $16 per hour minimum wage to a couple of benchmarks:
The ratio of the current minimum wage to the full-time median wage in the two years before the minimum wage increased to $16 per hour.
The share of workers whose wages were at or below $16 per hour.
We also examine regional variation in wages using the Occupational Employment and Wage Survey.
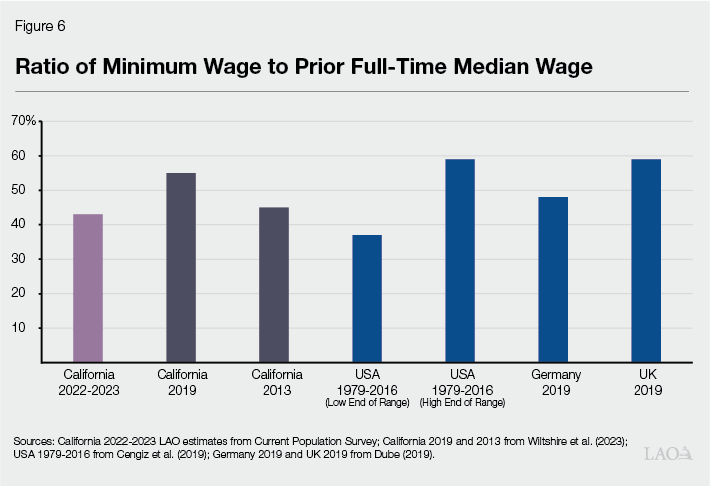
Statewide Minimum Wage Less Than Half of Full-Time Median. As shown in Figure 6, the 2024 statewide minimum wage is noticeably below half of the 2022-2023 full-time median wage. By this measure, the state’s minimum wage is around where it was one decade ago. It is comfortably within the range of minimum wage increases in the U.S. over the last four decades—closer to the bottom of that range than the top.
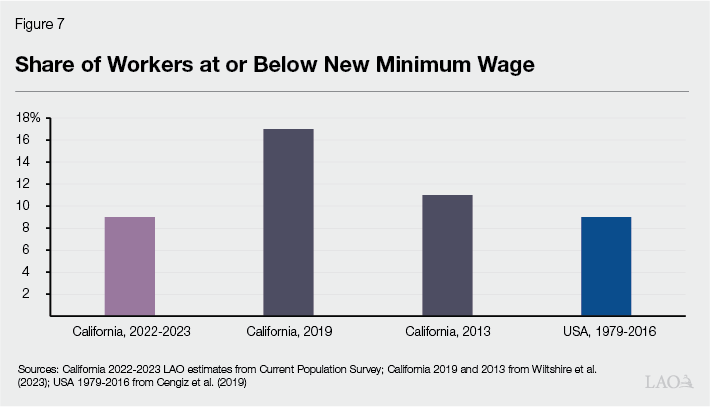
Coming Into 2024, Roughly 10 Percent of Workers Made $16 Per Hour or Less. As shown in Figure 7, in 2022 and 2023, roughly 10 percent of workers made no more than $16 per hour—the current statewide minimum wage. By this measure, California’s minimum wage is at the same level typically observed right after past minimum wage increases in the U.S. The state’s minimum wage was at a similar level one decade ago, right before it embarked upon the substantial increases noted above.
By Labor Market Measures, Minimum Wage Was Higher in 2019. The estimates in Figures 6 and 7 suggest that California’s minimum wage reached an atypically high level around 2019. Since 2019, general wage growth has outpaced prior trends. This broad wage growth apparently has reduced the upward pressure exerted by the statewide minimum wage.
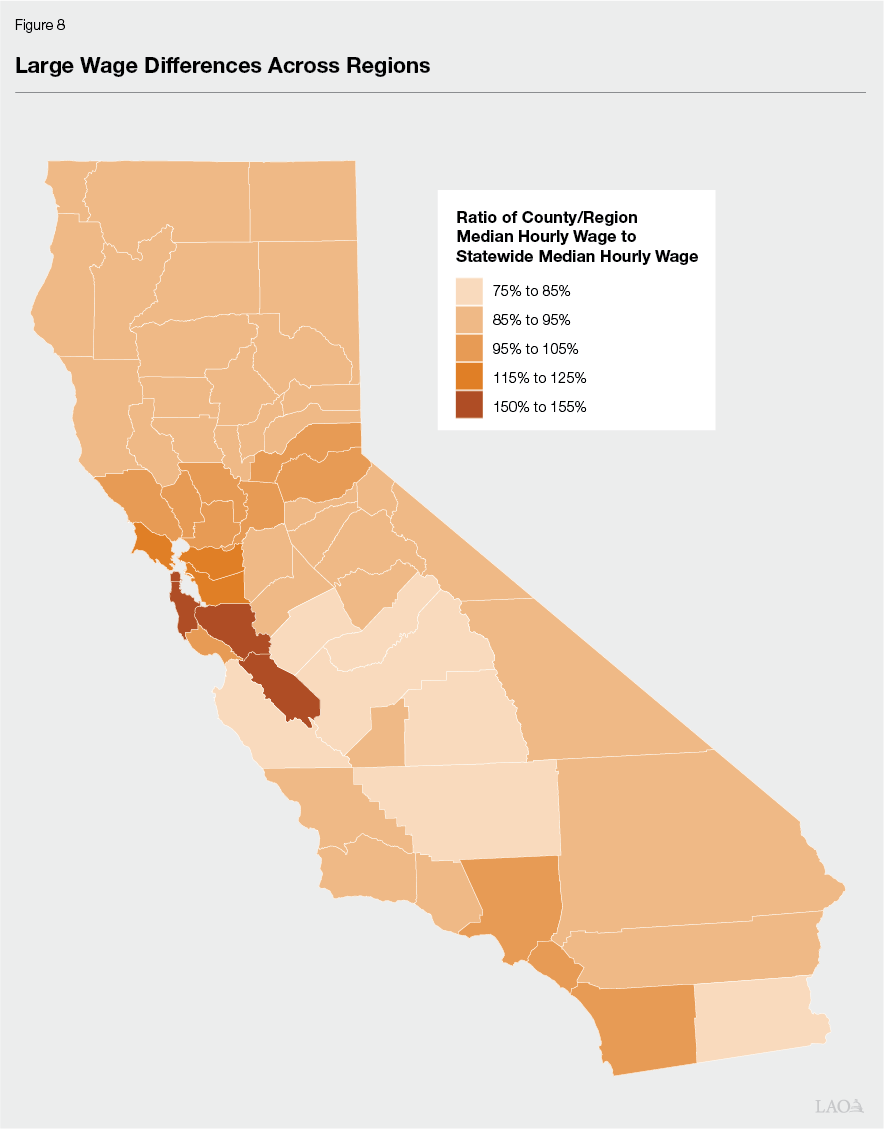
Wages Vary Substantially Across Regions. California contains various regional labor markets. As shown in Figure 8, wages vary quite a bit across California’s regions. At one end of the spectrum, average wages in Imperial County, Monterey County, and most of the San Joaquin Valley are about 20 percent lower than the statewide average. At the other end, average wages in the Bay Area are at least 20 percent higher—and in some counties, 50 percent higher—than the statewide average.
Some High-Wage Areas Do Not Have Local Minimum Wages. From an employment policy standpoint, the statewide measures described earlier suggest that the state’s minimum wage is not particularly high. This is especially true in the Bay Area, where wages are substantially higher than other parts of the state. In such a high-wage region, raising the minimum wage to a level somewhat higher than the statewide minimum wage likely has minimal effects on employment. Nevertheless, many Bay Area jurisdictions—including most parts of Marin County and Contra Costa County, and several jurisdictions in other counties—have not enacted local minimum wages.
Assessment
In this section, we summarize our findings and gauge whether California’s statewide minimum wage is high, low, or somewhere in between.
Income Policy. In the most basic sense, the statewide minimum wage is much higher than a "poverty wage." At the same time, the state’s high housing costs make it extremely difficult for many low-wage workers to make ends meet. Notably, however, housing in California’s major metro areas is unaffordable even for workers with wages well above the minimum wage. Without major changes in policies or market conditions that reverse California’s chronic undersupply of housing, raising the minimum wage would not make housing in these areas affordable for low-wage workers.
Inequality Policy. On one hand, we estimate that California’s low-wage gender gap is noticeably smaller than nationwide benchmarks. On the other hand, the state’s estimated gaps between white and Latino low-wage workers—and between low-wage and average workers—are similar to nationwide estimates. At the state level, these three measures of inequality do not appear to have changed appreciably over the last 20 years.
Employment Policy. Based on statewide labor market indicators, California’s minimum wage falls comfortably within the range observed in the U.S. over the last four decades—perhaps even a bit on the low side. Evidence from those policies suggests that further modest increases (beyond the inflation adjustments made under current law) likely would have modest effects, at most, on total statewide employment. That said, some parts of the state have much higher wages than others, so these labor market effects could vary across regions—particularly for larger minimum wage increases.
Statewide Minimum Wage Is Neither High Nor Low. Overall, compared to the benchmarks examined in this post, California’s statewide minimum wage is not particularly high or low. Depending on its policy preferences, the Legislature reasonably could consider sticking with the current policy (including the inflation adjustments) or enacting additional increases. A serious assessment of the costs and benefits of such actions, however, is beyond the scope of this post.
Regional Minimum Wages? Labor market conditions and the cost of living vary substantially across different parts of California, potentially warranting regional differences in minimum wages. So far, the state has approached this issue by setting a statewide minimum wage (and recently, industry-specific wages) and deferring to local government action on sub-state minimum wages. The resulting geographic differences in minimum wage policies are only loosely related to geographic differences in relevant economic conditions. In particular, many local governments in high-wage, high-cost areas have not raised their minimum wages above the statewide minimum. Going forward, the Legislature may wish to consider taking a more active role—perhaps by setting different minimum wages in different regions or by helping local governments coordinate their minimum wage policies.
Selected References
Blau, Francine, Isaac Cohen, Matthew Comey, Lawrence Kahn, and Nikolai Boboshko (2023). “The Minimum Wage and Inequality Between Groups.” National Bureau of Economic Research Working Paper 31725.
Cengiz, Doruk, Arindrajit Dube, Attila Lindner, and Ben Zipperer (2019). “The Effect of Minimum Wages on Low-Wage Jobs.” The Quarterly Journal of Economics 134(3).
Clemens, Austin, Kavya Vaghul, John Schmitt, and Will McGrew (2019). “Interactive: Comparing Wages Within and Across Demographic Groups in the United States.” Washington Center for Equitable Growth.
Dey, Matthew, Elizabeth Weber Handwerker, David Piccone Jr., and John Voorheis (2022). “Were Wages Converging During the 2010s Expansion?” Monthly Labor Review, U.S. Bureau of Labor Statistics, June 2022.
Dube, Arindrajit (2019). “Impacts of minimum wages: review of the international evidence.” Report for Her Majesty’s Treasury, United Kingdom.
Gould, Elise and Katherine DeCourcy (2023). “Gender Wage Gap Widens Even As Low-Wage Workers See Strong Gains.” Working Economics Blog, Economic Policy Institute.
Wiltshire, Justin, Carl McPherson, and Michael Reich (2023). “Minimum Wage Effects and Monopsony Explanations.” Washington Center for Equitable Growth Working Paper Series.