
March 11, 2024
California’s Low-Wage Workers and Minimum Wage
How Long Do People Stay in Low-Wage Work?
In discussions about minimum wages, policymakers often express differing views about mobility out of low-wage work. Some view low-wage jobs largely as entry-level stepping stones to higher-wage jobs. Others see low wages as a persistent feature of many workers’ careers. In this post, we present estimates to help inform this debate.
Unfortunately, we do not have state-level data that track individual workers over long periods. Instead, we use data from Monthly Current Population Surveys (CPS) to look at this issue indirectly in two ways:
One-Year Snapshot of Low-Wage Workers’ Ages. In the first approach, we simply look at a snapshot of the age distribution of low-wage workers in 2023. If most low-wage jobs were stepping stones to higher-wage jobs, then we would expect most low-wage workers to be young.
Cohort-Level Mobility Over Time. In the second approach, we use CPS data from 2002 through 2023 to track the how the rate of low-wage work changes over time for cohorts of workers born in the same year.
Limitations of Survey-Based Estimates. Like many economic measurements, our estimates come from survey data. As described in the Appendix, various aspects of the data make our estimates imprecise, though we have tried to make them as accurate as possible.
Age Distribution of Low-Wage Workers in 2023
Definition of Low-Wage Workers. In this section, we use the term “low-wage workers” to refer to employees who made up to $17.50 per hour at their main job in 2023. These workers likely would be affected directly by proposals to increase the statewide minimum wage.
Low-Wage Workers More Likely to Be Under 25 Than Mid-to-High-Wage Workers. As shown in Figure 1, just under 30 percent of low-wage workers are younger than 25. In contrast, less than 10 percent of mid-to-high-wage workers fall into this age group.
Half of Low-Wage Workers Are 35 or Older. Although many low-wage workers are young, many others are old enough to be well into their careers. Roughly half are at least 35 years old.
One-Quarter of Low-Wage Workers Are 50 or Older. The age distribution of low-wage workers extends well into middle age. More than one-quarter of low-wage workers are at least 50 years old.
Ages of Male and Female Low-Wage Workers Are Similar. Figure 1 shows that male and female low-wage workers have similar age distributions. Similarly, we do not observe large gender differences in the age distribution of mid-to-high-wage workers.
Estimates Very Similar Without Recent Immigrants. Figure 1 seems to suggest that many people stay in low-wage work for a long time, but it does not rule out some alternative explanations. One might speculate, for instance, that older low-wage workers tend to be recent immigrants who have not worked in the U.S. long enough to move into mid-to-high-wage jobs. To address this possibility, we estimate the age distribution again, this time only for workers who have lived in the U.S. for at least one decade. Figure 2 displays the results. These estimates are very similar to the numbers in Figure 1, indicating that recent immigration does not explain those age patterns.
Rates of Low-Wage Work as Workers Age
Although we do not have state-level data tracking specific individuals over long periods of time, the monthly CPS provides reasonably consistent measurements of workers’ ages and wages every month from 2002 through 2023. In this section, we aggregate data over this period to track cohorts of workers born in the same year to see how their rates of low-wage work change as they get older.
Cohort Example. Consider, for example, workers born in 1981. Using the repeated waves of the CPS, we estimate the share of such workers in low-wage jobs at age 25, age 26, and so on. Although those survey participants generally will not be the same individuals over time, this approach can give us a rough sense of workers’ mobility from low-wage jobs to mid-to-high-wage jobs. That said, other factors can affect these estimates to some degree. For example, when people born in 1981 enter or leave the labor force or migrate into or out of the state, that also affects our estimates.
Definition of Low-Wage Workers: Below 20th Percentile. In this section, we classify a job with a wage below the 20th percentile of the hourly wage distribution as a low-wage job. In contrast to the $17.50 per hour definition used in the prior section and another post, this definition has a consistent interpretation over a 20-year period.
Rate of Low-Wage Work Declines Substantially From Ages 25 to 32. As shown in Figure 3, our estimates suggest that the share of workers in low-wage jobs declines by more than one-third between the ages of 25 and 32. This decline suggests that a substantial share of workers spend just a handful of years in low-wage jobs before moving on to mid-to-high-wage jobs.
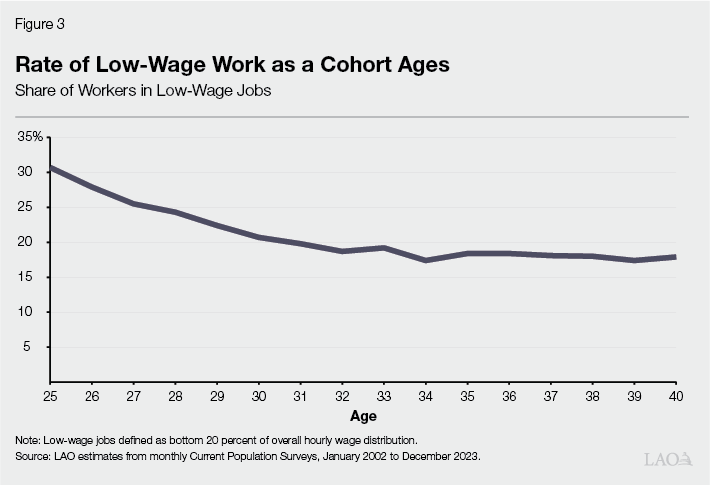
Much Lower Mobility After Age 32. Strikingly, net mobility out of low-wage work seems to stop abruptly when workers are in their early 30s. Between the ages of 32 and 40, the estimated rate of low-wage work declines so slowly that it is nearly flat. Of course, some workers at these ages presumably move from low-wage jobs to mid-to-high-wage jobs, but such movement does not appear to be much larger than movement in the opposite direction.
Substantial Share of Workers in Their Late Thirties Are in Low-Wage Jobs. Many workers are still in low-wage jobs as they approach middle age. When a cohort of workers reaches their late thirties, their rate of low-wage work has declined by less than half since they were 25. Some of these middle-aged low-wage workers are people who have recently entered or re-entered the labor force. That said, the overall labor force participation rate changes very little from age 25 to 40. This suggests that many low-wage workers in their late 30s likely have worked for many years with little upward mobility in their wages.
Overall Assessment
Low-Wage Careers Appear to be Common. Although the two sets of estimates presented above are based on different approaches and different time periods, a coherent story emerges. Low-wage workers tend to be younger than mid-to-high-wage workers. As workers age from their 20s to their early 30s, many of them move from low-wage jobs to mid-to-high-wage jobs. Mobility out of low-wage work, however, slows down dramatically when workers are in their early 30s. As a result, half of low-wage workers are over 35 and one-quarter are 50 or older. The state’s economic policies should reflect the fact that many workers hold relatively low-wage jobs through middle age and beyond.