Sonia Schrager Russo

June 16, 2025
Trends in CalWORKs
Participant Characteristics
- Introduction
- Background
- Caseload Trends and Characteristics
- Participant Demographic Characteristics
- Issues for Legislative Consideration
- Conclusion
Introduction
This report is the first of a three‑part series focused on trends in the California Work Opportunity and Responsibility to Kids (CalWORKs) program, which provides cash assistance and supportive services to California families experiencing poverty. Each part of the series focuses on an area of the program, beginning with this report on participant characteristics, followed by reports on participant experiences and program funding. The series provides an overview of the major changes to CalWORKs in recent decades and highlights key issues for the Legislature to consider when making CalWORKs policy and budget decisions.
This report first describes trends in the CalWORKs caseload over the last two decades, including across geographies and participant characteristics (for example, children versus adults). Understanding changes in caseload and the breakdown between adult and child participants, as well as how participation varies by county, can help the Legislature understand who has been served by CalWORKs over the program’s history.
The report then describes the demographic characteristics of CalWORKs participants and provides information on which groups of Californians are overrepresented (or underrepresented) in CalWORKs as compared to the general population and to Californians in poverty. Understanding common characteristics of CalWORKs participants and which California communities and families are disproportionately overrepresented or underrepresented in CalWORKs—and the possible reasons why—can help the Legislature understand who CalWORKs serves and determine how the program could be designed to better reach all eligible families.
Lastly, the report poses some questions on why certain groups might participate in CalWORKs at higher or lower rates. In part two of this series, Trends in CalWORKs: Participant Experiences, we will provide additional insight into some of these questions and further explore other factors potentially impacting CalWORKs participation and caseload in recent years, such as program awareness, benefits, and requirements.
Background
In this section, we provide background on the state population—with a particular focus on families in poverty—and the CalWORKs program. Throughout the report, findings are framed (where feasible and relevant) within the broader context of the state’s overall population to highlight how the CalWORKs caseload is similar to and different from the overall population.
California’s Population
California Population Increased Over Last Two Decades. As shown in Figure 1, about 34 million individuals resided in California in 2000. At the beginning of 2024, about 39 million individuals resided in the state, representing a population increase of about 16 percent (relative to 2000). However, year‑over‑year growth slowed in the last decade, with the state population slightly decreasing (year over year) in recent years.
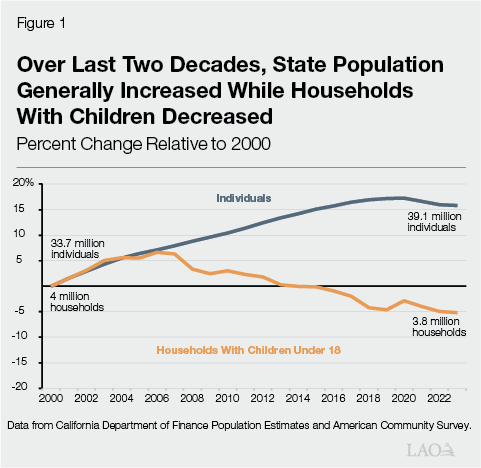
Households With Children Under 18 Decreased. As shown in Figure 1, households with children (under age 18) in California decreased from about 4 million households in 2000 to about 3.8 million in 2023. In 2000, about 35 percent of all California households had children (under age 18), while only 28 percent of households had children in 2023.
Multiple Factors Influenced Population Changes. In recent years, domestic outmigration was one factor in the state’s slowing population growth, with more people leaving California for other states than moving to the state each year. For many years, international migration generally offset these population losses. Since 2019, however, it has not. Changing demographics also played a role in the decreasing number and rate of households with children, as California’s population grew older and the state’s annual birth rate declined.
Poverty in California
People Living in Poverty Have Incomes Too Low to Afford Basic Needs. A family of three with annual income below $25,820 is considered to be living in poverty (under the 2024 federal poverty threshold). The state operates programs aimed at assisting Californians in poverty—including CalWORKs—by providing eligible individuals and families with income supports and other benefits to assist them in meeting their basic needs.
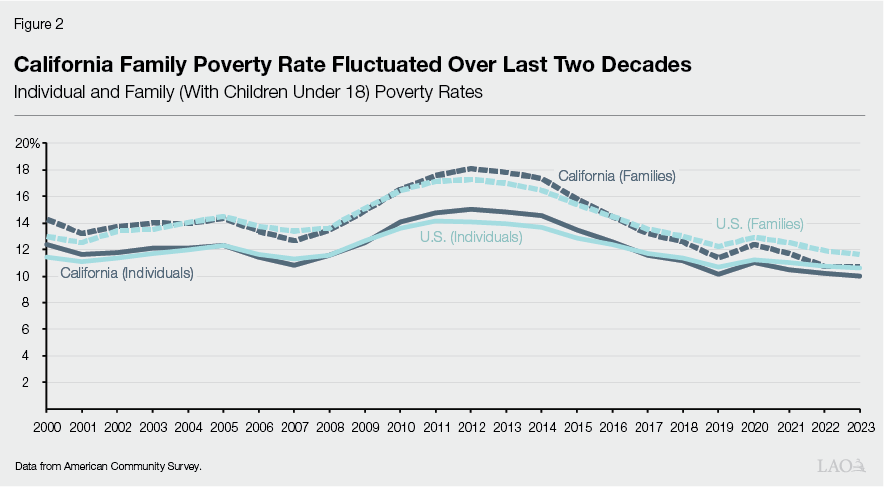
State Poverty Rates Fluctuated Over Last Two Decades. As shown in Figure 2, California’s official individual and family (with children under age 18) poverty rates fluctuated over the last two decades. Official poverty rates are based on federal poverty levels (FPL), which are income thresholds under which a family is considered to be in poverty. Poverty thresholds vary based on the family’s size. Official poverty rates generally increase during economic downturns (for example, from 2007 to 2011 during and immediately following the Great Recession) and decrease as the economy improves. In the last decade, state poverty rates generally decreased year over year. Annual poverty rates in California have generally been within 1 percentage point of national poverty rates over this period. Over the last five years, annual California poverty rates were generally lower than national rates.
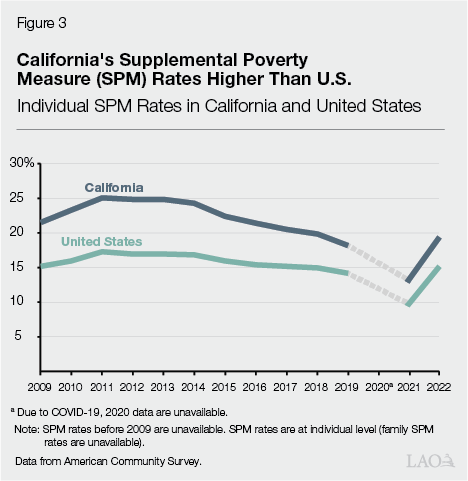
California Supplemental Poverty Rates Were Higher Than National Rates. Poverty can also be measured using the supplemental poverty measure (SPM). The SPM aims to account for forms of public assistance not included in the official poverty rate and adjusts income thresholds for additional factors, such as cost of living. As shown in Figure 3, California’s SPM rates were consistently higher than national SPM rates over the last decade, largely due to the state’s high cost of living. (The nearby box describes why state and national SPM rates decreased during the COVID‑19 pandemic and increased shortly after, while FPL rates increased and then decreased during and after the pandemic.)
Poverty During the COVID‑19 Pandemic
California’s Official Poverty Rate Increased Somewhat in Response to COVID‑19‑Related Economic Downturn. California’s official poverty rate increased somewhat in 2020 (by 1 percentage point as compared to 2019). This increase was largely due to the COVID‑19‑related economic downturn. In 2022, the poverty rate decreased back to pre‑pandemic levels.
During and After COVID‑19 Pandemic, Official and Supplemental Poverty Rates Moved in Opposite Directions. While California’s official poverty rate increased during the COVID‑19 pandemic (and later decreased as the economy improved), the supplemental poverty measure (SPM) rate decreased in 2021 (as compared to 2019) and later increased.
SPM Rate Changes During and After COVID‑19 Pandemic Were Largely Due to Temporary Benefits. In response to the economic consequences of the COVID‑19 pandemic, many state and federal benefits for lower‑income or unemployed individuals (such as unemployment insurance and tax credits) were temporarily expanded. The decreases in national and state SPM rates in 2021 (relative to 2019) were largely due to these expansions, as the SPM reflects economic supports in household income. SPM rates increased in 2022 (relative to 2021) as many of the expansions ended.
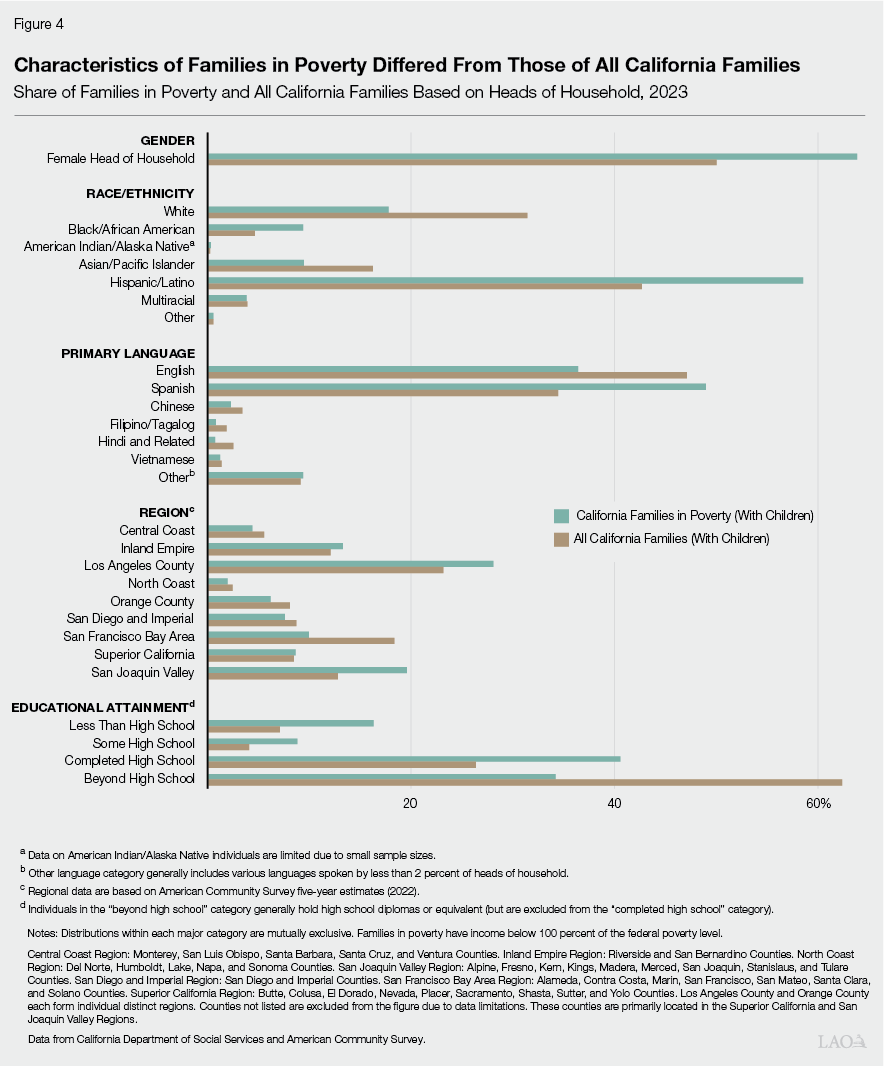
Poverty Disproportionately Affects Different Groups of Californians. Certain demographic groups experience poverty at disproportionate rates. A disproportionality occurs when one group’s percentage in a target population—which, in this case, is Californians in poverty—differs from that group’s percentage in the base population—or, in this case, Californians of all income levels. Figure 4 provides information on the general characteristics of California families in poverty as compared to all California families (both with children). Key characteristics of families in poverty in 2023 include:
- Disproportionately Female. About 64 percent of families in poverty (as compared to 50 percent of all California families) had female heads of household.
- Disproportionately Hispanic. About 59 percent of families in poverty were Hispanic. By comparison, no one racial/ethnic group made up the majority of all California families, although Hispanic was the single largest racial/ethnic group among all California families at about 43 percent.
- Disproportionately Spoke Spanish. The most common primary language of families in poverty (Spanish) differed from the most common primary language of all families (English).
- Disproportionately Concentrated in Los Angeles County and San Joaquin Valley. Across the state’s regions, the largest concentrations of families in poverty were in Los Angeles County (28 percent) and the San Joaquin Valley (20 percent). Los Angeles County (23 percent) and the San Francisco Bay Area (18 percent) were the most common places California families resided.
- Disproportionately Lower Levels of Educational Attainment. About one‑quarter of heads of household in poverty had not completed high school, compared to about 11 percent of all heads of household who had not completed high school. About one‑third of heads of household in poverty had completed education beyond high school, as compared to about 60 percent of all heads of household.
CalWORKs
CalWORKs provides cash assistance and supportive services to low‑income families with children. The program is administered by counties and overseen by the California Department of Social Services (CDSS).
CalWORKs Created in Response to 1996 Federal Welfare Reform. Federal welfare reform legislation of 1996 substantially changed the United States welfare system. The centerpiece of the legislation—the Temporary Assistance for Needy Families (TANF) block grant program—replaced the Aid to Families with Dependent Children (AFDC) entitlement program. CalWORKs—which largely serves as California’s version of the national TANF program—was created in 1997. In 2023‑24, about 890,000 individuals (in about 350,000 families) participated in CalWORKs, making up over 30 percent of all TANF recipients nationwide (by comparison, California residents made up about 12 percent of the overall United States population in 2023).
TANF Program Has Four Purposes. The four stated purposes of TANF are: (1) assisting needy families so children can be cared for in their own homes; (2) reducing the dependency of needy parents by promoting job preparation, work, and marriage; (3) preventing out‑of‑wedlock pregnancies; and (4) encouraging the formation and maintenance of two‑parent families. States receive annual fixed TANF block grants to administer programs designed to meet (one or multiple) TANF purposes. Federal law allows for some state flexibility in the use of federal TANF funds; however, TANF includes federal participant requirements and time limits (many of which were not included in the AFDC program), described in more detail later.
Federal, State, and County Governments Share Program Costs. California receives $3.7 billion annually for its TANF block grant (which generally does not change from year to year), over $2 billion of which goes to CalWORKs. The remainder of the state’s grant helps fund aid for some low‑income college students and various other human services programs. In 2023, California received about 22 percent of all TANF funds nationwide. States’ TANF grant amounts (which generally do not change from year to year) are largely based on how much federal AFDC funding each state received before TANF replaced the AFDC program in 1996 (AFDC funding was formula‑based and largely driven by caseload and state economic conditions). To receive its annual TANF block grant, the state must spend a maintenance‑of‑effort (MOE) amount from state and local funds to provide services for families eligible for CalWORKs. This MOE amount is approximately $3 billion annually, which can be spent directly on CalWORKs or other programs that meet TANF requirements.
CalWORKs Provides Cash Assistance and Supportive Services to Low‑Income Families. To qualify for CalWORKs, families generally must earn less than about 80 percent of the FPL (about $20,000 annually or $1,700 per month for a family of three in 2024) and have limited savings or other assets. CalWORKs cash grants vary based on region, number of eligible family members, and income. Families living in high‑cost coastal counties such as Los Angeles and San Francisco receive grants about 5 percent higher than similar families living in inland counties such as Fresno and Shasta. In general, grant sizes increase as family size increases and decrease as family income increases. In 2023‑24, the administration estimated the average CalWORKs grant to be $1,000 per month across all family sizes and income levels. Recipients are often also eligible to receive supportive services and resources, such as subsidized child care, employment training, mental health counseling, and housing assistance.
Program Eligibility Based on Various Factors in Addition to Income. Only families with children under age 18 can qualify for CalWORKs, with limited exceptions. Eligibility status can also vary by individual within a family. States have some flexibility in setting eligibility requirements. Figure 5 describes the CalWORKs eligibility requirements and the nearby box describes how CalWORKs eligibility requirements interact with federal TANF requirements. Generally, if an individual is ineligible for CalWORKs, other members of the family (including children) who themselves meet eligibility requirements can receive assistance.
Figure 5
CalWORKs Eligibility Requirements
|
Family Eligibility |
|
|
Individual (Within Eligible Family) Eligibility |
|
|
aPregnant women can also be eligible. bThe CalWORKs asset limits are generally higher for families with individuals who are age 60 or older or disabled. cBoth the CalWORKs and federal TANF aid limits are 60 months. The CalWORKs limit only factors in months an individual has received CalWORKs assistance, while the federal limit factors in months the individual previously received TANF assistance in another state. An adult CalWORKs recipient who has exceeded the federal time limit but has time remaining under the CalWORKs limit can generally continue to receive aid (via state funds). Children of adults who have reached the state time limit can generally continue receiving aid. |
|
Note: There are also various other requirements CalWORKs participants must meet to maintain eligibility, which are not included in this figure. |
|
FPL = federal poverty level and TANF = Temporary Assistance for Needy Families. |
Interactions Between Federal TANF Policies and CalWORKs Eligibility Requirements
Federal Law Generally Sets Basic Eligibility Requirements for TANF‑Funded Programs, With Some State Flexibilities. As previously mentioned, states have some flexibility in setting eligibility requirements for state Temporary Assistance for Needy Families (TANF) programs such as the California Work Opportunity and Responsibility to Kids (CalWORKs) program. Federal law requires that TANF recipients be “needy,” but does not set specific income or asset requirements. Therefore, income and asset limits for TANF‑funded programs vary by state. As of July 2022, California had one of the highest income limits nationwide and a higher asset limit than 40 other states.
States also have the flexibility to set eligibility requirements beyond income or asset levels to determine a family or individual’s need. For example, as described in Figure 5, California requires that children receiving CalWORKs be determined to by “deprived” of parental support and care due to the incapacity, death, or absence of a parent, or, in two‑parent families, unemployment of the principal wage earner. There are no federal eligibility rules on child deprivation and, as of 2022, few states had similar rules in place.
Cash Grants Based on Number of Eligible Family Members, Not Overall Family Size. Monthly grant amounts are set according to the size of the assistance unit (AU). The size of the AU is the number of CalWORKs‑eligible people in the household. Grant amounts are adjusted based on AU size—larger AUs are eligible to receive a larger grant amount—to account for the increased financial needs of larger families. As of December 2023, about 40 percent of CalWORKs cases included everyone in the family, making the AU size and the family size the same. In the remaining 60 percent of cases, one or more family members were ineligible for CalWORKs (such as those ineligible due to citizenship status or receipt of Supplemental Security Income [SSI], for example) and therefore the AU size was smaller than the family size.
Many Adult Participants Must Meet Participation Requirements. Per federal and state program rules, most adults receiving CalWORKs grants must be employed or participate in specified activities intended to lead to employment, known as welfare‑to‑work (WTW) activities for 20 to 35 hours per week (with some exceptions, such as adults who are over age 60, disabled, or caring for a child under six months of age). If adult participants do not meet the WTW requirements, they may be sanctioned, leading to a grant reduction.
The Federal Government Measures Program Success Through Work Participation Rate (WPR) Requirements. A state’s WPR is the percentage of adult participants engaging in required WTW activities. The WPR is currently the only federal measure of program performance. Under federal rules, at least 50 percent of all families and 90 percent of two‑parent families receiving CalWORKs (with work‑eligible adults in the family) must work or engage in WTW activities for the requisite number of hours per week. Federal law outlines specific WTW activities that count toward the WPR requirements.
States May Face Financial Penalties for Failing to Meet WPR Requirements. Federal financial penalties for failing to meet the WPR requirements can start at 5 percent of a state’s annual TANF grant. Penalties can increase (up to a maximum penalty of 21 percent) each successive year a state fails to meet the requirements. States generally may appeal penalties (for example, by claiming reasonable cause for failure to meet the WPR requirements). A state that meets the all families requirement (50 percent participation) but not the two‑parent requirement (90 percent participation) may incur a smaller penalty than it would if it had failed to meet both requirements. While California has failed to meet the WPR in some instances, the state has not paid penalties to date. (However, California was notified in January 2025 that its 2026 TANF grant would be reduced by about $20 million as the state’s final WPR penalty for failing to meet the two‑parent WPR requirements in 2012 through 2014. According to the administration, the state’s assessed penalty amount for these years was decreased from the originally assessed penalty amount of over $1 billion to the final amount of about $20 million through the penalty dispute process and completion of a corrective compliance plan. More information on this penalty assessment will be provided in our future post on the final June 2025 spending plan.) Moreover, due to changes regarding the measure of the WPR, the state is likely to meet federal WPR requirements for the next few years (described further in our recent post The 2024‑25 Budget: Overview of the Federal Fiscal Responsibility Act’s Impacts on CalWORKs).
Federal WTW Requirements Focus on Core WTW Activities. As mentioned, the federal government requires most adult TANF recipients to participate in WTW activities for a certain number of hours each week. Federal rules also dictate how many of those hours must be spent on work or work‑like activities, which are called “core” WTW activities. To fulfill federal requirements (and to be counted as meeting the WTW requirements in a state’s WPR), most individuals must spend the majority of their WTW hours on core activities. Core activities include, but are not limited to, employment, community service, and job search activities. Noncore activities include certain job skills training and educational activities (with some exceptions).
States Have Some Flexibility in the Types of WTW Activities and Services Provided. In 2012, the state modified rules governing allowable WTW activities. The modified WTW rules provide greater flexibility for CalWORKs participants to receive services aligned with addressing barriers to employment, such as mental health issues. California’s rules provide more flexibility than the federal rules on the types of activities that can be counted towards WTW participation. Additionally, California does not dictate how many hours an individual must spend on core activities. Therefore, some CalWORKs participants meet their WTW requirements through mostly noncore activities, such as barrier removal or education. Generally, individuals who spend more time on noncore activities than is allowable under federal rules are included in the state’s work‑eligible caseload (the WPR’s denominator), but are excluded from the number of cases meeting the WTW requirements (the WPR’s numerator). These individuals may be meeting the state’s WTW requirement—therefore avoiding a sanction—but not meeting the federal WTW requirement, which negatively impacts the WPR.
California Made Various Program Changes Over Last Decade. Some notable changes are outlined below. A more detailed time line of changes can be found on the CDSS website.
- Increased Cash Grants. Since, 2010‑11, maximum cash grants for a family of three in a high‑cost county increased over 70 percent (about $500). These increases were provided by both formula‑driven and one‑time increases to grant levels. As a result of these increases, maximum cash grants now provide assistance levels similar to 50 percent of the FPL (based on the number of CalWORKs‑eligible individuals in a family). Prior to these increases, grants were about 40 percent of the FPL. Additionally, until 2017, a family generally could not receive an increase to its monthly grant after the birth of a new child (with some exceptions) under the maximum family grant (MFG) policy. This policy was repealed in the 2016‑17 Budget Act.
- Increased Adult Recipient Time Limits. The adult lifetime aid limit changed twice between 2010 and 2024. In 2011, it was reduced from 60 months to 48 months (in an effort to reduce costs). In 2022, the limit increased from 48 months to 60 months.
- Increased Earned Income Disregard (EID). The EID for applicants and participants (or the monthly dollar amount applicants and participants can earn before further income affects eligibility) changed multiple times over the last decade. Most recently, the EID increased from $90 to $450 for applicants (as of March 2023) and from $225 to $600 for participants (as of June 2022).
- Modified Reporting Requirements. In 2012, participant reporting requirements for certain case types were modified, decreasing the frequency with which many households must verify income.
- Expanded Supportive Services. California introduced multiple new programs designed to provide additional supportive services to CalWORKs participants, including family stabilization in 2013 (which provides intensive case management and services to recipients experiencing crises), the housing support program in 2014 (which assists recipients experiencing homelessness in obtaining permanent housing), and the home visiting program in 2019 (which provides home‑based services to pregnant women and families with young children).
- Established New Program Performance Measurement. California established the CalWORKs Outcomes and Accountability Review (Cal‑OAR), a local program management system, through the 2017‑18 Budget Act. Cal‑OAR is designed to facilitate improvement of county CalWORKs programs through the collection, analysis, and dissemination of program outcomes and best practices. The system, implemented in July 2021 (after a COVID‑19 related delay in 2020‑21), includes various performance measures, including on engagement, participation, supportive service delivery, and post‑program outcomes.
Caseload Trends and Characteristics
In the following sections, we describe trends in the CalWORKs caseload, including across geographies and participant characteristics (for example, children versus adults). Understanding how caseload has changed over the last two decades, how participation varies by county, and how the breakdown between adult and child participants has changed over time can help the Legislature understand who has been served by CalWORKs over the program’s history.
Caseload Over Time
Historically, Caseload Generally Increased Following Economic Downturns. During economic downturns, many households lose jobs and other sources of income. Some of these households enroll in CalWORKs. Historically, families generally enrolled in CalWORKs after exhausting other sources of economic support like unemployment benefits. As such, CalWORKs caseload often began increasing about a year (or more) after an increase in the state’s unemployment rate. As shown in Figure 6, caseload reached its all‑time high (about 600,000 households) in late 2010‑11 following the Great Recession. From early 2011‑12 to late 2019‑20 (prior to the COVID‑19 pandemic), caseload mostly declined as the state’s economy improved.
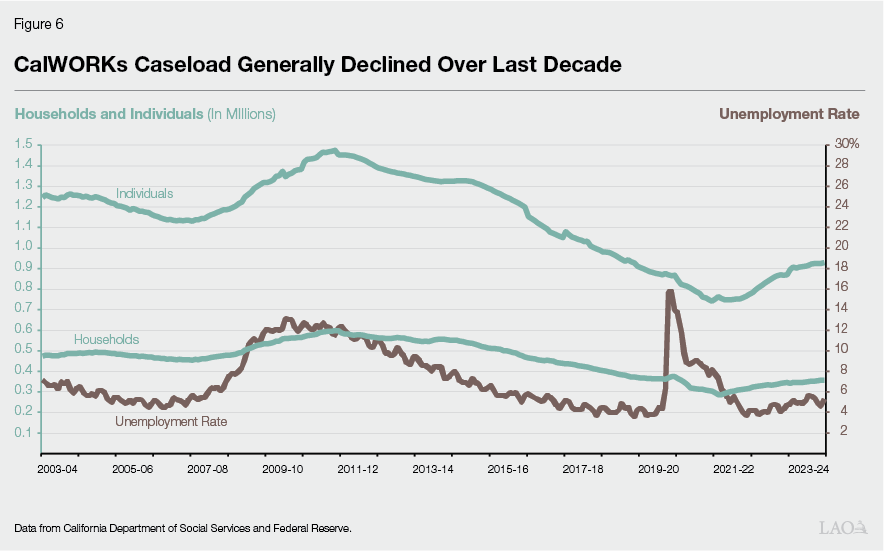
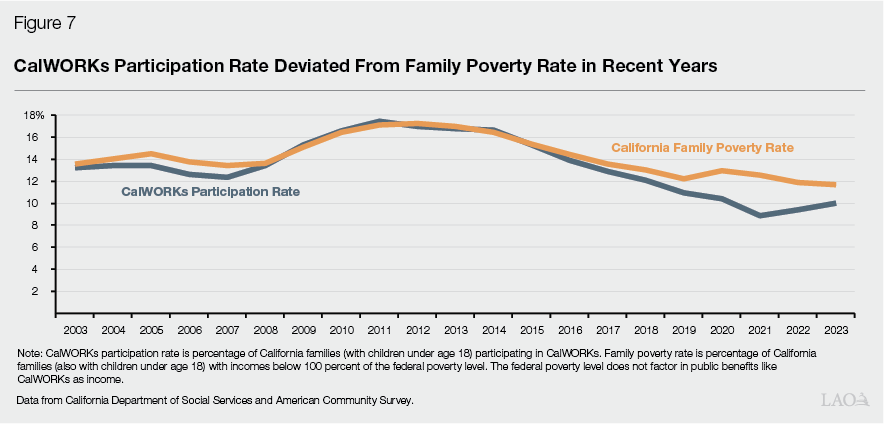
Historically, Year‑Over‑Year Caseload Changes Generally Were Also Similar to Year‑Over‑Year Changes in Family Poverty Rate. As shown in Figure 7, historically, year‑over‑year changes in the percentage of California families (with children under 18) participating in CalWORKs—referred to in this report as the CalWORKs participation rate and described further in the nearby box—were generally similar to year‑over‑year changes in the poverty rate of California families with children under 18 (as would be expected given the income‑based eligibility rules for CalWORKs).
How Is the CalWORKs Participation Rate Different Than the CalWORKs Take‑Up Rate?
Throughout this report, we reference the percentage of all California families (with children under 18) participating in the California Work Opportunity and Responsibility to Kids (CalWORKs) program, which we refer to as the CalWORKs participation rate. In a series of posts, Comparing CalWORKs Take‑Up Rates Across Demographic Groups, we estimated the CalWORKs take‑up rate—or the percentage of eligible individuals who are actually enrolled in the program—to be about 60 percent in 2019. (In February 2025, the California Department of Social Services [CDSS] also released information on the annual CalWORKs take‑up rate, available on the CDSS website. According to CDSS, the 2019 and 2023 CalWORKs take‑up rates were about 58 percent and 54 percent, respectively.) The CalWORKs participation rate differs from the CalWORKs take‑up rate in that it considers all families with children statewide (including those who are not eligible for the program), while the take‑up rate focuses only on likely eligible families (for example, households that meet the income and categorical requirements for CalWORKs). Therefore, the CalWORKs participation rate is, by definition, far lower than the CalWORKs take‑up rate. For example, the CalWORKs participation rate was about 10 percent in 2019.
However, Caseload Declined During and Immediately After COVID‑19 Pandemic Despite High Unemployment and Poverty. As shown in Figure 6, the state’s unemployment rate reached historic highs during the COVID‑19 pandemic (peaking at about 16 percent in May 2020). Similarly, as shown in Figure 7 and described earlier, the state’s poverty rate (among families with children) also increased year over year in 2020. Despite increased unemployment and poverty, CalWORKs caseload generally declined during and immediately following the COVID‑19 pandemic. In fact, CalWORKs caseload reached a historic low of about 285,000 households in August 2021, representing decreases of about 22 percent relative to pre‑pandemic caseload in February 2020 and about 52 percent relative to its peak in June 2011. We discuss why this decrease in caseload might have occurred in the next section.
Caseload Generally Increased Month Over Month Beginning September 2021. After beginning to increase in late 2021, caseload reached about 360,000 households at the end of 2023‑24 (an increase of about 25 percent relative to August 2021). Based on estimates from our office and the administration, caseload is likely to reach pre‑pandemic levels in 2025‑26 or 2026‑27.
Key Caseload Trend Findings
In Recent Years, Caseload Trend Deviated From Poverty Trend. Although the gap between the CalWORKs participation rate and the poverty rate was greatest during the pandemic, these trends started to diverge in 2015. During the pandemic, the differences between these rates likely were impacted by temporary pandemic assistance. However, the earlier—and continued—divergence indicates other factors may be impacting participation. We will explore these other factors—such as program awareness, benefits, and requirements—in part two of this series, Trends in CalWORKs: Participant Experiences.
Caseload Changes During and After COVID‑19 Pandemic Likely Reflected Impacts of Increased Temporary Benefits Outside CalWORKs. As mentioned, despite all‑time high unemployment during the COVID‑19 pandemic, caseload generally declined throughout and immediately following the pandemic. As discussed in our budget analysis at the time, various state and federal benefits outside of CalWORKs were temporarily expanded and extended during the pandemic. Many of these benefits—such as stimulus payments and unemployment insurance—had fewer recipient requirements or simpler application processes than CalWORKs. The increased availability of other benefits likely led some CalWORKs‑eligible families to utilize these benefits rather than apply for CalWORKs. Further illustrating the likely impact of temporary expansions in other programs, CalWORKs caseload began increasing in late 2021 (after months of decline) when many of the other expanded benefits ended or were reduced.
Changes in State Caseload Generally Aligned With Changes in National TANF Caseload. Over the last decade, CalWORKs cases made up 30 percent to 35 percent of national TANF cases annually. Both the CalWORKs caseload and the national TANF caseload declined from 2010 to 2021 (at similar annual rates) in concert with the ongoing post‑Great Recession economic expansion and declining national and state poverty rates. As also occurred in the CalWORKs caseload, the national TANF caseload reached its lowest levels of the last decade in 2021, after which it began increasing at similar annual rates as the CalWORKs caseload.
Geography
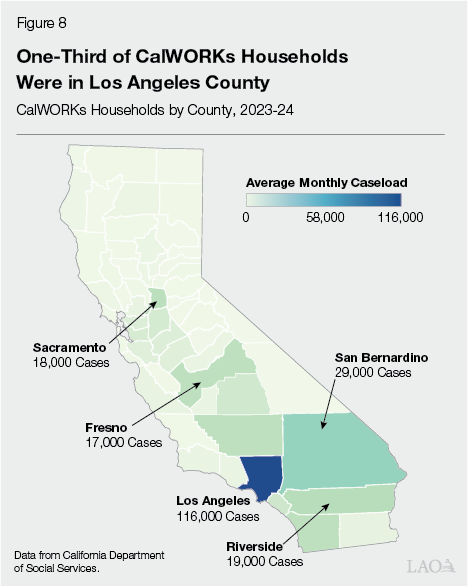
Caseload Varied by County. As shown in Figure 8, about 34 percent of CalWORKs households were located in Los Angeles County in 2023‑24. The second and third largest proportions of cases (relative to other counties) were in San Bernardino (9 percent) and Riverside (6 percent).
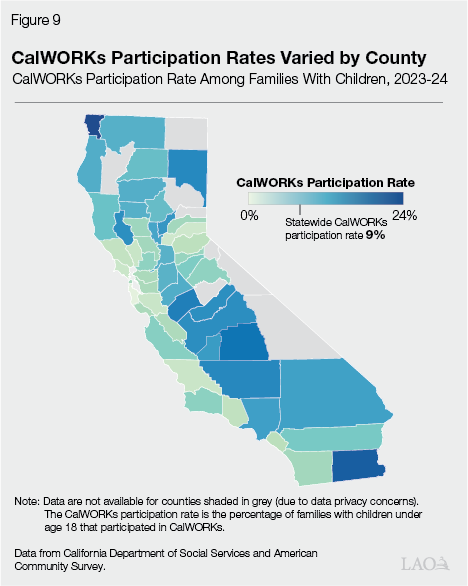
County CalWORKs Participation Rates Varied. As previously described, the CalWORKs participation rate is the percentage of all California families (with children under 18) participating in CalWORKs. As shown in Figure 9, the statewide CalWORKs participation rate was about 9 percent in 2023‑24. However, across counties, county‑level CalWORKs participation rates (among families with children) varied from under 3 percent in certain counties (such as San Mateo, Placer, and Marin Counties) to over 20 percent in other counties (such as Del Norte and Imperial Counties).
Key Geographic Findings
Some Geographic Variation in Participation Likely Explained by Where More People, Especially Those in Poverty, Live. Californians—including those in poverty—are particularly concentrated in certain areas. For example, in 2023, about one‑quarter of all Californians and almost one‑third of Californians in poverty lived in Los Angeles County, the state’s most populous county. This concentration of residents likely partially explains why CalWORKs cases were also concentrated in many of these areas (like Los Angeles County).
However, Drivers of Other Variation Less Clear. Family poverty rates generally exceed CalWORKs participation rates (among families with children) both at the county and statewide level. This is because not all families in poverty are eligible for CalWORKs and some eligible families are likely not participating. However, in 2023‑24, the extent to which county‑level family poverty rates exceeded CalWORKs participation rates varied from county to county. For example, urban counties generally had poverty rates and CalWORKs participation rates that were somewhat more similar than rural and suburban counties. This means there may be characteristics of urban counties that resulted in higher CalWORKs participation. We pose some questions on why this may be the case in the “Issues for Legislative Consideration” section.
CalWORKs Family Composition
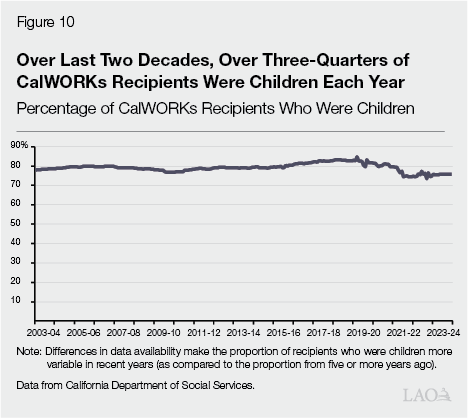
Over Three‑Quarters Of Recipients Were Children… As shown in Figure 10, children made up over three‑quarters of CalWORKs recipients annually for the past two decades. By comparison, the percentage of individuals in the state who were children decreased from about 28 percent in 2000 to about 22 percent in 2023.
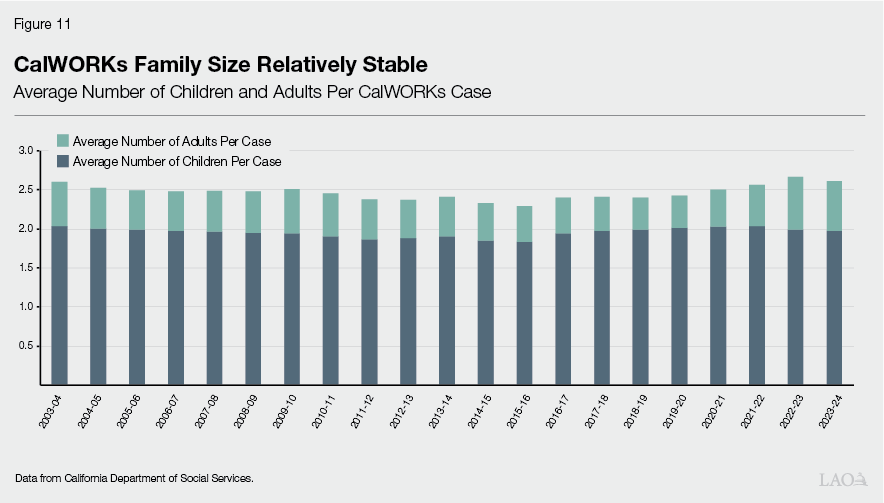
...With About Two Children and 2.5 Individuals Per Case, on Average. In 2023‑24, the average number of child recipients (under age 18) per CalWORKs household was about two children, as shown in Figure 11. The average number of individuals per CalWORKs household was about 2.5 people. Statewide, the average number of children per family (with children under 18) was also about two children, with about 3 individuals per family (among families with children under 18).
Key CalWORKs Family Composition Findings
In Many CalWORKs Households, at Least One Family Member Is Not Eligible. In about 60 percent of cases, one or more family members (who are often adults) are ineligible for CalWORKs. Various factors—including citizenship status, receipt of SSI, or receipt of CalWORKs for an extended period of time in the past—can render an individual ineligible while other family members are eligible.
Limited Insight Into Overall Family Makeup. Demographic data are generally only collected on eligible family members, limiting the conclusions that can be drawn about family makeup. For example, in 2023‑24, the average AU size was 2.6 individuals. However, the average family size—including ineligible individuals—was unknown. We discuss this data limitation further, including its impacts and potential options to address the limitation, later in the “Issues for Legislative Consideration” section.
High Share of Recipients Who Are Children May Be Partially Explained by How Program Eligibility and Participation Requirements Differ for Adults and Children. Generally, an adult member of an income‑eligible family faces more eligibility criteria and participation requirements than a child in the family (for example, the lifetime aid limit of 60 months and WTW requirements). Most adult participants can be sanctioned if they do not meet WTW requirements or have their aid discontinued if they meet the lifetime aid limit. When adults are sanctioned or have extinguished their grant eligibility (timed‑out), they are no longer included in the caseload. However, eligible children (under age 18, with limited exceptions) of sanctioned or timed‑out adults generally can continue receiving aid. Additionally, eligible children of adults who are categorically ineligible (for example, those who do not meet citizenship requirements or who receive SSI, as mentioned previously) are also generally able to receive aid.
Number of Children Per Case Did Not Substantially Change Following MFG Repeal. As previously mentioned, until 2017, a family generally could not receive an increase to its monthly grant after the birth of a new child (with some exceptions) under the MFG policy (newly born children were, therefore, excluded from the caseload). This policy was repealed in the 2016‑17 Budget Act. After the repeal of this policy, the average number of children per case generally remained at about two children per case.
Percentage of Recipients Who Were Children Was Similar in California and Nationwide. In 2023, about 71 percent of TANF recipients nationwide were children, compared to about 75 percent of CalWORKs participants. CalWORKs and TANF caseload data are not directly comparable, as California provides state‑funded benefits to some recipients who may not meet federal TANF requirements, such as children of some timed‑out adults. After excluding individuals in these non‑federally eligible cases, about 70 percent of California recipients were children in 2023. Across states, the percentage of TANF recipients who were children ranged from 53 percent in Kansas to 98 percent in Idaho.
Participant Demographic Characteristics
In the following sections, we describe the demographic characteristics of CalWORKs participants. As described earlier in the “Poverty in California” section, some demographic groups—such as Hispanic individuals, non‑English speakers, and those with limited education—experience poverty at disproportionate rates (meaning these groups make up larger shares of California’s population in poverty than they do of the general California population). As described in the following sections, many of these same groups are also overrepresented in CalWORKs (a group is overrepresented in CalWORKs when its share of the CalWORKs caseload is larger than its share of the general population).
As mentioned, CalWORKs is designed to assist families in poverty. Therefore, the fact that many CalWORKs families have characteristics more similar to those of Californians in poverty than to those of the general population is not surprising. However, as described in the following sections, some groups make up larger proportions of the CalWORKs caseload than of Californians in poverty (meaning the group’s CalWORKs participation rate is higher than the group’s share of Californians in poverty). In this report, we describe these groups as disproportionately overrepresented in CalWORKs. Other groups are disproportionately underrepresented in CalWORKs, meaning the group’s CalWORKs participation rate is lower than the group’s share of Californians in poverty. Understanding common characteristics of CalWORKs participants and which California communities and families are disproportionately overrepresented or underrepresented in CalWORKs—and the possible reasons why—can help the Legislature understand who CalWORKs serves and determine how the program could be designed to better reach all eligible families.
The nearby box provides additional context around the data used for this report, including information on some potential data limitations.
General Notes on Data Used for This Report and Potential Data Limitations
Disaggregation of Data by Race/Ethnicity and Primary Language. Throughout the following sections, where disaggregated data are available, we use the racial and ethnic groupings currently employed by the U.S. Census and in state data sources, namely: American Indian or Alaska Native, Asian or Pacific Islander, Black, Hispanic, white, and other race or multiracial. We note that some groups may prefer different terminology to refer to racial and ethnic groupings. However, this report uses these categorizations because they reflect available state and national data.
We also use the following primary language groupings: English; Spanish; Chinese, Mandarin, or Cantonese; Vietnamese; Filipino or Tagalog; Korean; and other languages. According to the California Health and Human Services Agency, these non‑English languages are the top five languages spoken by Californians with limited English proficiency. The California Department of Social Services (CDSS) is required to provide translations of all program materials—including California Work Opportunity and Responsibility to Kids (CalWORKs) program materials—in these languages.
Data on Demographic Characteristics of CalWORKs Participants Drawn From Application Inputs. Data and findings in the following sections are based on characteristics of CalWORKs heads of household. Generally, the family member who completes the CalWORKs application or is responsible for the care of the assisted children is considered the head of household for data collection purposes. Counties report the demographic characteristics of applicants to the state based on demographic questions asked during the the application process, including on applications and during participant intake interviews. Participant response rates generally vary by question, with certain demographic questions, such as the question on gender identity, having far lower response rates than other questions (such as questions on race/ethnicity or primary language). At this time, the drivers of differing response rates by question are unclear. Information on CalWORKs participants and all Californians (including those in poverty) are based on most recently available data from CDSS for CalWORKs participants (2022) and the American Community Survey for the broader California population (2023).
Data Limited on Other Family Members. As mentioned, demographic data are generally collected on the CalWORKs applicant. However, an applicant is generally not asked to provide demographic information on other members of his or her family, even if the characteristics of other family members differ from those of the applicant. Therefore, it is difficult to draw definitive conclusions about the demographic profile of all CalWORKs participants. Throughout the following sections, we have noted where our findings may be most affected by this limitation.
Race/Ethnicity
Most CalWORKs Heads of Household Were Hispanic, White, or Black. As shown in Figure 12, about half of CalWORKs heads of household were Hispanic in 2022. About 22 percent were white and 20 percent were Black. (As noted in the nearby box, race/ethnicity data are only collected and reported for CalWORKs heads of household and, as a result, data are not available on the racial breakdown of all CalWORKs participants.)
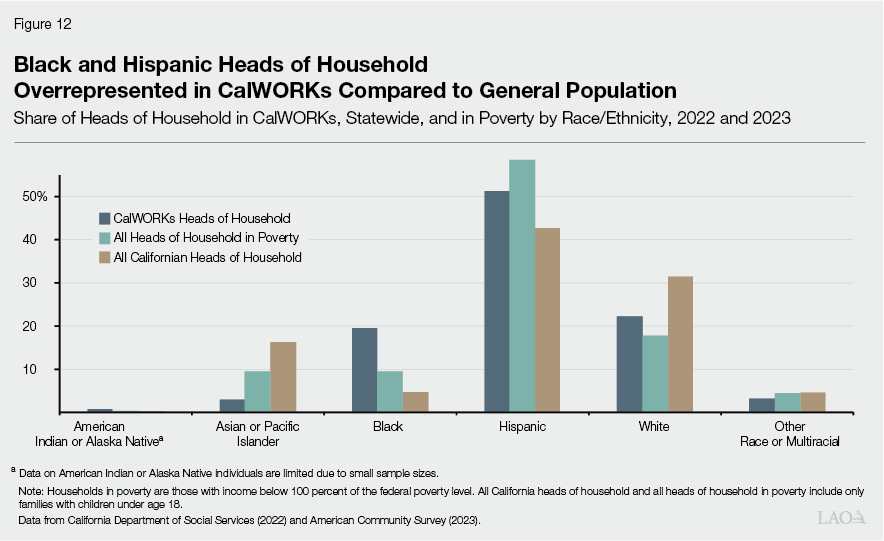
Certain Race/Ethnicity Groups Were Overrepresented in CalWORKs Compared to General Population. About 51 percent of CalWORKs heads of household were Hispanic in 2022, while about 43 percent of heads of household across California (including those not in CalWORKs) were Hispanic in 2023. About 20 percent of CalWORKs heads of household were Black, compared to about 5 percent of all heads of household.
Some Groups Made up Disproportionate Shares of CalWORKs Participants Compared to Californians in Poverty. As shown in Figure 12, certain race/ethnicity groups made up much larger or smaller shares of CalWORKs heads of household than of heads of household in poverty. Specifically, while about 20 percent of CalWORKs heads of household were Black, about 9 percent of heads of household in poverty were Black. Similarly, about 22 percent of CalWORKs heads of household were white, while 18 percent of heads of household in poverty were white. In contrast, Asian/Pacific Islander individuals made up only about 3 percent of CalWORKs heads of household, but about 10 percent of heads of household in poverty were Asian/Pacific Islander.
Key Participant Race/Ethnicity Findings
Overrepresentation of Certain Race/Ethnicity Groups in CalWORKs Compared to General Population Largely Reflects Disproportionate Rates of Poverty. As mentioned, certain race/ethnicity groups—in particular, Hispanic and Black Californians—experience poverty at disproportionate rates. Therefore, it is not surprising that these groups made up larger shares of the CalWORKs caseload than of the general population.
However, Drivers of Other Variation Across Groups Less Clear. As described earlier, certain race/ethnicity groups—in particular, Black and white individuals—made up larger shares of CalWORKs heads of household than these groups’ shares of heads of household in poverty. Other groups—in particular, Asian or Pacific Islander individuals and, to a smaller extent, Hispanic individuals—made up smaller shares of the CalWORKs caseload than of the population in poverty. These disproportionalities in CalWORKs across race/ethnicity groups (as compared to the broader population of Californians in poverty) mean there may be characteristics of certain race/ethnicity groups that result in higher (or lower) CalWORKs participation. We pose some questions on why this may be the case in the “Issues for Legislative Consideration” section.
Primary Language
English Was Primary Language in Most CalWORKs Households. As shown in Figure 13, in 2022, three‑quarters of CalWORKs heads of households spoke English as their primary language. The second most common primary language was Spanish (which was spoken by about 21 percent of CalWORKs heads of household). About 4 percent of CalWORKs heads of household primarily spoke another language (with “Other Non‑English” selected most frequently).
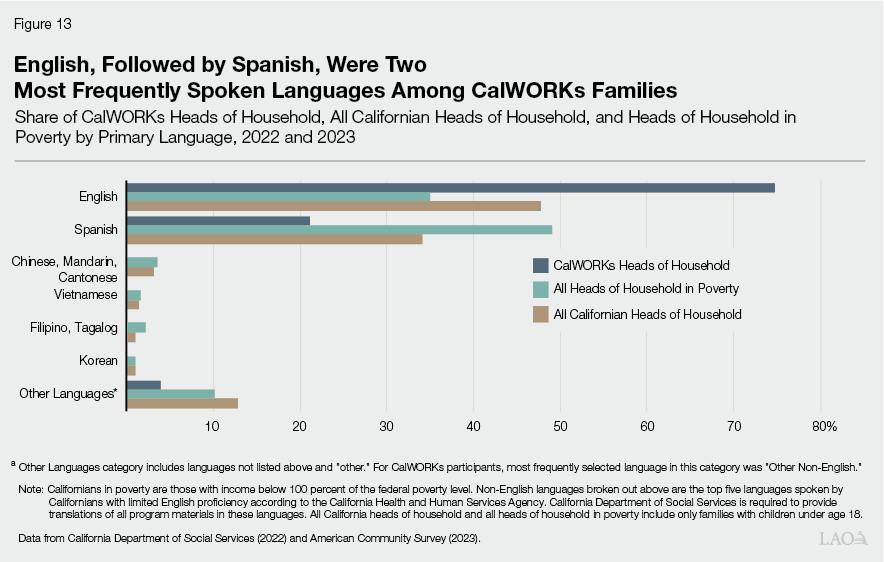
Disproportionate Share of CalWORKs Participants Were English Speakers. While about three‑quarters of CalWORKs heads of household spoke English as their primary language, about half of all Californian heads of household and less than half of heads of household in poverty spoke English as their primary language in 2023. Spanish and other non‑English languages were spoken more frequently by all Californians and those in poverty than by CalWORKs heads of household.
Key Primary Language Findings
Citizenship and Residency Eligibility Requirements Likely Partially Contributed to Underrepresentation of Non‑English Speakers in CalWORKs. As mentioned, undocumented immigrants and most immigrants with legal status who have lived in the United States for fewer than five years are ineligible for CalWORKs. While there are data limitations, according to 2023 Census data, over 20 percent of Californians who speak a primary language other than English are noncitizens. Some of these individuals may be ineligible for CalWORKs based on citizenship status.
Limited Insight Into Other Languages Spoken by CalWORKs Families. As mentioned, Figure 13 shows the primary languages of CalWORKs heads of household. Data are not available on other languages spoken in CalWORKs households (as secondary languages or as primary languages of other family members). While counties are required to provide CalWORKs applications and participation materials in various languages other than English and Spanish (including some options for interpreters), how aware potential applicants and participants may be of these options or how easily available translation services may be is unknown.
Gender of Head of Household
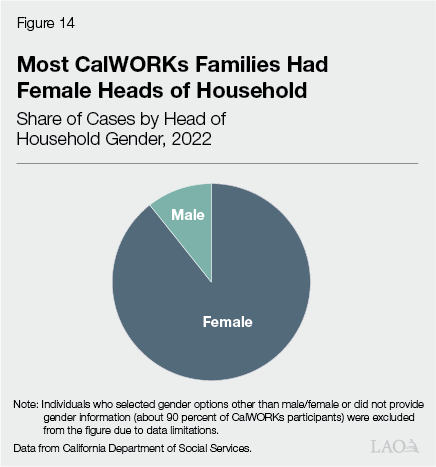
Disproportionate Share of CalWORKs Families Had Female Heads of Household. As shown in Figure 14, almost 90 percent of CalWORKs heads of household were women in 2022. Among cases with two eligible parents, a smaller proportion of heads of household were women (73 percent), as compared to all cases. By comparison, about half of California families with children and about 63 percent of families in poverty (with children) were headed by women in 2023, making female heads of household disproportionately represented in CalWORKs.
Key Gender Findings
Limited Gender Reporting. As mentioned, most demographic questions in the CalWORKs application—including on the applicant’s gender—are optional. The rate at which applicants selected “prefer not to say” in response to the application’s gender question was particularly high (as compared to responses on other demographic questions). Therefore, gender identity is only known for about 10 percent of CalWORKs heads of household. However, since women made up an overwhelming share of individuals who did supply their gender identity in their CalWORKs application (based on 2022 data), this pattern may extend to the full CalWORKs population, but the extent to which is unknown.
High Rate of Single‑Parent Families in CalWORKs May Contribute to Disproportionate Share of CalWORKs Families With Female Heads of Household. As previously mentioned, data availability limits the conclusions that can be drawn about CalWORKs family makeup, including the prevalence of single‑parent families in CalWORKs. However, of CalWORKs cases with eligible adults, about three‑quarters include only one eligible adult. (This is likely due in part to increased eligibility and participation requirements for two‑parent cases as compared to one‑parent cases. We will explore these requirements and potential impacts further in part two of this series). Many one‑parent CalWORKs cases are likely single‑parent families (however, this is not true for all one‑parent cases, as some families participating in CalWORKs include adults who are ineligible for reasons such as immigration status or time limits). Of all single‑parent families with children in California in 2023, almost 80 percent had female heads of household. As such, the overrepresentation of female heads of household in CalWORKs may be partially explained by the likely high rate of single‑parent families in the program and differing program requirements for one‑parent cases as compared to two‑parent cases. We pose some questions on this possibility in the “Issues for Legislative Consideration” section.
Adult Participants’ Education Level
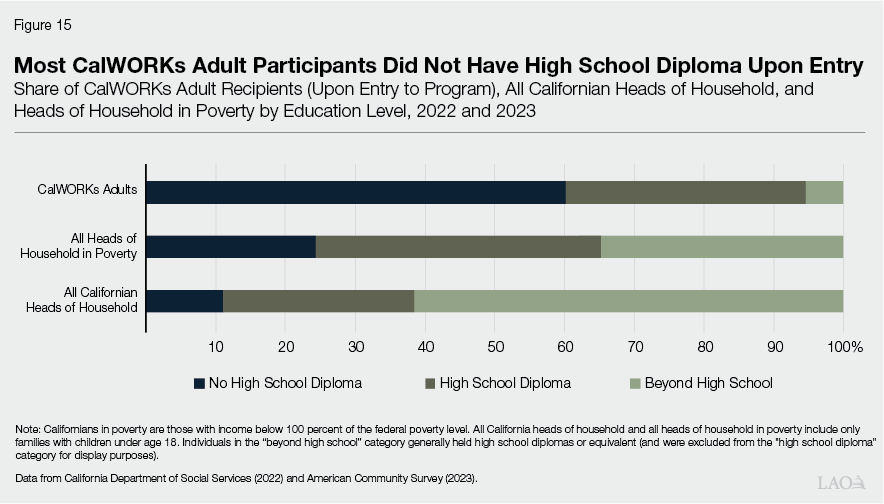
Disproportionate Share of Adult CalWORKs Participants Had Not Completed High School Upon Entry Into Program. As shown in Figure 15, in 2022, about 60 percent of adults entering CalWORKs had not completed high school. By comparison, in 2023, about 10 percent of all heads of household in California and 25 percent of heads of household in poverty did not hold high school diplomas, meaning those without high school diplomas made up a disproportionate share of those entering CalWORKs.
Key Education Findings
Disproportionate Share of Adults Without High School Diplomas Entering CalWORKs Likely Partially Reflects Disproportionate Rates of Poverty. As shown in Figure 15, heads of household in poverty are less likely than the general population to have completed high school. Therefore, it is not surprising that those entering CalWORKs are also less likely than the general population to have completed high school.
However, Other Drivers of Lower Educational Attainment Among Adults Entering CalWORKs Are Unclear. As described earlier, a disproportionate share of adults entering CalWORKs had not completed high school (as compared to adults in poverty). This disproportionality suggests there may be characteristics of adults without high school diplomas that result in higher CalWORKs participation. Alternatively, there may be components of the CalWORKs program that are particularly beneficial to low‑income adults who have not completed high school. We pose some questions on these possibilities in the “Issues for Legislative Consideration” section.
Issues for Legislative Consideration
In this section, we highlight data limitations that impact insights into CalWORKs participant characteristics and pose some questions on why certain groups might participate in CalWORKs at higher (or lower) rates. In part two of this series, Trends in CalWORKs: Participant Experiences, we will provide additional insight into some of these questions and further explore other factors potentially impacting CalWORKs participation and caseload in recent years, such as program awareness, benefits, and requirements.
Data Limitations Impact Insights Into CalWORKs Participant Characteristics. As previously mentioned, data limitations make drawing some conclusions about the characteristics of CalWORKs families and individuals difficult. For example, most demographic information is self‑reported and, in certain categories, available datasets include high rates of nonresponses or missing data (such as in the gender category). Additionally, as mentioned, data on ineligible family members and non‑heads of household are limited. For fuller insights into the characteristics of participants and families, the Legislature might consider the costs and potential benefits of requesting more detailed demographic information on CalWORKs participants and families—including non‑eligible family members and non‑heads of household—at the time of application. However, doing so may have trade‑offs, such as increased administrative burden on applicants and county staff. Additionally, some families may be dissuaded from applying for CalWORKs by additional requests or requirements for more detailed demographic information (for example, families with mixed immigration status), although the extent to which this might occur is unknown.
Certain Demographic Differences Between CalWORKs Participants and the General Population Likely Largely Due to Disproportionate Rates of Poverty Across Groups. As mentioned, CalWORKs is designed to assist low‑income families. Therefore, it is not surprising that many common characteristics among Californians in poverty are also common among CalWORKs participants. For example, as described throughout this report, CalWORKs participants and Californians in poverty are more likely than the general population to be female, Black or Hispanic, and without a high school diploma.
However, Certain Groups Make Up Disproportionate Shares of CalWORKs Participants as Compared to Californians in Poverty. As described throughout this report, certain groups (for example, female heads of household and adults without high school diplomas) make up disproportionate shares of CalWORKs participants as compared to Californians in poverty. Various factors—including characteristics of certain demographic groups or elements of the CalWORKs program, including eligibility rules, languages used in program materials, participation requirements, outreach strategies, or service offerings—may play a role in making certain groups more (or less) likely to apply for or participate in CalWORKs. We explore some of these potential factors further below, as well as in part two of this series.
Disproportionalities Raise Key Questions. The Legislature might consider various questions on disproportionalities highlighted in this report, including those outlined below. Part two of the series, Trends in CalWORKs: Participant Experiences, will provide further insight into some of these questions.
- Geography. Certain counties make up disproportionate shares of the CalWORKs caseload when compared to Californians in poverty. Are there certain local programmatic differences—such as variation in outreach or services offered—that help explain some of these disproportionalities? Are there certain differences in county characteristics—such as population density or presence of community‑based organizations—that may factor into these disproportionalities? Are additional county‑level data points needed to assess these programmatic or county‑level differences?
- CalWORKs Family Composition. Children make up the vast majority of CalWORKs participants, largely as a result of the program’s eligibility and participation requirements (most of which, as described earlier, are determined at the state and federal level). Do requirements determined at the state level, such as how the state defines a family’s need for assistance or WTW participation requirements, still align with the Legislature’s goals for the program?
- Race/Ethnicity and Language. Certain race/ethnicity groups make up disproportionate shares of the CalWORKs caseload as compared to Californians in poverty, while other groups are underrepresented. Additionally, few participants speak primary languages other than English or Spanish (indicating a potential connection between language, race/ethnicity, and CalWORKs participation). How might awareness or perception of the program differ by race/ethnicity group or across Californians speaking different languages? What barriers might families speaking other languages face in applying for and participating in CalWORKs?
- Gender. Families with female heads of household make up a disproportionate share of the CalWORKs caseload when compared to California families in poverty. Are there barriers low‑income families without female heads of household, including both single‑parent and two‑parent families, face in accessing CalWORKs? What program elements might be particularly beneficial to families with female heads of household?
- Education. CalWORKs adult participants are far less likely to have completed high school (or equivalent) than all adult Californians in poverty. Are there elements of the CalWORKs program that are particularly beneficial to Californians who have not completed high school, such as assistance in earning high school diplomas (or equivalent)? Are services offered through CalWORKs effectively meeting the needs of these participants? Are there other program elements or participant characteristics that make CalWORKs participants less likely than other Californians—including those in poverty—to hold high school diplomas?
Conclusion
Better understanding the common characteristics of CalWORKs participants, which California communities and families are disproportionately overrepresented or underrepresented in CalWORKs, and the possible reasons for these disproportionalities can help the Legislature better understand who CalWORKs serves and determine how the program could be designed to better reach all eligible families. The Legislature could consider using some of the questions described in this report as a guide in increasing the information the state requests or requires from CalWORKs participants. However, as described earlier, efforts to gather more information about CalWORKs participants than is already required would likely have tradeoffs, such as increased administrative burden on county staff and participants. Therefore, if the Legislature is interested in increasing the information the state requests or requires of participants, it should likely weigh these tradeoffs and potential effects. Additionally, other factors outside of participant characteristics—such as program awareness, benefits, and requirements—likely impact CalWORKs caseload and participation across groups. In part two of this series, Trends in CalWORKs: Participant Experiences, we will further explore some of these other factors.