
California housing permit activity continued at a moderate pace in November. 8,539 permits were issued statewide, down 11 percent from October but up 16 percent from November 2018, which was an unusually weak month. The November total was below the 2019 average of about 9,000 units per month, but November is typically one of the slower months for permit activity. In total, 99,298 permits were issued in the first eleven months of 2019, down 6 percent from 2018.
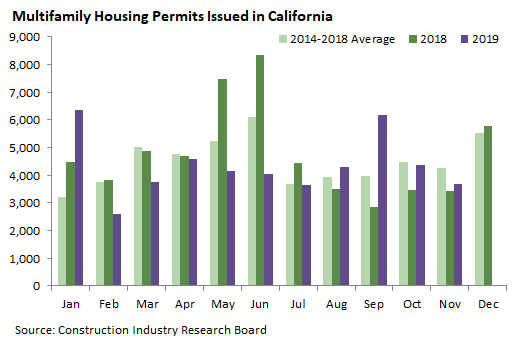
The multifamily housing permit total of 3,672 was the lowest since July, although it exceeded November 2018 and was not far below the 2014-18 average. Overall, multifamily permits over the first eleven months of 2019 were down 7 percent from 2018, and accounted for slightly less than half (47,642) of the state total.
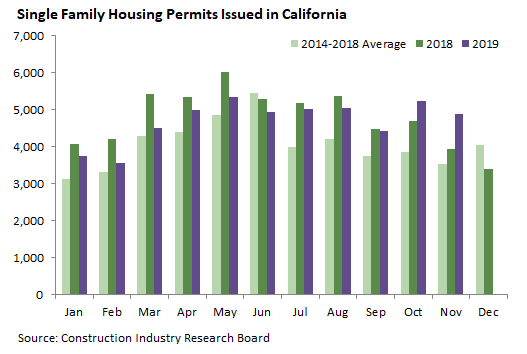
November’s single family housing permit total of 4,867 was slightly below the average from April to October, but well above both the November 2018 figure and the November average from 2014 to 2018. In 2018, single family permits got off to a strong start but faded at the end of the year. 2019 has seen the opposite pattern, as the late 2018 slump continued through early 2019 but conditions improved later in the year. Through the first eleven months of 2019 the state recorded 51,656 single family permits, down 4 percent from 2018.
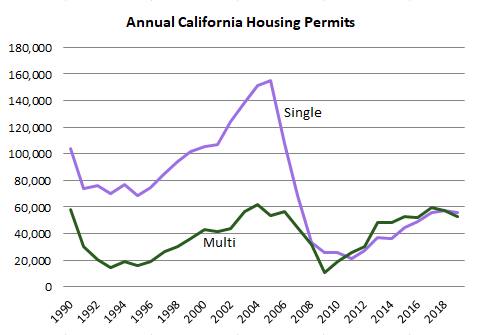
This chart shows three decades of permit activity in California going back to 1990, assuming that December 2019 comes in right at the 2014-18 average for the month. Both single- and multi-family permits picked up in the second half of the 2010s. For multi-family permits, this represented a return to the modern peak, but single-family activity has remained well below the levels that prevailed in even the slowest years before the financial crisis roiled the housing sector.
Data source: CIRB (Construction Industry Research Board), a service provided by the California Homebuilding Foundation http://www.mychf.org/cirb.html.