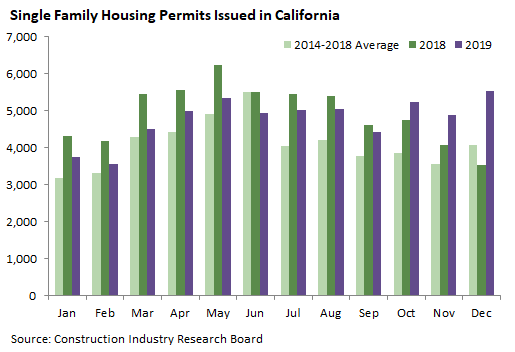
California housing permit activity picked up in December, as the statewide total of 11,497 permits was the highest since June 2018, up 35 percent from November and 14 percent from December 2018. Pending revision, 110,795 permits were issued in 2019, down 6 percent from 2018. The revised 2018 total was 3,522 units (about 3 percent) above the preliminary total, so if the same pattern holds for 2019 we should expect the revised total to be higher but still below the 2018 total.
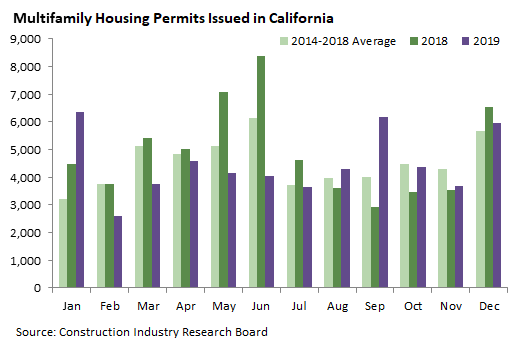
The multifamily housing permit total of 5,971 was well above any other month in 2019 save January and September. December is typically a big month, and this month’s count (pending revision) was actually the lowest total for December since 2016. Overall, multifamily permits in 2019 are down 9 percent from 2018, and accounted for slightly less than half (53,613) of the preliminary state total.
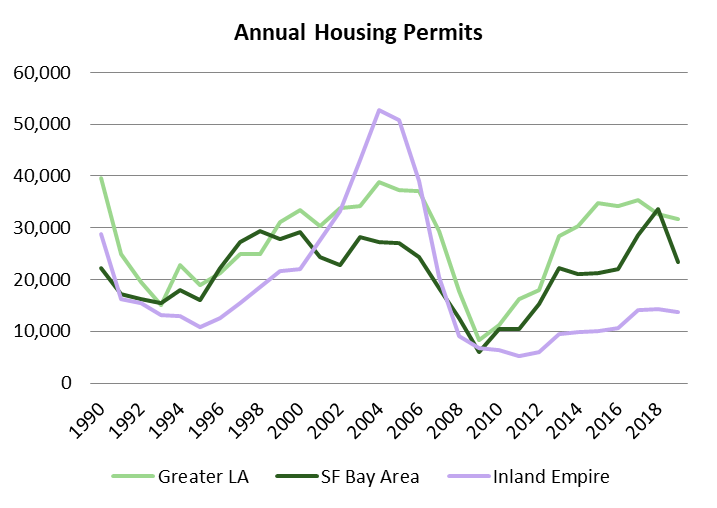
The “Greater Los Angeles” area consists of Los Angeles, Orange, and Ventura counties, which together have about 36 percent of the state’s population. Permit activity in this area ramped up from the early 1990s to the mid-2000s, crashed after the housing bubble burst, and has since returned to levels somewhat below the mid-00s peak.
The “San Francisco Bay Area” consists of San Francisco, San Mateo, Santa Clara, San Benito, Alameda, Contra Costa, Solano, Napa, Sonoma, and Marin counties, which have about 20 percent of the state population. It has shown largely the same pattern as greater LA, although it permitted more units during the tech boom of the late 1990s than in the housing bubble of the 00s. Unlike the other two areas, its peak years since 1990 were 2017 and 2018, again spurred by growth in high-tech jobs.
The “Inland Empire” consists of Riverside and San Bernardino counties, with about 12 percent of the population. Permitting in this area dropped by about 90 percent from the peak levels at the height of the housing bubble, and has since recovered quite a bit but remains at low levels by historical standards.