California recorded 7,619 housing permits in March, down 8 percent from March 2019. It is not clear how much March activity was affected by the pandemic: many counties reported average or higher numbers of permits, but the statewide count was well below the recent average for March after being well above average in January and February. In any case, April is likely to show a bigger impact.
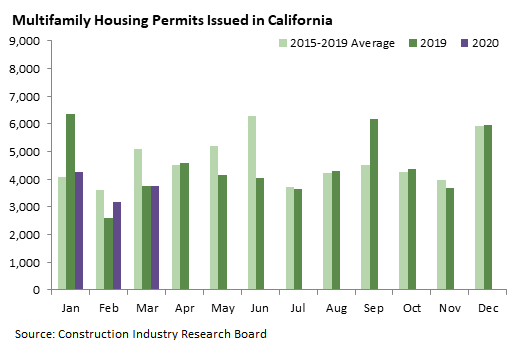
The multifamily housing permit total of 3,767 was roughly equal to the March 2019 total, although well below the March average over the past five years.
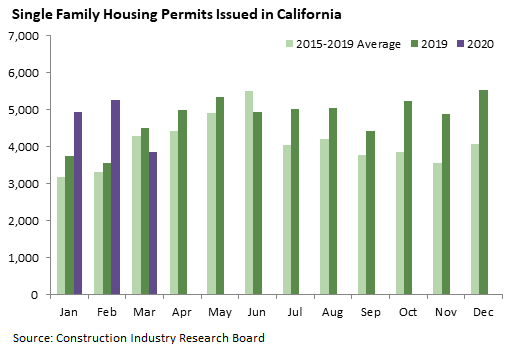
The single family permit total of 3,852 was only modestly below both the March 2019 figure and the 2015-2019 average for March, but it marked a sharp reversal from January and February when permits greatly exceeded the averages for those months.
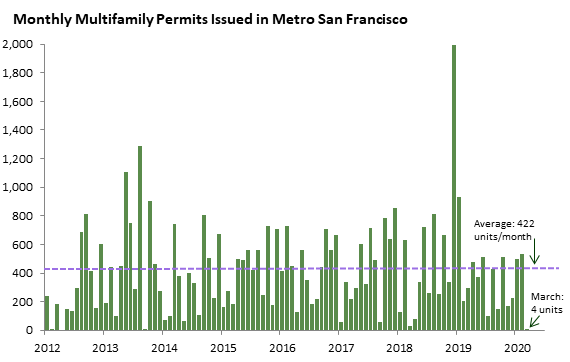
The San Francisco metropolitan area (San Francisco, San Mateo, and Marin counties) permitted just four multifamily units in March, its lowest monthly total since 2012. The graph below shows the area’s monthly multifamily totals since 2012 and illustrates the wide month-to-month variation in multifamily permits at the local level. A single multifamily project will often contain hundreds of units, and the big spikes mostly show months in which the biggest projects were approved. For example, all but eleven of the 1,993 units permitted in December 2018 were attributable to projects with five or more units in the city of San Francisco.