
As the COVID-19 crisis has unfolded, we have tracked the U.S. Census Bureau’s monthly releases of data on U.S. retail sales. This economic indicator can give us a general sense of the effects of the crisis on California’s sales and use tax revenues. It has a key limitation, however—it describes sales throughout the U.S., not just California. In this post, we use data on credit card and debit card transactions in California to get a better sense of recent sales tax trends in California.
Card Data: Early Spring Decline, Then Strong Growth. We have used card data from two sources—Opportunity Insights and Chase—to create spending indices designed to estimate California taxable sales. (We describe our methods and data sources in more detail below.) Overall, these estimates indicate that taxable spending in California dropped dramatically in March and April, followed by strong growth in May and June. The Opportunity Insights index further suggests that this strong growth has continued in July. The two indices disagree about the size of the spring drop in sales, with the Opportunity Insights index displaying a more severe drop and the Chase index displaying a milder one.
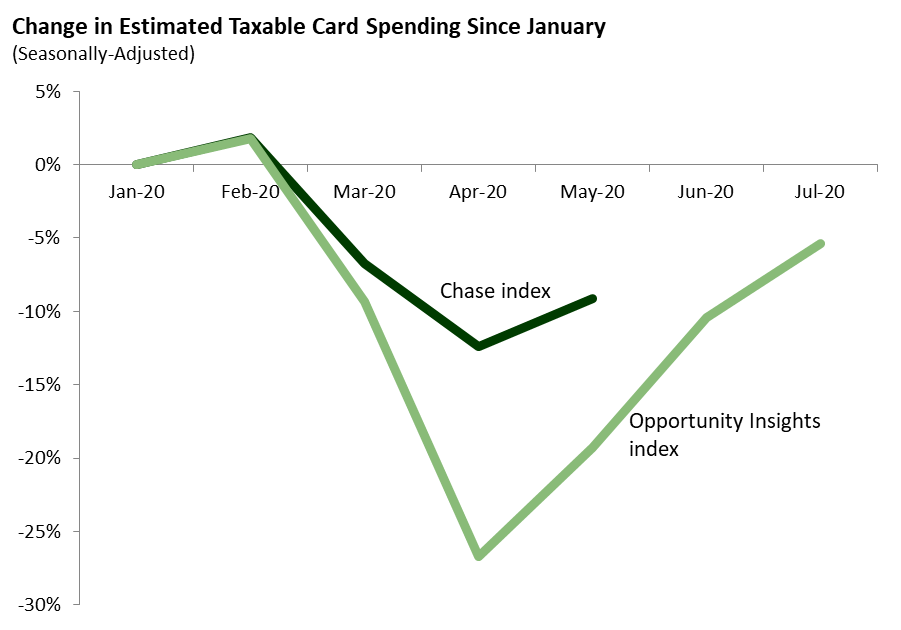
Key Limitation: Card Spending vs. Total Spending. During the COVID-19 crisis, consumers likely have relied more heavily on credit cards than they did in prior months. Consequently, the decline in overall (card and non-card combined) spending could be more severe than these indices suggest.
Data Sources. This post uses two sources of credit card and debit card data:
- Opportunity Insights. A team of academic researchers known as Opportunity Insights has posted high-frequency data on credit card and debit card spending provided by Affinity Solutions, Inc. Data users can examine spending by state, county, and metropolitan area.
- Chase. The JP Morgan Chase Institute has produced geographically detailed data on credit card spending in 16 U.S. metropolitan areas. Three of these metro areas are in California and are home to roughly half of the state’s population.
Indices Based on Relationship Between Card Spending and U.S. Retail Sales. To create our spending indices, we estimated statistical relationships between retail sales and several categories of card spending at the national level. For this exercise, we omitted retail sales by three types of businesses:
- Gas Stations and Grocery Stores. We removed gas stations and grocery stores because most sales made by these businesses are not subject to the General Fund portion of California’s sales tax.
- Vehicle Dealers. We removed motor vehicle and auto parts dealers because credit card and debit card data are not suitable for tracking vehicle purchases.