
Bottom Line: Economic recovery continued in August, but at a somewhat slower pace than recent months.
The COVID-19 pandemic has reshaped the California economy. Over the last several months, the state has experienced abrupt and dramatic swings in economic activity. While a variety of data is available to track developments in the state economy, drawing clear conclusions from these disparate data points can be difficult. To help make sense of this varied data, this post pulls together and synthesizes ten key data points on the state economy. Our goal is to provide a quick, simple snapshot of recent trends in this data. The graphic below provides this snapshot.
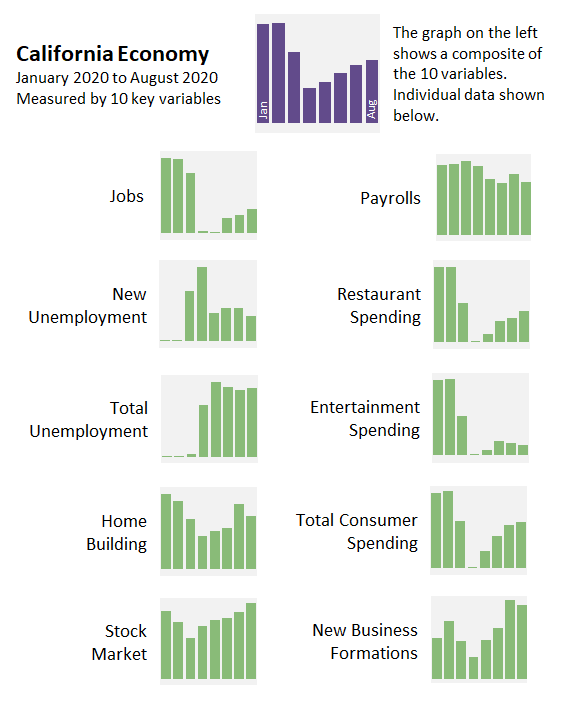
We display each variable as a standardized index that shows how the current level of each variable compares to historic norms. At the top of the graphic, we aggregate the ten variables into a single measure that attempts to capture what changes in the individual variables can tell us about the overall trend in the state’s economy. As this measure shows, California’s economy experienced a precipitous drop in March and April. Beginning in May, however, economic activity began to recover. This recovery has continued through August.
The pattern in the data is a bit more mixed in August than recent months. California continued to regain jobs, but the number of total unemployed workers held steady. Consumer spending continued to recover, but more slowly than in June and July. Overall, the pace of the recovery in the state’s economy appeared to slow a bit.