
Bottom Line: After October data suggested a somewhat surprising jump in economic activity, November data returned to the late summer pattern of a slow recovery.
The COVID-19 pandemic has reshaped the California economy. Over the last several months, the state has experienced abrupt and dramatic swings in economic activity. While a variety of data are available to track developments in the state economy, drawing clear conclusions from these disparate data points can be difficult. To help make sense of this varied data, this post pulls together and synthesizes ten key data points on the state economy. Our goal is to provide a quick, simple snapshot of recent trends in this data. The graphic below provides this snapshot.
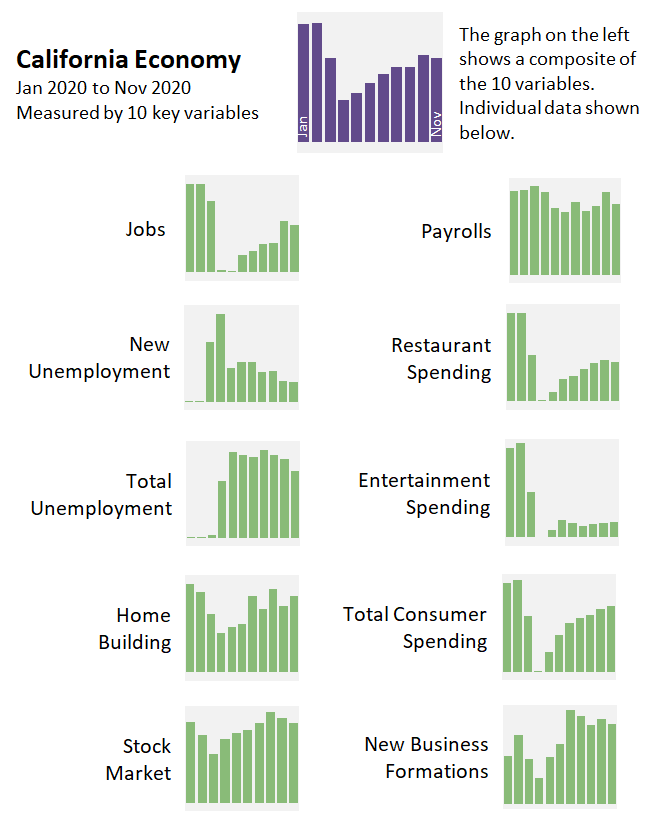
We display each variable as a standardized index that shows how the current level of each variable compares to historic norms. At the top of the graphic, we aggregate the ten variables into a single measure that attempts to capture what changes in the individual variables can tell us about the overall trend in the state’s economy. As this measure shows, California’s economy experienced a precipitous drop in the spring, followed by a rapid rebound. The pace of the recovery appeared to slow in August. October data suggested another major positive jump in the state’s economic situation but, as we discussed last month, this likely was due, in part, to noisy data. In November, the indicators returned to the late summer pattern, suggesting limited or no improvement in the state’s economic situation.