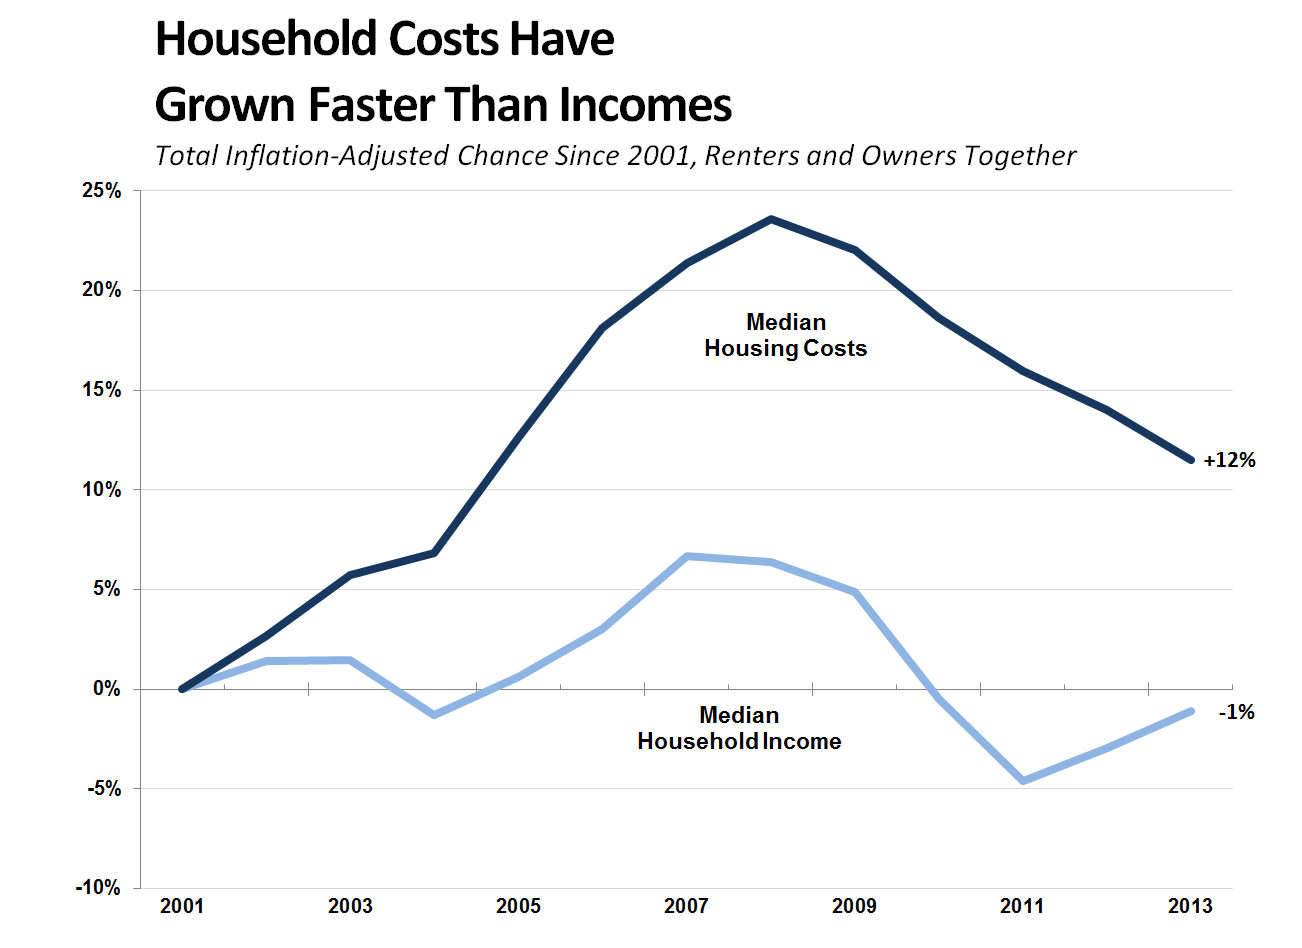
Housing Costs for Californians Have Grown Faster Than Incomes. As shown in the figure below, median housing costs have increased faster than median incomes over the past decade. For many households, this means that a growing share of income must now be devoted to housing. This overall trend, however, combines housing costs and incomes for renters and homeowners. Below we look at how trends for renters and owners have differed since 2001.
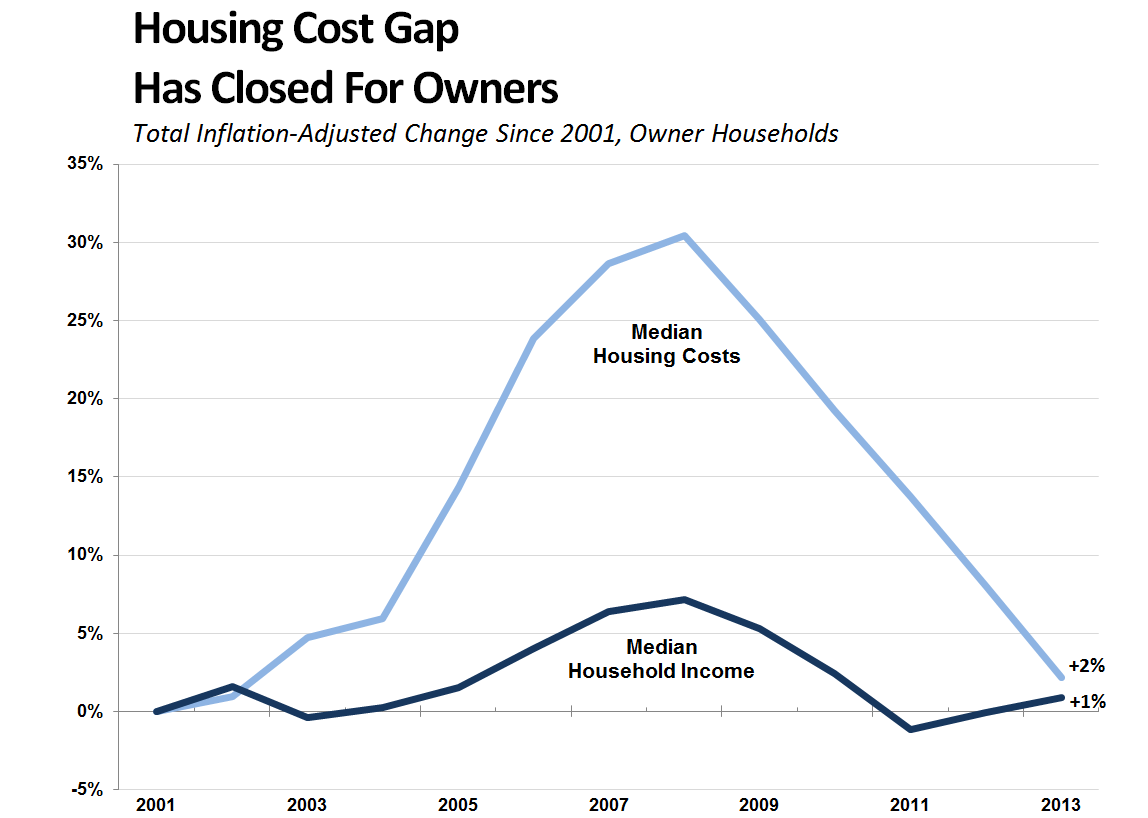
After Climbing During Housing Boom, Owner Housing Costs Have Come Down Notably. In 2001, the median California homeowner spent about $1,600 per month (adjusted for inflation) on their mortgage, property taxes, utilities, and insurance. During the housing boom, this amount climbed significantly, peaking at $2,100 in 2008. Between 2008 and 2013, however, home prices declined and many newer homeowners purchased at prices well below peak. As a result, monthly housing costs for California homeowners fell to $1,600 in 2013, the same inflation-adjusted level as 2001. (Despite this decline, monthly homeowner costs in California are still $600 higher than they are elsewhere.) Over the same period, median household income for owners has stayed relatively flat. As a result, the so-called "gap" between housing costs and incomes for homeowners has closed since its widest point in 2008.
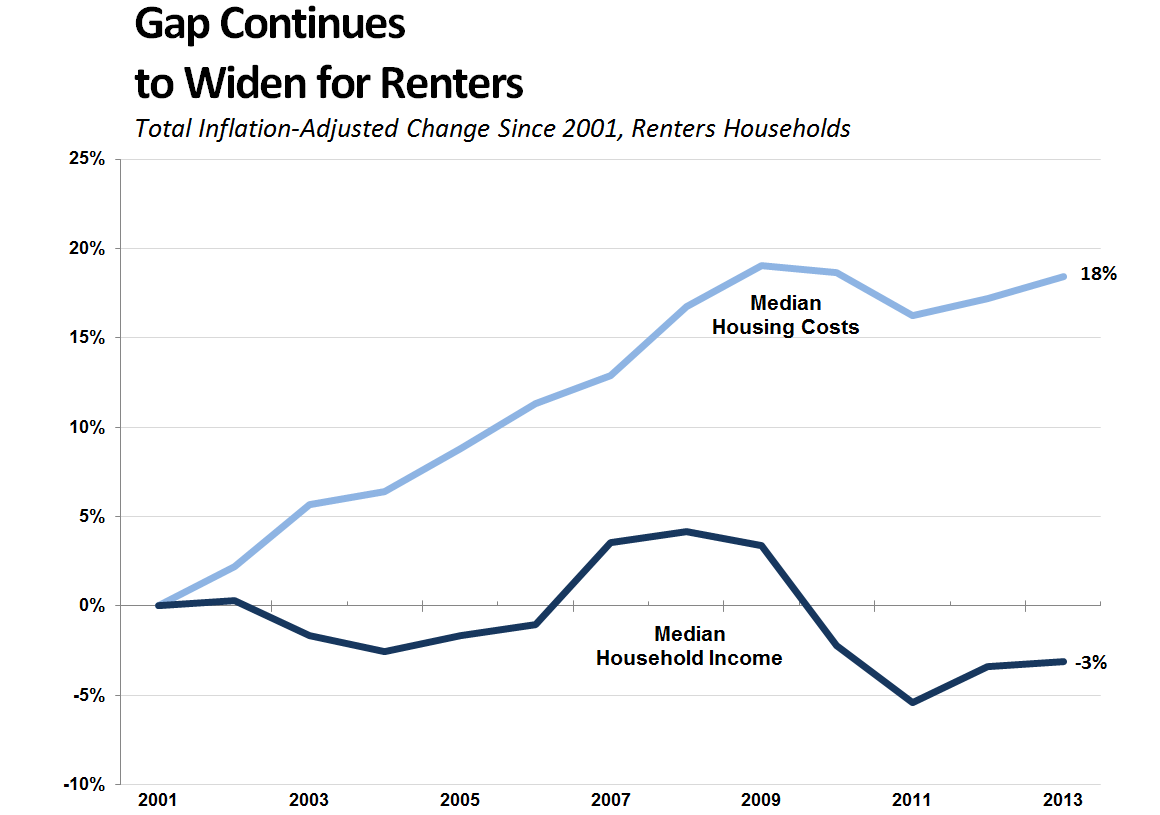
Renter Costs Increased Steadily, Even During Housing Downturn. Median renter housing costs were about $1,000 monthly in 2001, and have since risen about 20 percent to $1,200 monthly. Over the same period, inflation-adjusted median renter income fell slightly, from $41,300 annually to $40,000. Taking both these movements into account, the gap between renter costs and renter incomes--as shown in the figure below--widened considerably over the past decade, meaning most renters today must devote a larger share of their monthly income to rent.
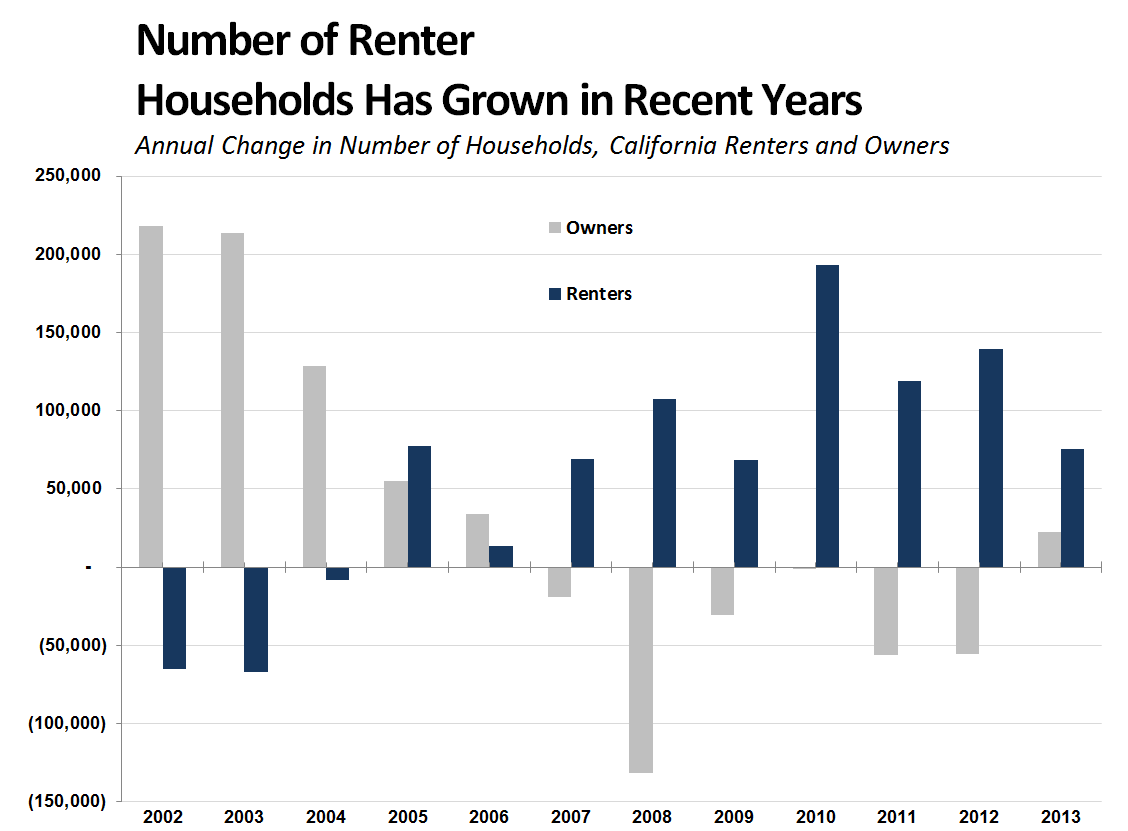
California’s Shifting Housing Landscape. The composition of California's housing stock between renter- and owner-occupied shifted dramatically during the recession. As shown in the figure below, the number of renter households statewide increased steadily, while the number of owner households declined. This occurred, in part, due to the high-levels of foreclosure, short-sales, and other financially motivated home sales that took place during the housing crisis, pushing many homeowners into the rental market.
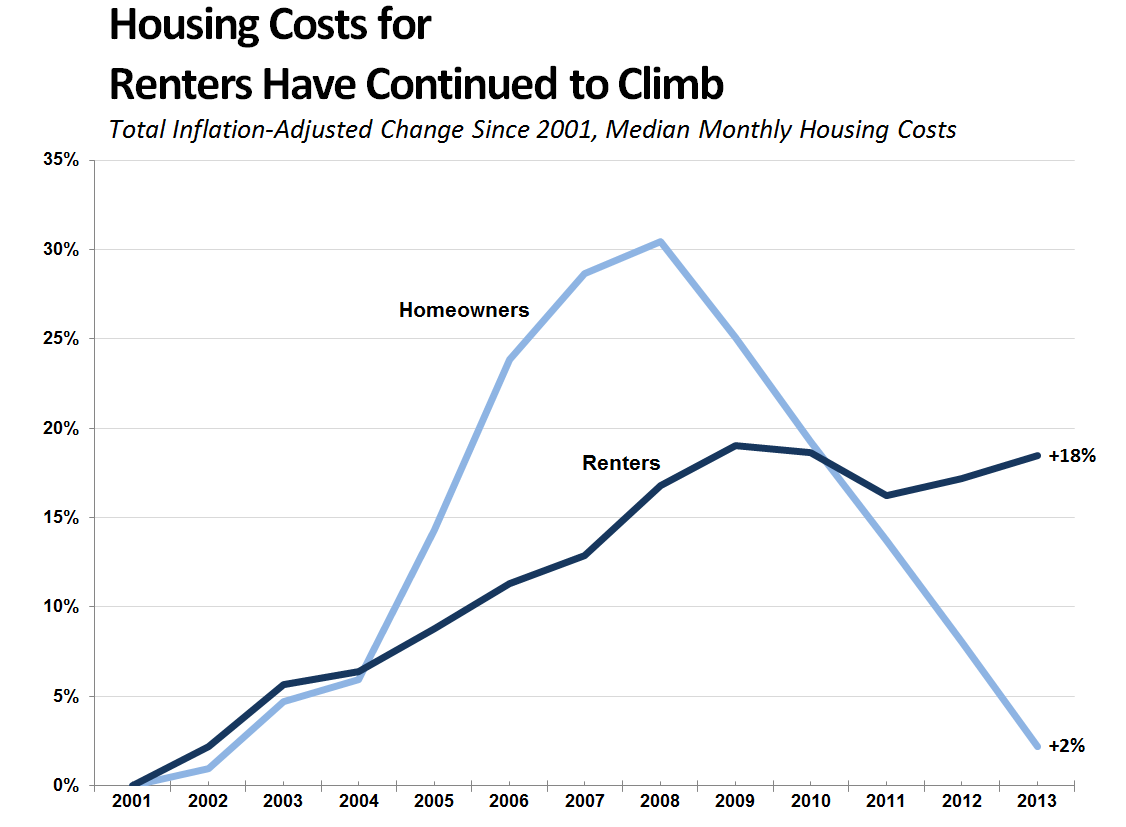
Why Have Renter Costs Grown While Owner Costs Have Fallen? As shown in the figure below, median inflation-adjusted renter costs increased 18 percent since 2001, while median inflation-adjusted homeowner costs increased just 2 percent (after peaking in 2008). Identifying exactly why these trends occured is complicated by several factors. For example, each year some renters choose to become owners (and vice versa). Households that move between the two categories influence (1) the demand for housing in each category (dictating prices and therefore housing costs), and (2) the median income levels for renters and owners.
Below, we highlight a few potential reasons why housing costs for renters have continued their upward trajectory, despite the decline in inflation-adjusted costs for the state's homeowners.
- Mortgage Credit Constraints and Uncertain Job Prospects Likely Fueled Demand for Rental Housing. The typical credit score required to receive a residential mortgage increased significantly over the course of the housing crisis. For many, credit availability prevented them from entering the single-family home market, and therefore diverted their housing demand to the rental market. This additional demand in the rental housing market has led to increased rents as more and more potential renters compete with each other for a limited number of available units. Since 2001, inflation-adjusted median rents for apartment complex units have increased about 14 percent. Over the long term, however, this should spur new apartment construction as builders respond to rising prices. This appears to have begun already, at least to some extent, as rental housing construction has rebounded much more quickly than single-family construction. It remains to be seen if additional new apartment construction will meaningfully slow rising rental costs, especially in the state's most expensive rental markets.
- Many Single-Family Homes Converted from Owner-Occupied to Rentals. Nationwide, several million single-family homes converted to rental homes over the course of the recession. Many homes that went through foreclosure or short-sale were ultimately purchased and converted to rental units. Typically, single-family home rents are higher than rents for units in apartment complexes. (In 2013, rented single-family homes averaged $1,400 monthly, whereas other rentals averaged $1,130.) As a result, a portion of the increase in median rental costs likely is the result of this changing mix of the rental stock. In California, the share of single-family homes occupied by owners peaked in 2005 at 79 percent (meaning 21 percent of single-family homes were being rented). As more and more single-family homes were converted to rentals, this ratio dropped 5 percentage points to 74 percent in 2013. Conversely, over the same period, single-family homes' share of the rental market increased from 33 percent of the over-all rental market to 37 percent.
Source Information. This entry is based on data from the 1-year American Community Survey (ACS) for 2001 through 2013. The ACS collects responses every year, instead of every 10 years. This entry uses the ACS public use microdata sample. This file includes anonymous individual responses to the survey that allow statistical users to perform custom analysis.

