
Bottom Line: December data was emblematic of the state’s uneven economic recovery from the pandemic. Measures tied to the prospects of higher-income Californians reached record highs, yet unemployment remains widespread and many households continue to cut back spending.
The COVID-19 pandemic has reshaped the California economy. Over the last several months, the state has experienced abrupt and dramatic swings in economic activity. While a variety of data is available to track developments in the state economy, drawing clear conclusions from these disparate data points can be difficult. To help make sense of this varied data, this post pulls together and synthesizes ten key data points on the state economy. Our goal is to provide a quick, simple snapshot of recent trends in this data. The graphic below provides this snapshot.
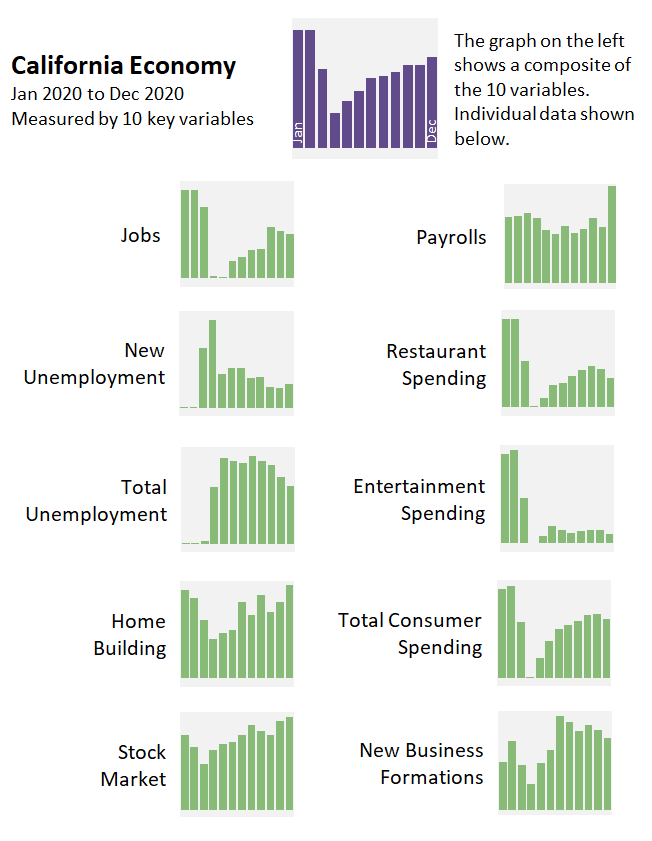
We display each variable as a standardized index that shows how the current level of each variable compares to historic norms. At the top of the graphic, we aggregate the ten variables into a single measure that attempts to capture what changes in the individual variables can tell us about the overall trend in the state’s economy.
The December data tell a very mixed story about the state’s economy. One the one hand, payrolls (as measured by state income tax withholding, which is disproportionately tied to earnings of higher-income individuals) and stock prices reached new highs in December. On the other hand, total employment in the state dropped slightly in December, unemployment remained widespread, and spending on restaurants and entertainment remains severely depressed.