The extent of new business creation in California can be a useful gauge of the health of the state’s economy. Past research suggests that new businesses account for a sizable share of job creation and also are more sensitive to swings in economic conditions than older businesses. Our own analysis of business formation data in California suggests that it typically has been a leading indicator of changes in unemployment.
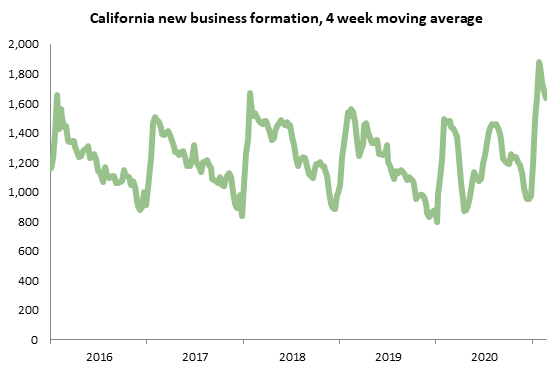
This graph shows U.S. Census data for the four-week average of new business creation since 2016, considering only those businesses that report having planned wages as opposed to shell corporations or holding companies. The standard pattern within a year is for a surge of new business formation at the beginning, then gradual declines as the year goes on. This pattern was upended in 2020: the pandemic caused a big drop in the spring, followed by a surge as the economy began to recover. Overall, new business creation in 2020 was a bit above 2016, 2017, and 2019 and somewhat below 2018. So far 2021 has seen a bigger than usual January spike, and the February level was also well above the recent average.
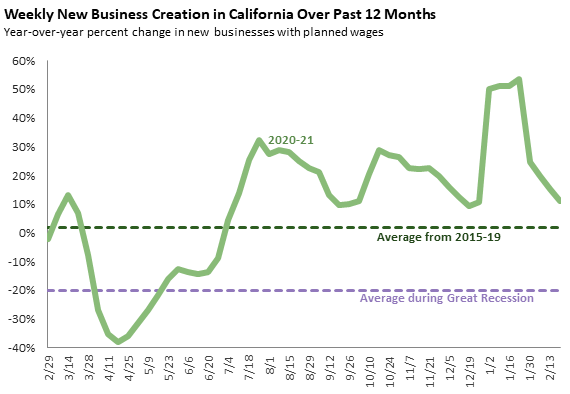
The next graph below shows the four-week average growth rate in 2020-21 relative to the same week in 2019-20. Growth in new business creation has been heightened since last July. While the massive surge in new business creation we saw in January has not been sustained, activity in February continued to outpace 2020.