
Bottom line: New IRS data show that California experienced more net outmigration of tax filers to other states from 2017-2019 than from 2012-2016, and this outmigration is increasingly concentrated among older, more affluent people.
Our office previously commented on how federal Internal Revenue Service (IRS) data show a persistent, long-term net outmigration of tax filers from California to other states. The IRS recently released data for tax year 2019 showing interstate migration among filers at different age groups and income levels. This post summarizes the new IRS data.
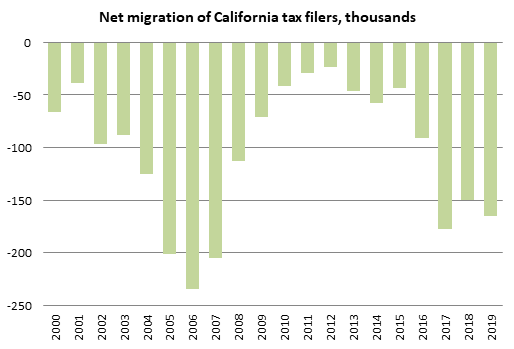
The figure below shows total net migration of filers (defined as the number of exemptions claimed on returns, including the filer plus spouse and/or dependents) between California and the rest of the nation since 2000, aggregated among all age groups and income levels. A return is counted as a 2012 (for example) California inflow if the filer’s mailing address was in another state in 2011 and in California in 2012, and as a California outflow if their address was in California in 2011 but in another state in 2012. Net outmigration surged in the mid-00s as housing became increasingly unaffordable, then plummeted after the housing bubble burst. It increased somewhat in 2016 and more sharply in 2017, and has since stayed elevated. For context, the state’s net outflow of 165,355 between 2018 and 2019 represented 0.52 percent of the state’s 2018 filer population of 31.7 million.
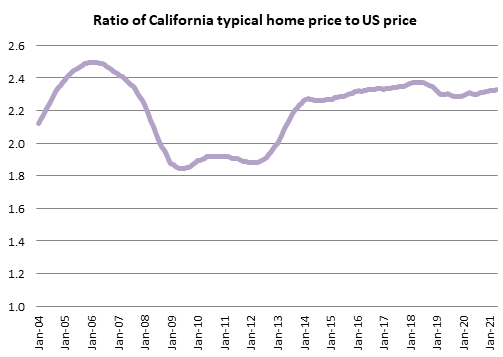
A key driver of migration between California and other states is living costs, particularly the cost of housing. The next figure shows the ratio of the typical home price in California to the typical home price in the United States since 2004. As the figure shows, the state’s relative housing costs rose in the middle of the last decade, which was soon followed by increasing outflows from California. Note that the ratio peaked in 2018 at a lower level than prevailed during the housing bubble of the mid-00s, the period when the state saw the largest net outflows.
The final figure below shows net migration for filers in different age/income groupings for each year from 2012 to 2019. The left column shows absolute numbers of migrants, with the darkest shade of red indicating a net outflow of more than 10,000 people. The right column shows migration as a share of the previous year’s filers, with the darkest shade of green indicating a net inflow of more than 1 percent of the previous year’s population, and the darkest shade of red indicating a net outflow of more than 0.75 percent.
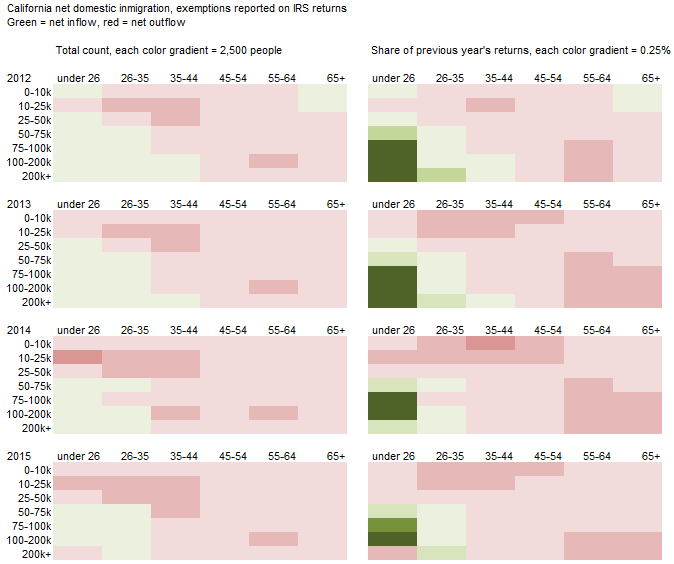
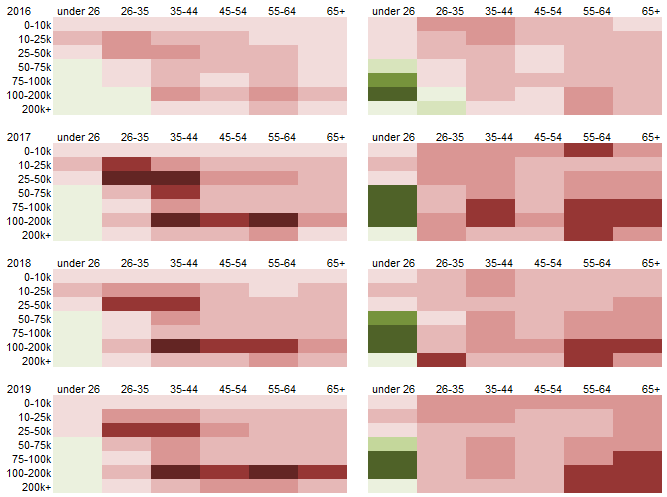
The chart shows that the increased net outflow from the state has been most pronounced among older and more affluent residents. In fact, the five groups with the biggest relative net outflow in 2019 were all over the age of 55 and had income of over $75,000. Outmigration among filers between ages 26 and 54 has also increased, with the 35-44 group generally having the biggest absolute net outflows as this group tends to have the most kids at home. In contrast, the state has seen a consistent net inflow among higher-income filers younger than 26, although the high relative net inflows among this group do not translate into a large absolute net inflow: as the left hand column suggests, these groupings are very small and in fact fewer than 1 percent of statewide exemptions in 2019 were claimed on returns of filers who were under age 26 and over $50,000 of income.
Compared to other datasets used to measure migration (such as the American Community Survey), the IRS data offer a more consistent and reliable measure of income, as well as lower statistical error. That said, a limitation of the IRS data is that they do not cover people who do not file federal income tax returns. Nonfilers—who typically have lower incomes—likely account for roughly 20 percent of the population, as the state population in 2018 was around 39.5 million and 31.7 million personal and dependent exemptions were claimed on income tax returns.