The extent of new business creation in California can be a useful gauge of the health of the state’s economy. Past research suggests that new businesses account for a sizable share of job creation and also are more sensitive to swings in economic conditions than older businesses. Our own analysis of business formation data in California suggests that it typically has been a leading indicator of changes in unemployment.
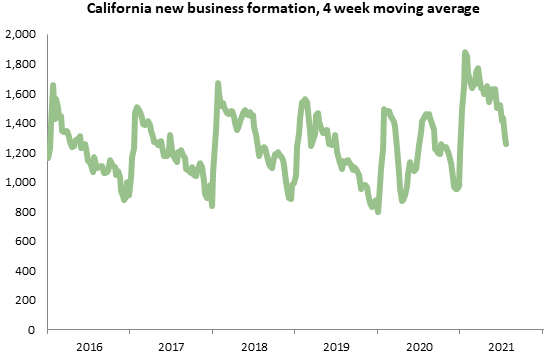
This graph shows U.S. Census data for the four-week average of new business creation since 2016, considering only those businesses that report having planned wages as opposed to shell corporations or holding companies. The standard pattern within a year is for a surge of new business formation at the beginning, then gradual declines as the year goes on. This pattern was upended in 2020: the pandemic caused a big drop in the spring, followed by a surge as the economy began to recover. So far 2021 has seen the normal pattern with a peak in January, although with significantly more firms than usual being created in each week of the year. July saw an unusually sharp drop relative to the first half of the year, but the level of new business creation remained above typical levels for the month.
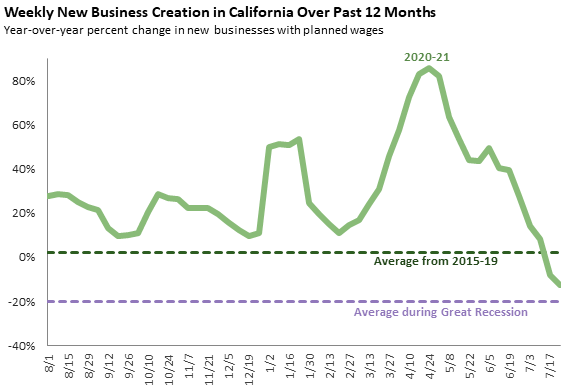
The next graph below shows the four-week average growth rate in 2020-21 relative to the same week in 2019-20. For the first time in more than a year, fewer new businesses have been created lately than in the same weeks of the previous year. July 2020 saw an unusually high level of business formation as the state emerged from its lockdown and people created new businesses to fill the void of firms that had been forced to close and to respond to changes in demand due to the shift to remote work and shopping.