The official unemployment rate has been improving in California and the rest of the nation. In addition to this commonly reported measure of unemployment, there are other measures of "labor underutilization" in the economy, such as the "U-6" measure.
The U-6 Measure. The U.S. Bureau of Labor Statistics (BLS) recently updated its "alternative measures of labor underutilization" for states to include the first quarter of 2015. One such alternative measure is the U-6 rate, which considers not only the unemployed population in the official "U-3" unemployment rate, but also marginally attached workers and those employed part-time for economic reasons. The U-6 rate is defined by BLS as the "total unemployed, plus all marginally attached workers, plus total employed part time for economic reasons, as a percent of the civilian labor force plus all marginally attached workers." This U-6 measure has been said to measure the "unemployed, underemployed, and those who are not looking but who want a job." (In a prior blog post, we provided additional background on U-6 and other unemployment measures.)
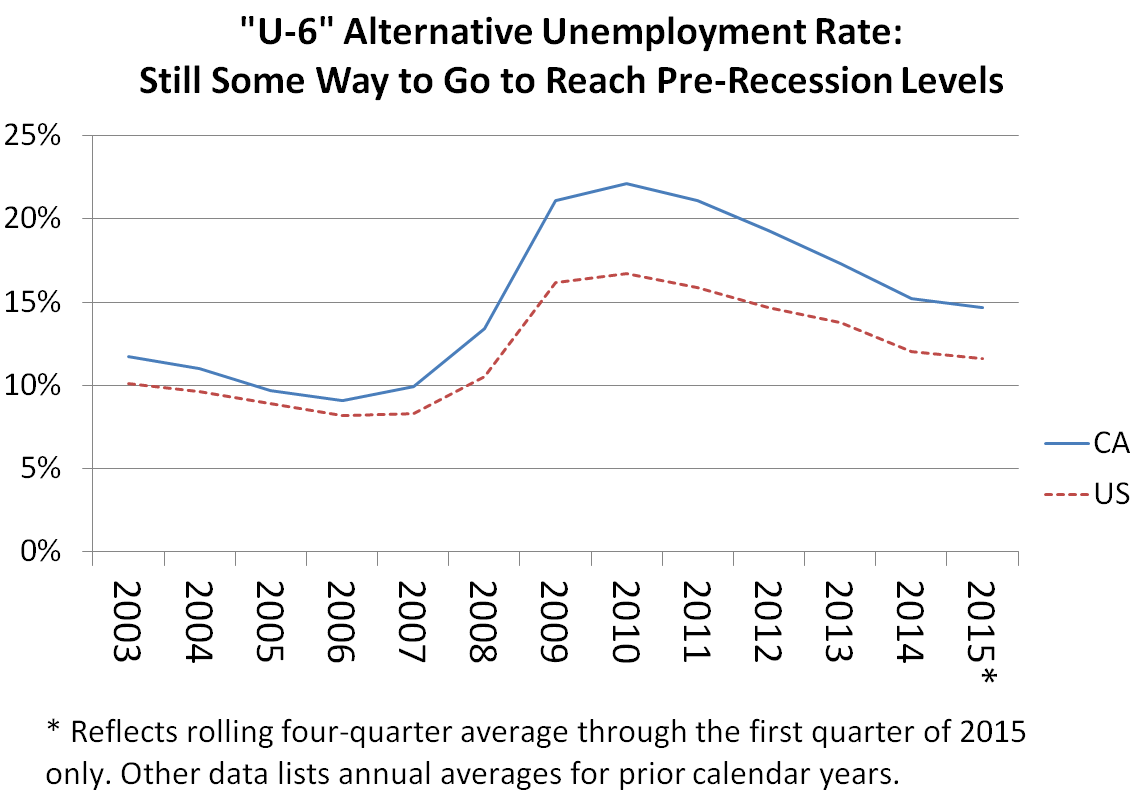
2015Q1 Labor Underutilization Data. BLS provides alternative measures like U-6 on a four-quarter moving-average basis for states to increase the reliability of Current Population Survey estimates (which are based on small sample sizes at the state level) and to reduce the effects of seasonality on the measure. According to the newly updated data (which considers the first quarter of 2015), the current four-quarter moving-average U-6 rate is 14.7% for California and 11.6% for the U.S. as a whole. Only Nevada has a higher U-6 rate among the states at 15.3%. For Los Angeles County, one of the only substate areas reported in this dataset, the four-quarter U-6 rate is 16.6%.
By its nature, the U-6 rate is higher than the official U-3 unemployment rate. For the last four quarters, on average, the official U-3 rate is reported to have been 7.1% for California, 7.9% for Los Angeles County, and 5.9% for the U.S. as a whole. (BLS notes that survey differences may cause this four-quarter U-3 measure to differ from the commonly reported state unemployment rates over the same period.)
U-6 has improved markedly for both California and the U.S. since its peak in 2010, as shown below. Still, especially for California, U-6 remains significantly above where it was in 2006 prior to the economic downturn. (California's U-6 rate was 9.1% then.)
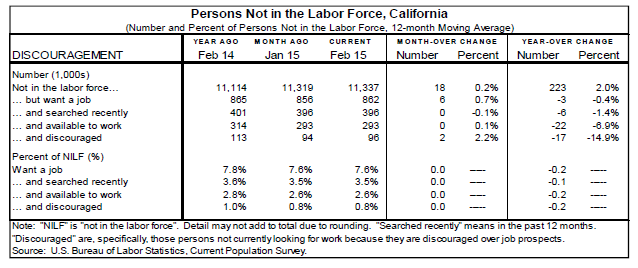
Other Labor Underutilization Data. Near the bottom of our recent blog post on March 2015 California jobs data, we discussed the declining numbers of Californians "not in the labor force" who still wanted a job. The estimated number of Californians not in the labor force who were "discouraged" workers (those not currently looking for work because they are discouraged over job prospects) fell sharply over the past year, as indicated below in a table produced by the Employment Development Department.