With a state as big, as populous, and as complex as California, it would be impossible to quickly summarize how its economy or state budget works. The purpose of Cal Facts is more modest. By providing various "snapshot" pieces of information, we hope to provide the reader with a broad overview of public finance and program trends in the state.
Cal Facts consists of a series of charts and tables which address questions frequently asked of our office. We hope the reader will find it to be a handy and helpful document.
—Mac Taylor, Legislative Analyst

December 5, 2016

CAL FACTS California's Economy
California's Economy: One of the Largest in the World
Gross Domestic Product (In Trillions)
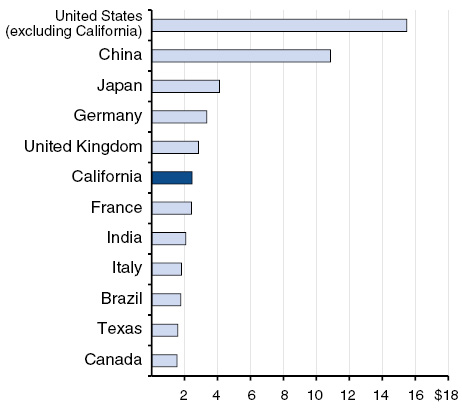
- Gross domestic product (GDP) is the value of goods and services produced in a country or state.
- Measured in U.S. dollars, only five countries had a GDP larger than California’s $2.5 trillion GDP in 2015. Weakness in the value of European currency caused France’s GDP to be just a bit smaller than California’s that year.
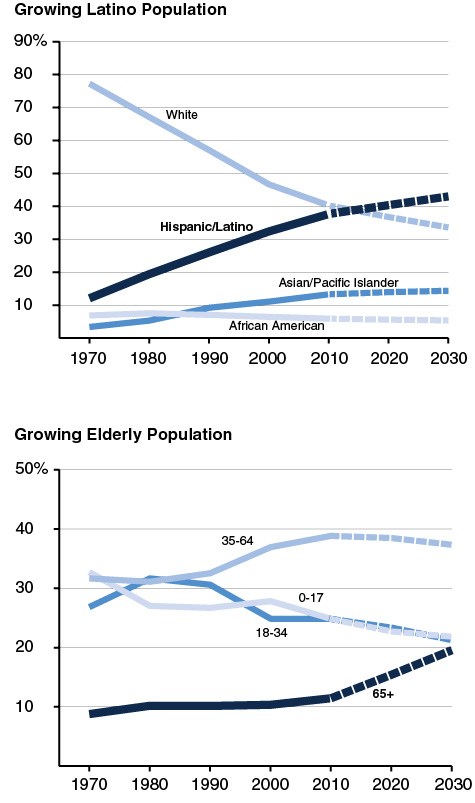
- With 34 percent of California’s population, the Los Angeles/Orange County region produces 38 percent of California’s economic output. With only 17 percent of the population, the Bay Area produces 27 percent of the state’s output.
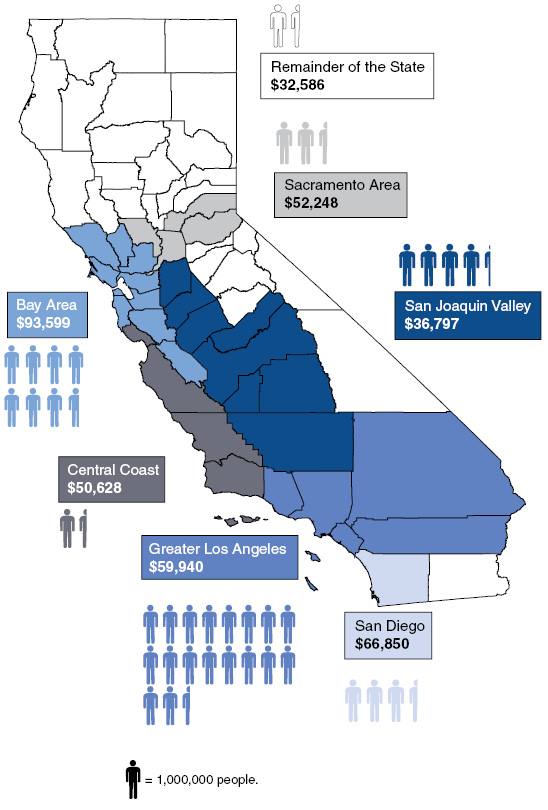
Economic Output Varies Throughout the State
Population and Per Capita Gross Domestic Product
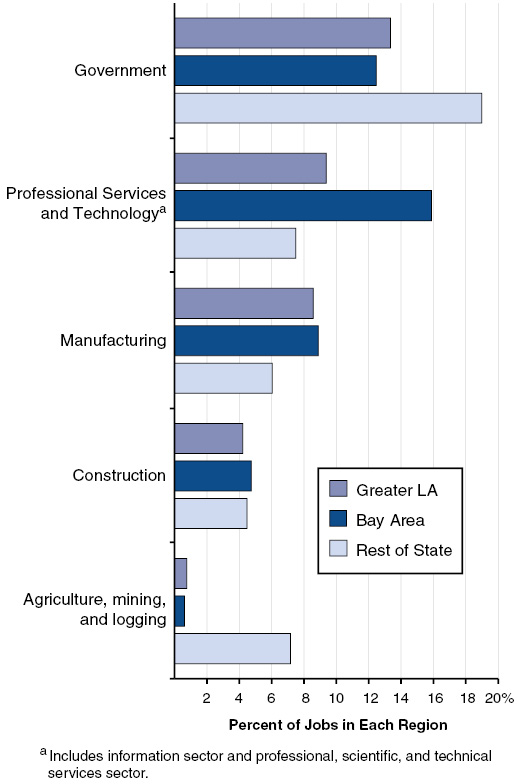
Job Mix Varies in Different Regions of California
Employment Concentration in Selected Sectors, 2015
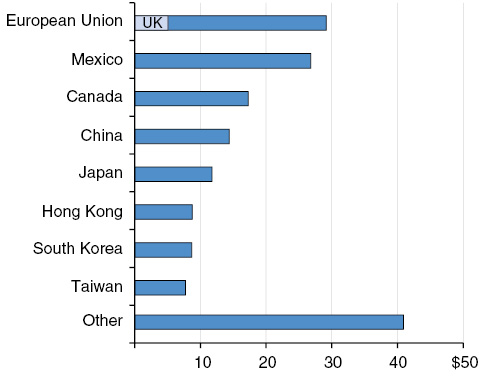
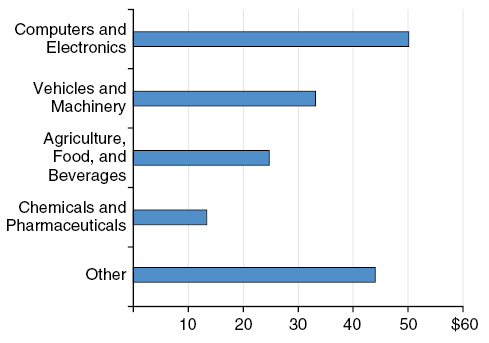
International Trade Is Important to California's Economy
2015 International Goods Exports (In Billions)
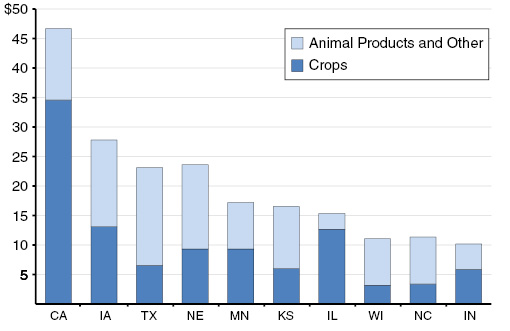
California Is the Nation's Leading Farm State
2015 Value of Farm Production (In Billions)
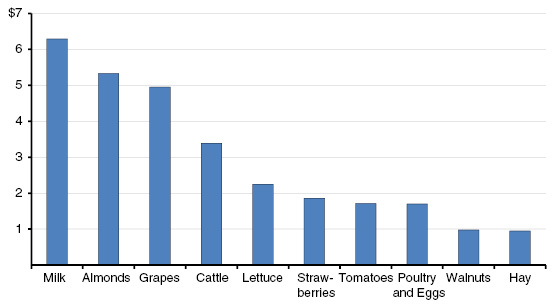
California’s Top Ten Valued Commodities in 2015 (In Billions)
Poverty Varies Across Counties, Driven in Part by Housing Costs
Poverty Ratea, 2011 Through 2013
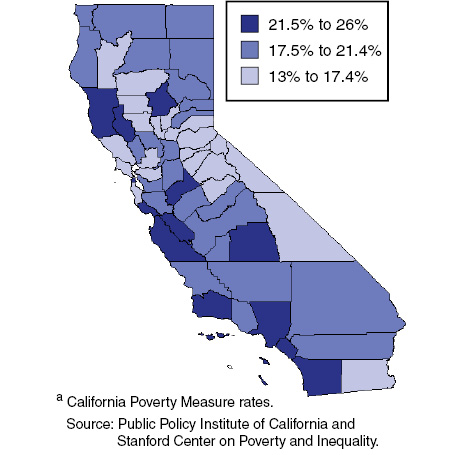
- Unlike the federal Official Poverty Measure, the California Poverty Measure (CPM) accounts more comprehensively for certain household costs and government assistance and adjusts for regional differences in housing costs. High housing costs in a county are one factor that contributes to a high poverty rate under this measure.
- Under the CPM, from 2011 through 2013, poverty rates varied across counties from a low of 13 percent to a high of 26 percent. Over this same period, the statewide CPM rate was 21.2 percent, equivalent to 8 million Californians being considered poor.
Top Incomes Higher in California Than in the U.S.
2015 Household Incomes
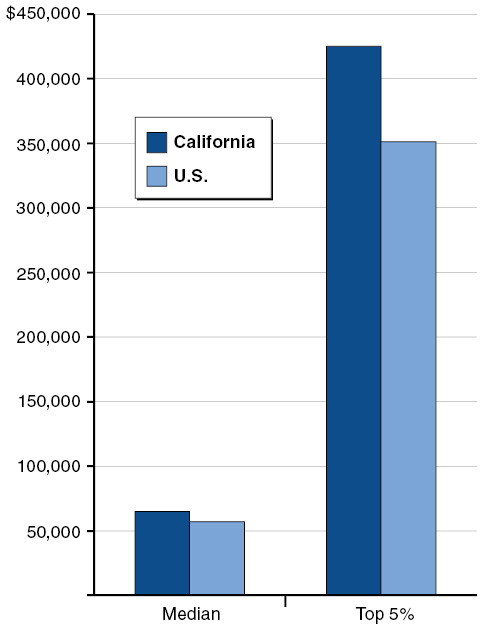
- “Top 5%” refers to the mean of the top 5 percent of incomes. California has the fifth-highest “Top 5%” among the 50 states. (Other estimates of the highest incomes, such as the 99th percentile, are not available.)
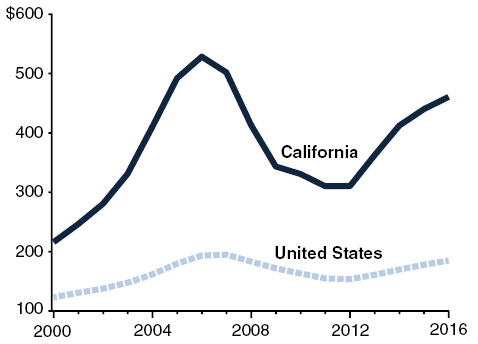
California Home Prices Rising Faster Than U.S.
Median Home Price (In Thousands)
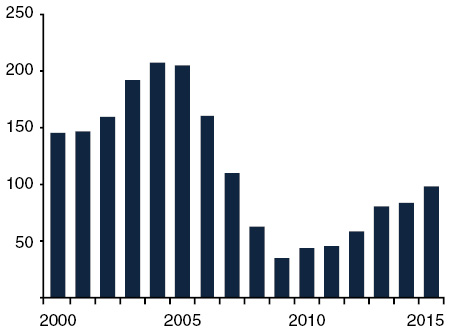
Home Building Below Historical Norm
Residential Building Permits (In Thousands)
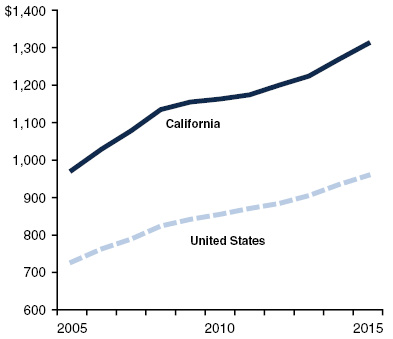
Rents Higher in California
Median Monthly Rent
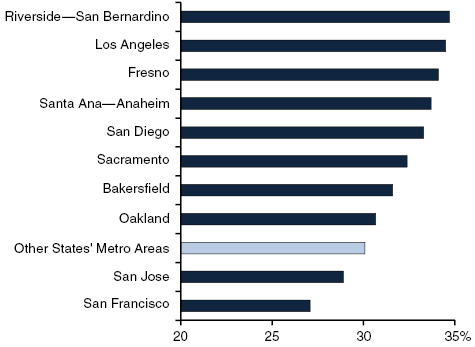
Many Pay More Than One-Third of Their Income in Rent
Share of Income Spent on Rent, 2015
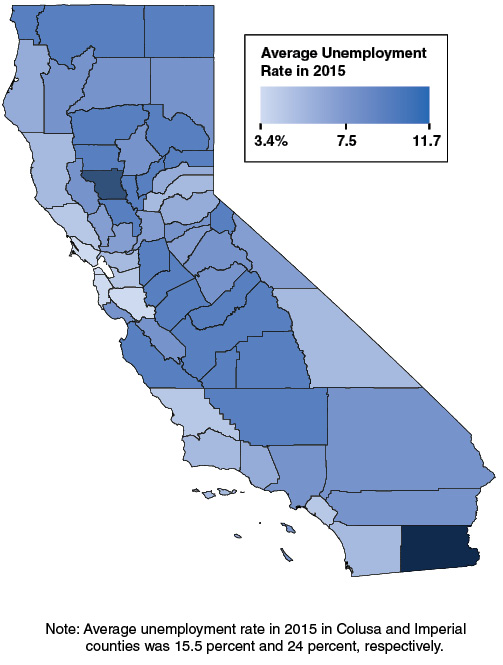
Unemployment Rates Generally Highest in Central Valley
California’s Changing Population
(As Percent of Actual or Projected Population)