With a state as big, as populous, and as complex as California, it would be impossible to quickly summarize how its economy or state budget works. The purpose of Cal Facts is more modest. By providing various "snapshot" pieces of information, we hope to provide the reader with a broad overview of public finance and program trends in the state.
Cal Facts consists of a series of charts and tables which address questions frequently asked of our office. We hope the reader will find it to be a handy and helpful document.
—Mac Taylor, Legislative Analyst
December 5, 2016
California Governments Rely On a Variety of Taxes
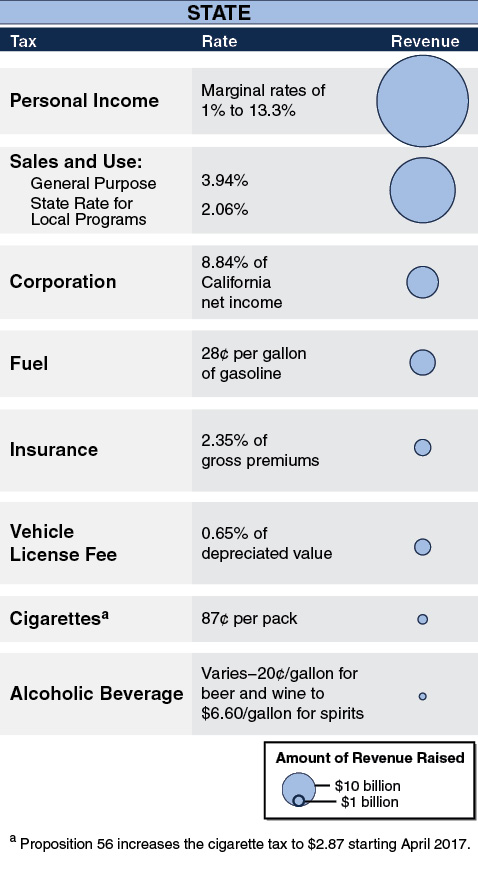
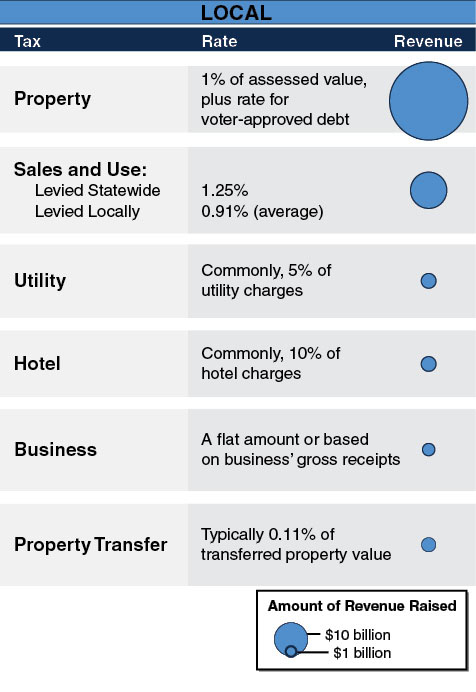
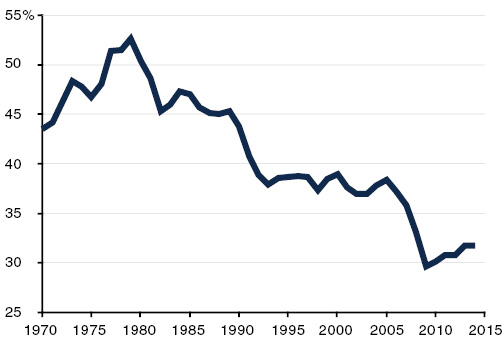
Personal Income Tax Is the Dominant State Revenue Source
Share of General Fund Revenues
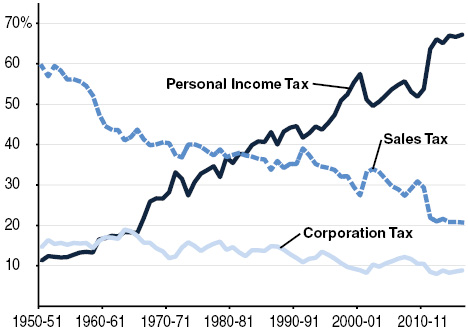
- Although revenues from all big three tax sources have grown over the past several decades, the personal income tax (PIT) has replaced the sales tax as the predominant source of General Fund revenue.
- The increase in the PIT is due to rapid growth in incomes (including capital gains) of high-income people who are taxed most heavily under the state’s progressive tax structure.
- Throughout the period, the prices of services (such as housing and healthcare) have grown faster than the prices of goods. Unlike goods, services are not subject to the state’s sales tax.
Personal Income Tax Is More Volatile Than Economy
Percent Change From Prior Fiscal Year
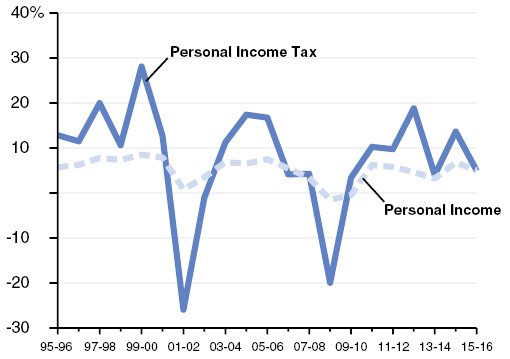
- Personal income is a broad measure of economic activity in California. It measures wages and salaries and various other types of income.
- The personal income tax (PIT), the state’s largest state revenue source, is more volatile than personal income. This is in part because the PIT is levied on relatively volatile components of personal income. In addition, the state taxes especially volatile types of income not included in the measure of personal income—in particular, capital gains (income resulting from sales of assets, such as stocks). PIT is also volatile because the state’s progressive tax structure taxes higher-income taxpayers—whose incomes are volatile—at higher rates.
Top 1 Percent of Income Earners Pay Up to Half of State Income Taxes
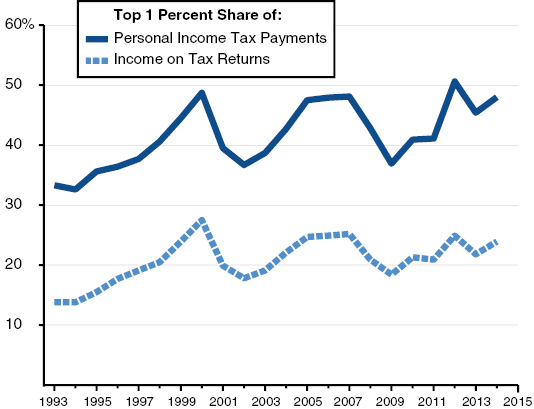
- The share of California’s personal income tax (PIT) paid by the top 1 percent of tax returns is highly volatile. This share goes up and down with changes in stock and other asset prices, as well as business income.
- With the PIT now providing over two-thirds of state General Fund revenue, income fluctuations among these high-income taxpayers can contribute to state revenues rising or falling by billions of dollars per year.
Corporation Tax Liability as Percent of Profits Has Declined
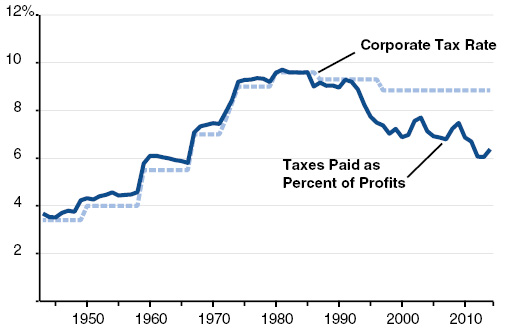
- Using various provisions of state tax law, such as tax credits, corporations may reduce their tax liability. This can result in the firms’ final tax liabilities—as a percent of their California profits—being less than the main 8.84 percent corporate tax rate in state law.
- The state has made various major changes in corporate tax law in recent decades. These include expansions of some tax credits and other changes. Such changes have contributed to a sharp decline in corporation tax liabilities as a percent of profits. In prior decades, these tax liabilities were closely linked with the state tax rate.
Sales and Use Taxes Levied for State and Local Purposes
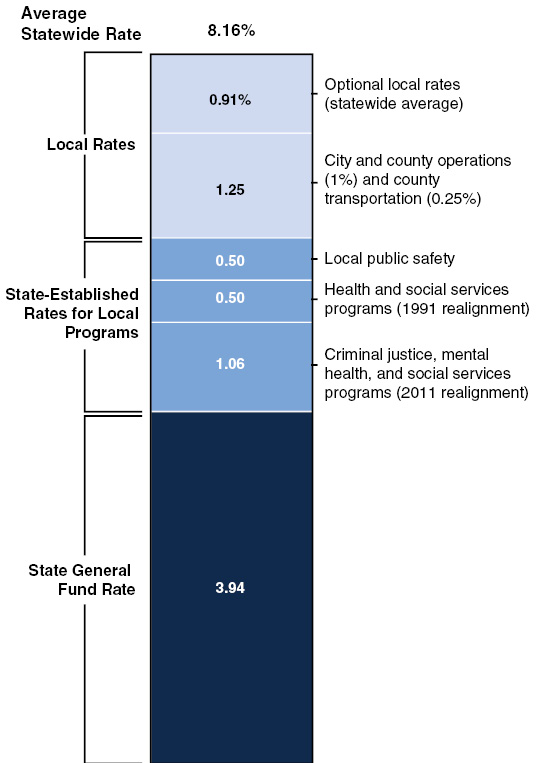
Consumers Are Spending a Declining Share of Income on Taxable Goods
- Since 1970, the state’s sales tax base, “taxable sales,” has grown 6.2 percent per year, while personal income—the total income earned by businesses and individuals in California—has grown 7 percent per year. Californians are spending more of their income on housing, health care, and other services not subject to the sales tax.
- Total state and local sales tax revenue has grown 7.4 percent per year since 1970. Revenue growth has outpaced taxable sales growth because the average sales tax rate has increased from 5 percent to 8.2 percent.
Ballot Measures Have Had Major State-Local Fiscal Implications
|
Proposition (Year) |
Key Provisions |
|
13 (1978) |
Limits property tax rates and assessment increases. Establishes vote requirement for certain taxes. |
|
4 (1979) |
Sets annual state and local spending caps. Requires state to reimburse local governments for some state mandates. |
|
98 (1988) |
Establishes minimum funding requirement for schools and community colleges. |
|
172 (1993) |
Imposes half-cent sales tax for local public safety programs. |
|
218 (1996) |
Limits local government authority to impose certain taxes, fees, and assessments. |
|
39 (2000) |
Lowers voter approval requirements to 55 percent for certain local school bonds. |
|
1A (2004) |
Restricts state from reducing local property tax, sales tax, and vehicle license fee revenues. |
|
22 (2010) |
Reduces state’s authority to use or redirect state fuel and local property taxes |
|
25 (2010) |
Lowers Legislature’s vote requirement for state budget to a simple majority. |
|
26 (2010) |
Broadens definition of taxes to include some additional fees and charges. |
|
30 (2012) & 55 (2016) |
Temporary state tax increases. Proposition 55 extends the income tax increases through 2030. |
|
2 (2014) |
Sets new rules for state and school budget reserves and debt payments. |
Historical Budget Reserve Balances
Percent of Revenues and Transfers
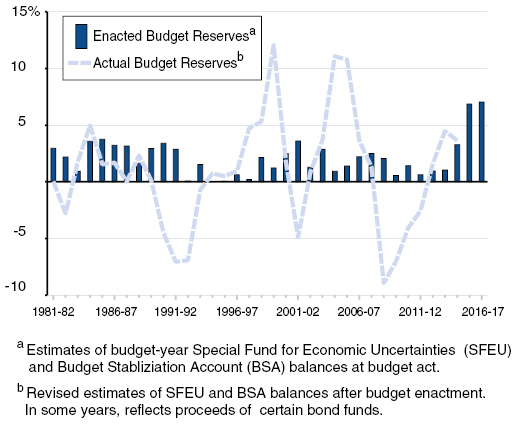
- Each year, the Legislature passes a budget with some reserves to cover unanticipated revenue shortfalls or higher costs. In the last two fiscal years, reserve balances have been considerably higher than historical averages. These reserve levels reflect both mandatory reserve deposits under Proposition 2 (2014) and additional, discretionary deposits.
- Actual reserve balances have differed—sometimes substantially—from reserves assumed in the budget act. Differences between enacted and actual reserve balances generally result when economic conditions are worse (or better) than assumed.
State Spending as Share of Economy Relatively Flat Since Late 1970s
General Fund and Special Funds as Percent of Personal Income
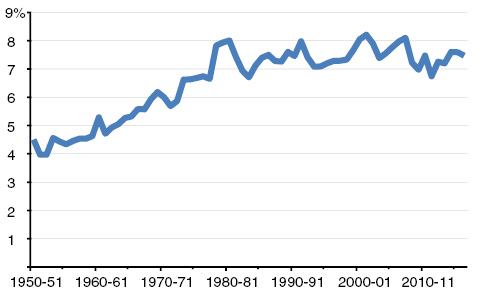
- State spending as a percent of personal income increased steadily from the late 1950s through the mid-1970s. Since the late 1970s, spending generally has ranged between 7 percent and 8 percent of personal income. (Personal income is one broad measure of the overall size of the California economy.)
- By a different measure—adjusted for inflation and population growth—state spending has generally increased since the 1990s.
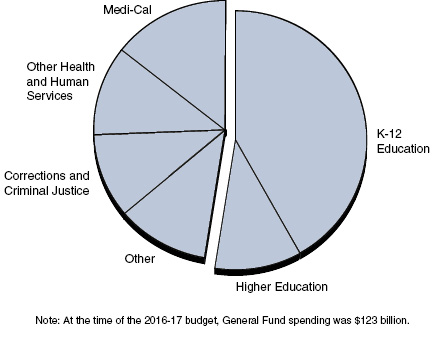
Education Makes up Over Half of General Fund Spending
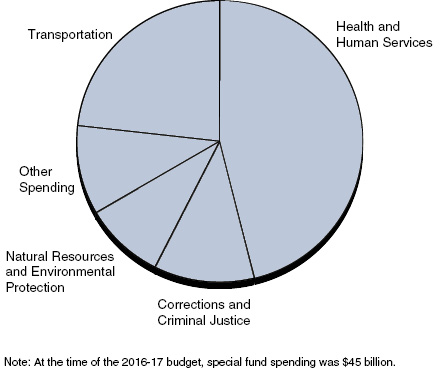
Health and Human Services Is Close to Half of Special Fund Spending
Universities Represent One-Third of State Government Jobs
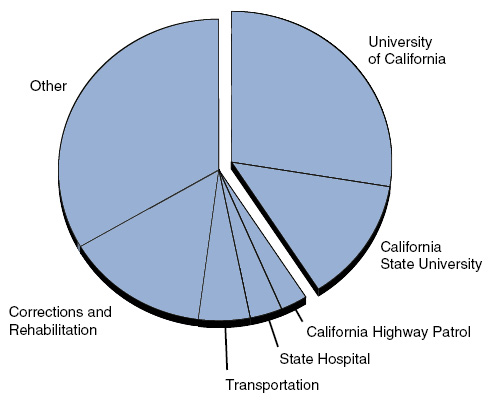
- In 2015-16, the state employed more than 350,000 full-time staff at a salary cost of roughly $28 billion (all funds).
- The state has long had many positions that are authorized but not filled. Across state departments, about 13 percent of positions are vacant. Departments hold many of these positions vacant in order to pay for other personnel and operating costs.
- Over the past 30 years, state employment has averaged 8.9 state employees per 1,000 population. In 2015-16, there were about 9.0 employees per 1,000 population.
State Costs for Employee Compensation Include Benefits
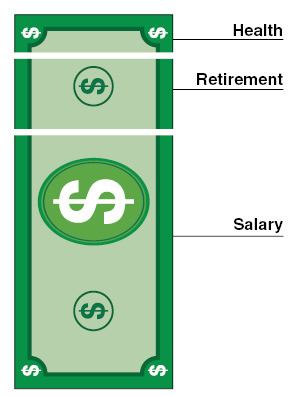
- Excluding university, legislative, and judicial employees, the state spent about $23 billion (all funds) in employee compensation costs in 2015-16. About 30 percent of these costs were for retirement benefits (including pensions, Medicare, and Social Security) and health benefits (including vision and dental).
- Annual state costs to provide health benefits to retired state employees are not included in the above graphic. These costs rise each year and were $1.8 billion in 2014-15.
The State Is Addressing More of Its Liabilities
(In Billions)
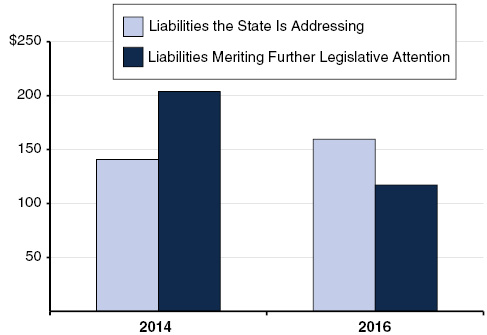
- The state now has plans in place to pay down nearly 60 percent of its $277 billion in budgetary, infrastructure, and retirement liabilities. These plans include paying down pension unfunded liabilities and making regularly scheduled payments on infrastructure bond debt service.
- Legislation passed in 2014 aims to fully fund the teacher pension system (CalSTRS). The plan assigns responsibility for $62 billion of the $76 billion total unfunded liability to school and community college districts, thereby reducing state liabilities by a like amount (shown as a reduction between 2014 and 2016).
- By contrast, the state does not yet have plans to fully address unfunded liabilities for retiree health benefits for state and University of California employees. Without further state action, those liabilities will continue to grow.
Voting Requirements to Increase Taxes, Fees, Assessments or Debt
|
Measure |
Governing Body |
Voters |
|
State |
||
|
Tax |
2/3 |
— |
|
Fee |
Majority |
— |
|
General obligation bond |
2/3 |
Majority |
|
Lease revenue bond |
Majority |
— |
|
Initiative proposing revenue or debt |
— |
Majority |
|
Constitutional amendment proposed by the Legislature |
2/3 |
Majority |
|
Local |
||
|
Tax: |
||
|
Funds used for general purposes |
2/3a |
Majority |
|
Funds used for specific purposes |
2/3a |
2/3 |
|
Property assessment |
Majority |
Majorityb |
|
Fee |
Majorityc |
— |
|
General obligation bond: |
||
|
K-14 districts |
2/3 |
55 percent |
|
Cities, counties, and special districts |
2/3 |
2/3 |
|
Revenue bond |
Majority |
Majoritya |
|
Other debt |
Majority |
—d |
|
aFor most local agencies. bVotes weighted by assessment liability of affected property owners. cFees on property (excluding water, sewer, refuse collection, gas, and electric fees) require voter approval. dEnhanced infrastructure financing district debt requires approval by 55 percent of the district’s voters. |
||
Paying for County, City, and Special District Services
2014-15 (In Billions)
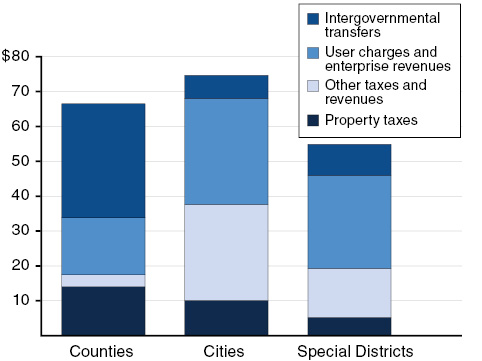
- Counties receive nearly half of their revenues from the state and federal government and must spend these funds for specific purposes, primarily health and social service programs.
- Cities and special districts receive a significant share of their funding from various user charges. Cities and special districts use these funds to pay for electric, water, and other municipal services.
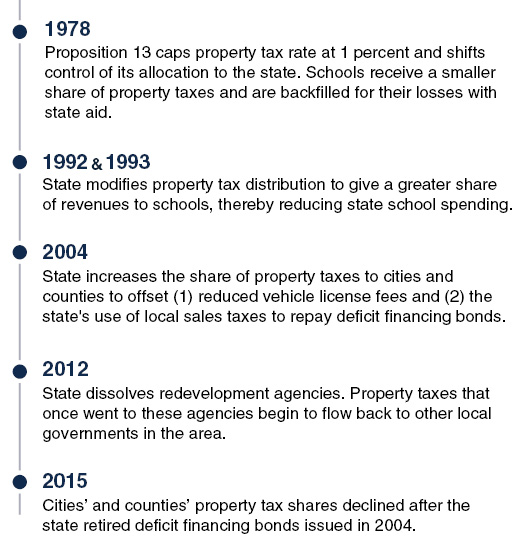
Allocation of Property Tax Has Varied Over Time
(Dollars in Billions)
|
Selected Years |
Revenue |
Tax Revenue Distribution |
|||
|
Schools |
Counties |
Cities |
Other |
||
|
1977-78 |
$10.3 |
53% |
30% |
10% |
6% |
|
1979-80 |
5.7 |
39 |
32 |
13 |
16 |
|
1993-94 |
19.1 |
51 |
21 |
11 |
18 |
|
2014-15 |
55.5 |
40 |
25 |
18 |
17 |
|
Information includes debt levies. "Other" includes redevelopment agencies and special districts. |
|||||
