With a state as big, as populous, and as complex as California, it would be impossible to quickly summarize how its economy or state budget works. The purpose of Cal Facts is more modest. By providing various "snapshot" pieces of information, we hope to provide the reader with a broad overview of public finance and program trends in the state.
Cal Facts consists of a series of charts and tables which address questions frequently asked of our office. We hope the reader will find it to be a handy and helpful document.
—Mac Taylor, Legislative Analyst
December 5, 2016
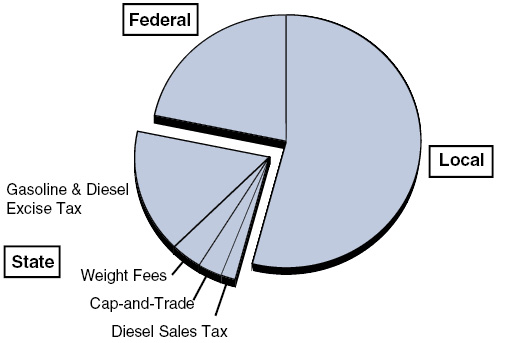
Transportation Funding Comes From Multiple Sources
2016-17

- Total transportation funding in the state will be roughly $28 billion in 2016-17.
- Local governments provide more than half of all transportation funding in California. Local transportation funding sources include local sales taxes, transit fares, development impact fees, and property taxes.
- About one-fifth of the state’s transportation funding comes from the federal government, supported primarily by federal excise taxes on diesel and gasoline.
- The remainder of transportation funding comes from a variety of state revenue sources—primarily excise taxes on gasoline and diesel.
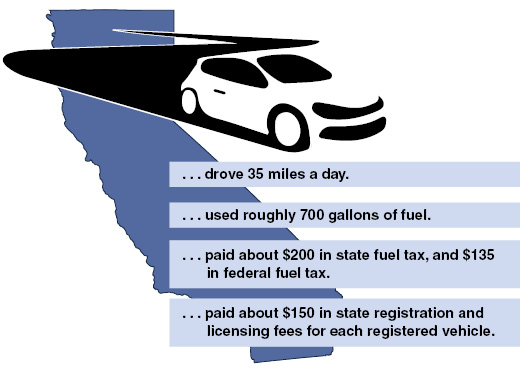
Average California Driver in 2015 . . .

- In 2015, there were 26 million licensed drivers in California, which is about 85 percent of Californians age 16 and older.
- Traffic collisions remain a leading cause of preventable death in California with 3,074 people killed in crashes in 2014. California had the 16th lowest fatality rate in the nation—0.92 fatal injuries for every 100 million miles driven.
- Roughly 85 percent of Californians drive to work alone or in a carpool, while about 5 percent of Californians use transit and about 4 percent walk or use a bicycle to reach their jobs.
- Roughly 1 in every 20 passenger vehicles registered in California is a hybrid, electric, or alternative fuel vehicle.

