LAO Contact
See These Related Posts

January 10, 2019
Main Types of Disasters and Associated Trends
Below, we summarize the most common disasters affecting California—floods, fires, and earthquakes. (For more information on these disasters, see the state’s Multi-Hazard Mitigation Plan.) We also provide some information on key disaster trends.
Overall Trends
Major Types of Disasters Include Flooding, Fires, and Earthquakes. California is prone to various disasters, most notably those from excessive rain (flooding and other storm damage), fires, and earthquakes. As shown in Figure 1, the most common types of disasters include flooding and fires. For example, in the period from 1950‑2017, the Governor made 309 State of Emergency declarations, about 40 percent of which were related to floods and about 30 percent of which were related to fires. Major earthquakes have occurred less frequently than flooding and fires—representing about 7 percent of state emergency declarations. However, when they do occur, earthquakes can be some of the most destructive types of disasters. Specifically, three out of the last five most deadly disasters in the state since 1950 have been earthquakes.
Figure 1
Major Types of Disasters in California
1950-2017
|
Type of Disaster |
Types of Disaster Declarationsa |
||
|
State Emergency |
Federal Major Disaster or Emergency |
Federal Fire Management |
|
|
Floods and storms |
127 |
52 |
— |
|
Fire |
96 |
23 |
189 |
|
Earthquake |
22 |
13 |
— |
|
Otherb |
64 |
7 |
— |
|
Totals |
309 |
95 |
189 |
|
aA disaster may receive more than one type of disaster declaration. bIncludes droughts, freezes, tsunamis, and all other types of disasters. |
|||
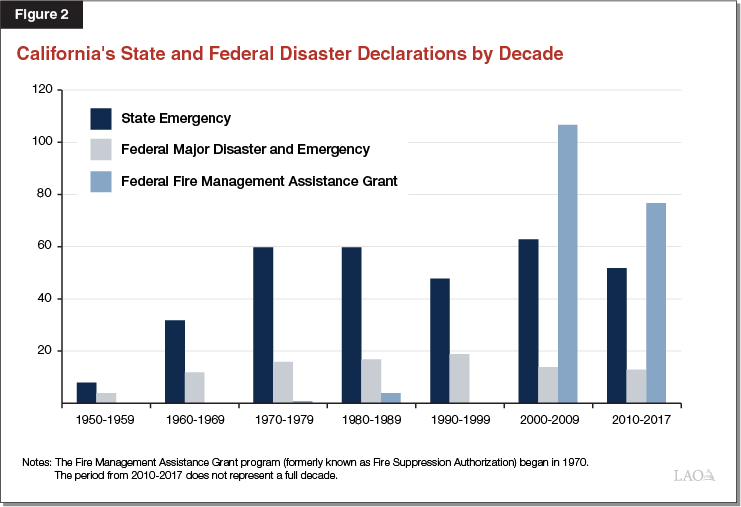
Number of Disaster Declarations Relatively Stable Over Time, Except for Fires. Most types of disaster declarations have been relatively stable over time. (We discuss these declarations in more detail in our How California Governments Respond to Disasters post.) Specifically, as shown in Figure 2, the number of state emergency declarations has averaged about 60 per decade in recent decades. Also, the state typically has had 10 to 20 Major Disaster and Emergency Declarations per decade in recent decades. A main exception to this stability is federal Fire Management Assistance Grant (FMAG) declarations for large wildfires that risk becoming major disasters. The number of FMAGs that the state has received has increased substantially in recent decades, from an average of fewer than five per decade in the 1970s, 1980s, and 1990s to an average of about ten per year (100 per decade) since 2000. The increase in FMAGs in recent decades is likely in part due to the increase in severity and frequency of fires, which we describe below. Additionally, the Congressional Research Services’ report Stafford Act Declarations 1953‑2016: Trends, Analyses, and Implications for Congress identifies some changes in federal policies for declaring disasters. (See the Federal Emergency Management Agency’s website for an interactive tool displaying federal disaster declarations in California.)
Deaths, Injuries, and Costs Vary Over Time. As shown in Figure 3, deaths and injuries from disasters have varied over time, with some years experiencing much higher casualties than others. For example, there was a notable spike in injuries in the 1990s due to the Northridge earthquake, which resulted in close to 12,000 injuries. Additionally, disaster costs have also varied over time depending on the number, type, and location of disasters. Federal spending for the major disaster assistance programs were highest in the 1970s and 1990s because of a major drought in the 1970s and the Northridge Earthquake in the 1990s. (These figures include federal disaster assistance programs such as the Individuals and Households Program and Public Assistance Program but do not include other types of local, state, or private costs.)
Figure 3
California’s Disaster Deaths, Injuries, and OES Administered Costsa by Decade
(Costs in 2018 Dollars, in Billions)
|
Decadeb |
Deaths |
Injuries |
Costs |
|
1950-1959 |
100 |
227 |
$3.1 |
|
1960-1969 |
99 |
1,224 |
5.3 |
|
1970-1979 |
96 |
2,226 |
20.2 |
|
1980-1989 |
128 |
5,243 |
7.8 |
|
1990-1999 |
224 |
15,592 |
16.1 |
|
2000-2009 |
59 |
885 |
2.6 |
|
2010-2017 |
92 |
27 |
1.1 |
|
Totals |
798 |
25,424 |
$56.2 |
|
aIncludes federal grant programs administered by OES such as the Individuals and Households and Public Assistance Programs, but does not include other types of local, state, or private costs. bData for recent years is preliminary. |
|||
|
OES = Office of Emergency Services. |
|||
Flooding
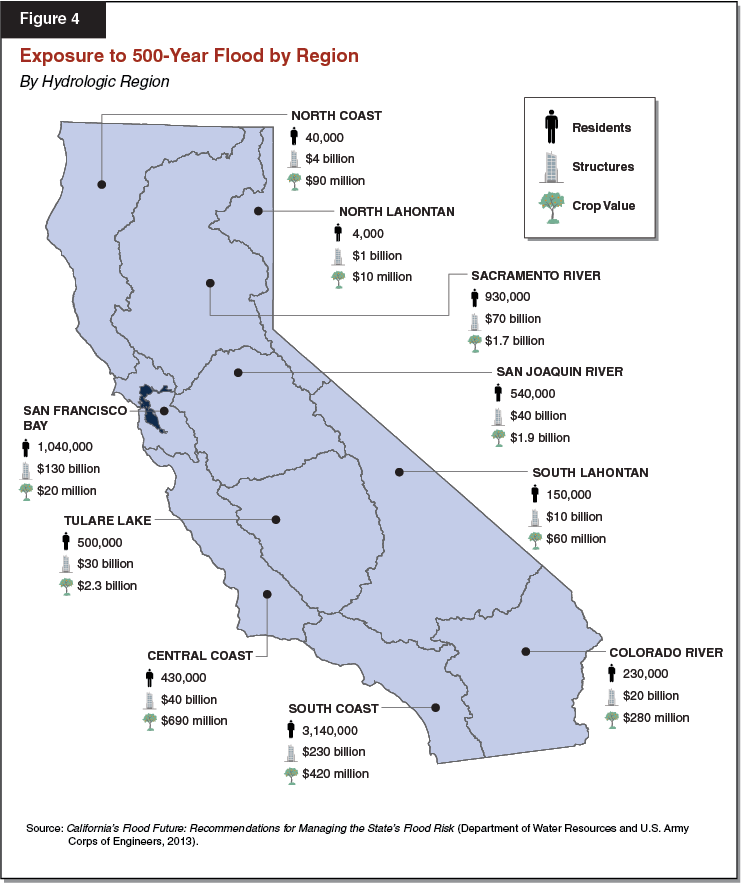
Flood Risk Is Widespread, but Some Portions of the State Are at Higher Risk. All areas of the state are subject to at least some form of flooding. Since 1992, every county in California has been declared a federal disaster area at least once for a flooding event. However, some portions of the state—such as parts of the Sacramento Valley—are more prone to flooding than others. This is because some portions of the state are closer to possible flood risks, such as major rivers. Also, as shown in Figure 4, some areas of the state have more people and property that are exposed to flood risk due to natural flood risks and development patterns. (For more information on flooding, see our report Managing Floods in California.)
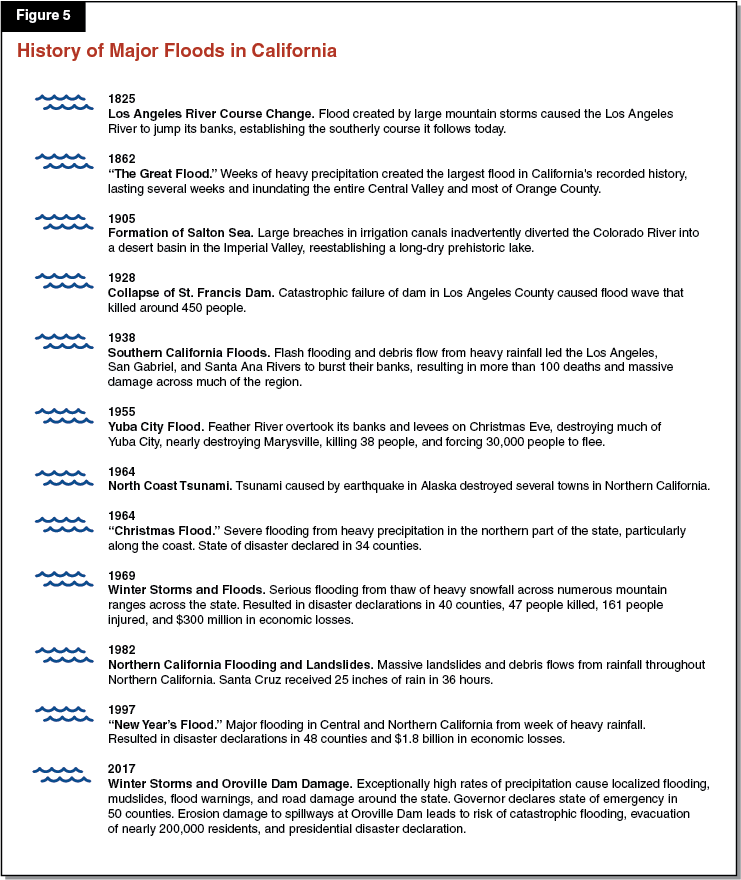
State Has Experienced Many Notable Floods in Recent Decades. Figure 5 highlights some of the notable floods that have affected the state. For example, in 1997, major flooding occurred in Central and Northern California from a week of heavy rainfall resulting in disaster declarations in 48 counties and $1.8 billion in economic losses. More recently, in 2017, exceptionally high rates of precipitation caused localized flooding, mudslides, flood warnings, and road damage around the state. The Governor declared state of emergency in 52 counties, and erosion damage to spillways at Oroville Dam led to risk of catastrophic flooding and evacuation of nearly 200,000 residents.
Wildfires
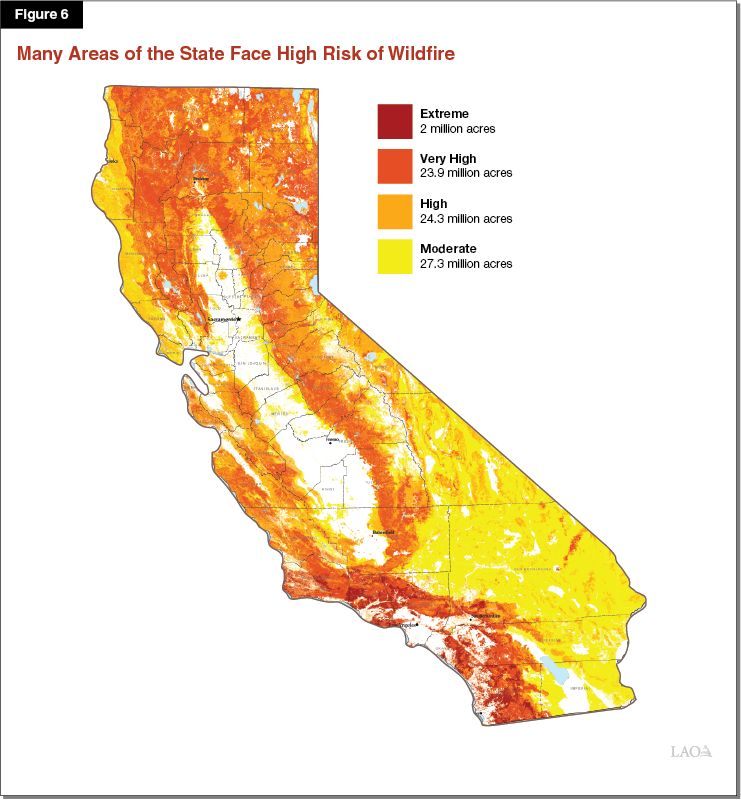
Portions of the State Are at High Risk of Destructive Wildfire. Many parts of California experience wildfires and some portions of the state are prone to particularly destructive wildfires based on their typography, local weather, and the health and density of local forests. As shown in Figure 6, the California Department of Forestry and Fire Protection estimates that significant portions of the state face a high to extreme threat of wildfires, including most forested regions of the state. (For more information on fires in California, see our publication A Primer: California’s Wildland Fire Protection System.)
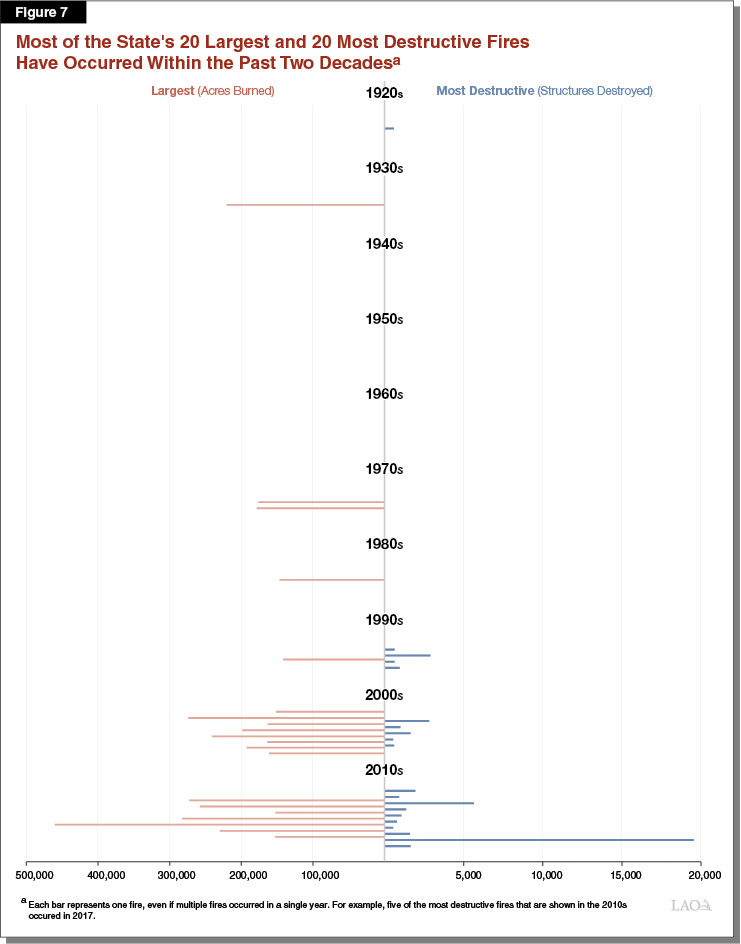
Frequency of Severe Fires Has Increased in Recent Years. As shown in Figure 7, the majority of the largest and most destructive (as measured by structures destroyed) fires in state history have taken place within the past 20 years. One reason for the increase in destructive fires is the poor health of the state’s forests. For example, almost 130 million trees have died in recent years due to drought and bark beetle infestations, contributing to fire risk. Additionally, certain forest management practices employed over the past several decades—including limitations on allowing moderate fires to burn as they historically would have—have significantly increased the density of trees and brush across the state’s forests, providing fuel that intensifies the severity of fires when they inevitably do occur. There also are other contributors to the longer-term trend of increasingly costly and damaging fires, such as the increased development in wildland areas that are at risk for wildfires, which places more property and life in danger when wildfires occur in the state. Of particular note, the state experienced the largest and most destructive fires in its history in 2018—the Mendocino Complex Fire, which burned over 400,000 acres, and the Camp Fire in Butte County, which destroyed over 18,000 structures. As of December 2018, estimates of insured losses from the Camp Fire totaled $7 billion. (At the time of this post, insured losses were anticipated to increase as more claims were filed and processed.)
Earthquakes
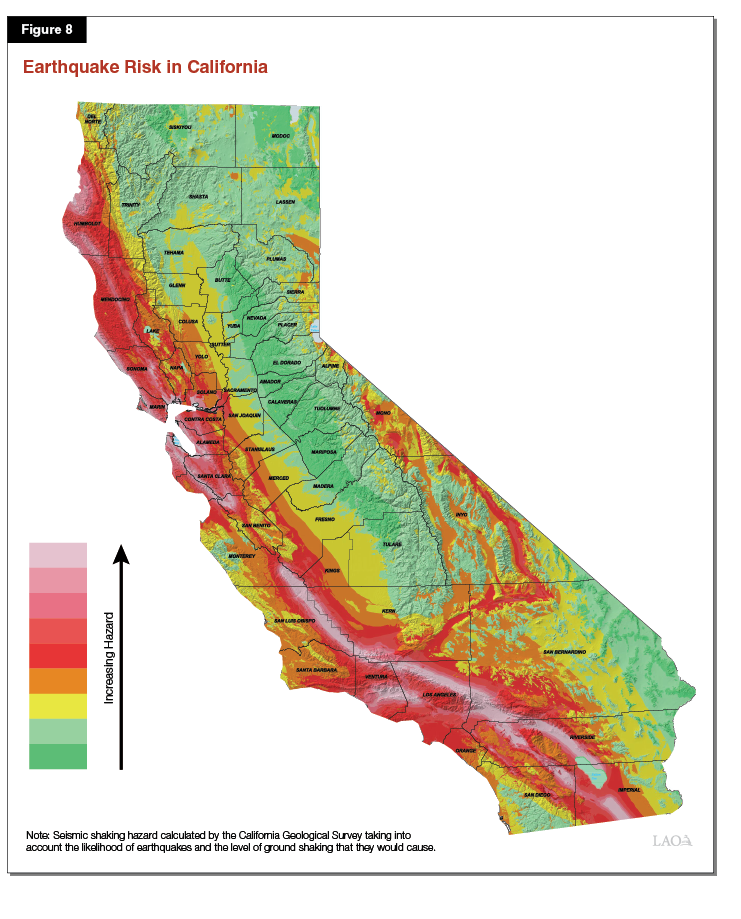
Portions of the State at High Risk of Damaging Earthquakes. There are several significant fault lines that run through California that pose a significant risk for damaging earthquakes in the surrounding areas. Figure 8 shows the areas of the state at highest risk of earthquakes. (An interactive map of historical earthquakes is available on the California Department of Conservation’s website.) Notably, damage from earthquakes depends not only on the earth quake’s magnitude, but also on other factors, including the depth of the earthquake, the distance from the center of the earthquake, the type of soil in the area, and the amount and type of local development. Some of the state’s most heavily populated areas—such as the San Francisco Bay Area and Los Angeles area—are in close proximity to major fault lines, increasing the chance that a large earthquake in one of those areas would create significant damage to people and property, as has occurred in the past.
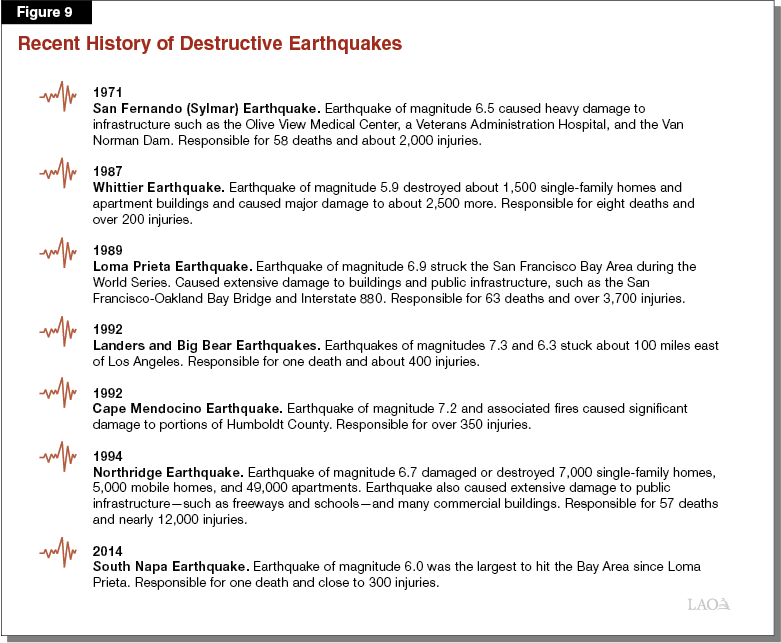
State Periodically Experiences Damaging Earthquakes. The state has experienced a number of destructive earthquakes in its history. Figure 9 highlights some of the major earthquakes that have affected the state in the past 50 years. For example, in 1989, the Bay Area was affected by the Loma Prieta earthquake, which resulted in 63 deaths and over 3,700 injuries. Another major earthquake came in 1994, when the Northridge earthquake caused 57 deaths and close to 12,000 injuries. The Northridge earthquake resulted in over $15 billion in insured losses in 1994 dollars ($26 billion in 2018 dollars).