LAO Contacts
- Ryan Anderson
- CalWORKs
- Jackie Barocio
- In-Home Supportive Services
- SSI/SSP
- Angela Short
- Child Welfare Services
- Continnum of Care Reform

February 24, 2020
The 2020-21 Budget
Department of Social Services
Summary
The DSS Administers Several Major Human Services Programs. California’s Department of Social Services (DSS) administers a number of human services programs that provide a variety of benefits to the state’s residents. These include income maintenance for the aged, blind, or disabled; cash assistance and employment services for low‑income families with children; protecting children from abuse and neglect; and providing home care workers who assist the aged and disabled in remaining in their own homes. This brief provides information, analysis, and key issues to consider in evaluating the Governor’s 2020‑21 budget proposals for the major programs in DSS.
Governor’s Proposals for IHSS and SSI/SSP Program Appear Reasonable. We have reviewed the administration’s 2020‑21 budget proposals for the In‑Home Supportive Services (IHSS) and the Supplemental Security Income/State Supplementary Payment (SSI/SSP) programs. Overall, we find the administration’s proposals—primarily related to increases in caseload and cost per case—to be reasonable at this time. We will continue to monitor IHSS and SSI/SSP programs and update the Legislature if we think any changes to the caseload and budgeted funding levels should be made.
Governor’s Proposals for CalWORKs Appear Reasonable. We have reviewed the administration’s 2020‑21 budget proposals for California Work Opportunity and Responsibility to Kids (CalWORKs), which includes a 3.1 percent grant increase triggered and funded by growth in certain local revenues. Overall, we find the administration’s proposals to be reasonable at this time.
Governor Continues to Implement Continuum of Care Reform (CCR). The Governor’s budget proposes funding in 2020‑21 to continue to implement CCR in the state’s foster care system. At a high level, CCR aims to reduce reliance on long‑term group home placements and increase the utilization and capacity of home‑based family placements for youth in the foster care system. While the Governor’s proposal for CCR does not include any major policy changes, it does reflect more up‑to‑date estimates of the costs of CCR implementation—including the expiration of certain temporary funding augmentations for the counties. We provide background on CCR, highlight recent implementation progress and challenges, describe the Governor’s funding proposal and changes in funding from 2019‑20 to 2020‑21, and raise issues and questions for legislative consideration.
Proposed Deposit of $750 Million in CAAHS, Which Is Overseen by DSS, Discussed in Separate Report. In January, the Governor issued an executive order establishing the California Access to Housing and Services (CAAHS) Fund. The Governor envisions that the fund, overseen by DSS, will collect future state appropriations, as well as contributions from other governments and private sources, to fund various activities aimed at curbing homelessness. Days after the Governor issued his executive order, the Governor proposed in his 2020‑21 budget to deposit $750 million General Fund in one‑time funding into the CAAHS Fund. We discuss this proposal in detail in our report The 2020‑21 Budget: The Governor’s Homelessness Plan.
IHSS
Background
Overview of the IHSS Program. The IHSS program provides personal care and domestic services to low‑income individuals to help them remain safely in their own homes and communities. In order to qualify for IHSS, a recipient must be aged, blind, or disabled and in most cases have income below the level necessary to qualify for the SSI/SSP cash assistance program (for example, about $940 a month for an aged and/or disabled individual living independently in 2019‑20). IHSS recipients generally are eligible to receive up to 283 hours per month of assistance with tasks such as bathing, dressing, housework, and meal preparation. Social workers employed by county welfare departments conduct an in‑home assessment of an individual’s needs in order to determine the amount and type of service hours to be provided. In most cases, the recipient is responsible for hiring and supervising a paid IHSS provider—oftentimes a family member or relative. The average number of service hours that will be provided to an estimated 586,000 IHSS recipients is projected to be 114 hours per month in 2020‑21.
IHSS Receives Federal Funds as a Medi‑Cal Benefit. The IHSS program predominately is delivered as a benefit of the state federal Medicaid health services program for low‑income populations (known as Medi‑Cal in California). As a result, IHSS is subject to federal Medicaid rules, including the federal reimbursement rate of 50 percent of costs for most Medi‑Cal recipients. The state receives an enhanced federal reimbursement rate—93 percent in calendar year 2019 and 90 percent in calendar year 2020 and beyond—for individuals that became eligible for IHSS as a result of the Patient Protection and Affordable Care Act (about 3 percent of IHSS recipients). Additionally, about 45 percent of IHSS recipients, based on their relatively higher assessed level of need, qualify for an enhanced federal reimbursement rate of 56 percent, referred to as the Community First Choice Option. Overall, the effective federal reimbursement rate for IHSS is about 54 percent. The remaining IHSS costs are paid for by counties and the state.
Counties’ Share of IHSS Costs Is Set in Statute. Historically, counties paid 35 percent of the nonfederal—state and county—share of IHSS service costs and 30 percent of the nonfederal share of IHSS administrative costs. Beginning in 2012‑13, however, the historical county share‑of‑cost model was replaced with an IHSS county maintenance‑of‑effort (MOE), meaning county costs would reflect a set amount of nonfederal IHSS costs as opposed to a certain percent of nonfederal IHSS costs.
Budget Overview and LAO Assessment
The Governor’s budget proposes a total of $14.9 billion (all funds) for IHSS in 2020‑21, which is about $1.7 billion (13 percent) above estimated expenditures in 2019‑20. General Fund costs are estimated to be $5.2 billion in 2020‑21, a net increase of $712 million (16 percent) compared to estimated 2019‑20 levels. The year‑over‑year net increase in IHSS General Fund expenditures primarily is due to caseload growth, increased wage costs (including the state minimum wage), and the IHSS county MOE offsetting a smaller share of IHSS costs. In this analysis, we discuss some of the main components of the Governor’s proposed budget for IHSS and note any issues with them.
Primary Drivers of Increased Costs in IHSS
Caseload growth, a rising number of paid hours per case, and wage increases for IHSS providers are key drivers of increasing IHSS costs. In this section, we describe these trends and how these cost drivers affect the Governor’s 2020‑21 budget proposal for IHSS.
Increasing Caseload. The average monthly caseload for IHSS increased 30 percent over the past ten years, from about 430,000 in 2009‑10 to an estimated 560,000 in 2019‑20. Historically, the caseload fluctuated year‑to‑year, increasing at most by 5.6 percent in 2016‑17 and decreasing by as much as 4 percent in 2013‑14. More recently, average year to year IHSS caseload growth has remained at about 5 percent and is expected to continue growing at a similar rate in 2020‑21. Specifically, the 2020‑21 budget projects that IHSS caseload will increase to 586,000—4.5 percent above 2019‑20 caseload estimates. The reasons for the steady caseload growth in recent years are not completely understood, but could be related to the growth in California’s senior population (adults aged 65 and older). We have reviewed the caseload projections in light of actual caseload data available to date and do not recommend any adjustments at this time.
Increasing Paid Hours Per Case. Over the past ten years, the average number of monthly hours per case for IHSS has increased by 29 percent, from about 87 paid hours in 2009‑10 to an estimated 112 paid hours in 2019‑20. Between 2009‑10 and 2012‑13, average paid hours per case remained relatively flat—at around 87 hours. However, between 2013‑14 and 2018‑19, average paid hours per case increased by 22 percent—from 92 hours to 112 hours. The growth in average paid hours per case reflects, in part, a series of policy changes. For example, in 2015‑16 the state implemented the federal requirement that IHSS providers be compensated for previously unpaid work tasks, such as time spent waiting during their recipient’s medical appointments. Additionally, similar to the increase in the caseload, as the IHSS population ages, there may be an increasing number of more complex IHSS cases that typically require more service hours. For example, as recipients live longer, they may develop more severe needs and require an increasing amount of IHSS service hours. In recent years, absent major policy changes, average hours per case have steadily increased annually by an average of 2 percent.
The Governor’s budget estimates that the average hours per case will be roughly the same in 2019‑20 as they were in 2018‑19 (112 hours) and will then increase slightly to 114 hours in 2020‑21. We have reviewed the estimates of average hours per case in light of actual hours per case data available to date. While we do not raise any major concerns at this time, based on recent growth trends in hours per case, the average hours per case in 2019‑20 likely will be higher than (as opposed to remain roughly the same as) actual 2018‑19 average hours per case. To the extent that, similar to the prior years, the average hours per case grow in 2019‑20 and 2020‑21 (by about 2 percent annually), the combined General Fund costs for IHSS in 2019‑20 and 2020‑21 could be roughly $200 million higher than estimated in the Governor’s budget. We will continue to monitor the data related to average hours per case in preparation for the May Revision.
State and Local Wage Increases. In addition to increasing caseload and paid hours per case, provider wage increases have contributed to increasing IHSS costs. Since 2009‑10, the average hourly wage for IHSS providers increased by 30 percent, from $9.90 to an estimated $12.91 in 2019‑20. (This average IHSS wage reflects the base hourly wages for IHSS providers averaged across all counties.) IHSS provider wages generally increase in two ways—(1) increases that are in response to state minimum wage increases, and (2) increases that are collectively bargained or established at the local level.
The Governor’s budget includes $524 million General Fund ($1.1 billion total funds) in 2020‑21 for the combined impact of recent state minimum wage increases and local wage increases. Here we describe the estimated impact of state minimum wage and local wage increase.
- State Minimum Wage Increase. We estimate that about 40 percent of the increase in wage costs in 2020‑21—roughly $220 million General Fund—are attributable to the recent state minimum wage increases on IHSS provider wages from $12 per hour to $13 per hour on January 1, 2020 and the scheduled increase from $13 per hour to $14 per hour on January 1, 2021. The General Fund costs associated with state minimum wage increases in 2020‑21 are less than the estimated 2019‑20 costs. We estimate that this is because the average wage increases needed to reach $14 per hour ($0.35 average wage increase) is expected to be less than the wage increase needed to reach $13 per hour in 2020 ($0.42 average wage increase). This is primarily due to locally established wage increases making it so that average IHSS base wages are closer to the to $14 per hour state minimum wage level in 2020‑21 than they were to the $13 per hour state minimum wage level in 2019‑20. We explain this in more detail next.
- Local Wage Increase. We estimate that the remaining roughly 60 percent of the estimated increase in wage costs in 2020‑21—roughly $305 million General Fund—is attributable to wage increases established by counties above the state minimum wage, largely as a result of collectively bargained agreements. Historically, the nonfederal costs of locally established wage increases generally were shared between the state and counties. However, the 2017‑18 budget package made some changes that shifted what otherwise would have been county wage costs to the state. For example, counties can establish a “local wage supplement,” resulting in local IHSS wages always exceeding the state minimum wage by a specified amount. As previously mentioned, locally established wage increases, like wage supplements, have the effect of reducing the difference between the current wage in a particular county and the new state minimum wage. This then reduces the state cost of reaching the new state minimum wage. However, wage supplements shift additional costs that are above the state minimum wage level to the state, which prior to 2017‑18 would have been county costs. As of January 1, 2020, the state has approved local wage supplement provisions in 21 counties, an increase of 10 counties since January 1, 2019.
We are currently working with the administration to refine these cost estimates. We will provide an update as needed on the costs estimates for both state minimum wage increases and locally established wage increases as we continue to gather information.
Continues Restoration of IHSS Service Hours by 7 Percent
The Governor’s budget includes $402 million General Fund to continue the 7 percent restoration of IHSS service hours in 2020‑21. The state has relied on the General Fund to fund the restoration of IHSS service hours since 2016‑17. The 2019‑20 budget continued to use the General Fund to restore IHSS service hours, but also included legislation that allowed for a possible suspension on December 31, 2021 (depending on whether General Fund revenues are expected to exceed General Fund expenditures). The Governor’s budget continues to use General Fund to restore IHSS service hours, but delays the possible suspension by 18 months until July 1, 2023. While the determination of the suspension actually taking effect will be determined in the future, the Department of Finance (DOF) currently assumes in its multiyear budget estimates that the suspension will be operative starting in 2023‑24. This could change if revenue estimates increase sufficiently in the future. (Historically, the restoration was statutorily tied to the existence of the managed care organization [MCO] tax. The MCO tax expired at the end of 2018‑19. Even though the administration is continuing the 7 percent restoration for 2020‑21, the statutory language linking the restoration to the MCO tax remains.)
Medi‑Cal Expansion to Undocumented Seniors
The Governor’s budget proposes to extend full‑scope Medi‑Cal coverage to income‑eligible undocumented immigrants aged 65 years and older beginning on January 1, 2021. Given that IHSS is a service provided through full‑scope Medi‑Cal, this also would have the effect of expanding the number of people eligible for IHSS. The administration projects that IHSS caseload would increase, on average, by 968 cases in 2020‑21, increasing to roughly 4,600 cases in 2021‑22. The administration estimates the costs of this proposal to be $5.9 million in 2020‑21, increasing to $120 million in 2021‑22. While we do not raise any major concerns with the 2020‑21 caseload and costs estimates, out‑year costs could come in lower if newly eligible undocumented seniors enroll in IHSS at a slower rate than what is currently assumed by the administration.
Implementation of Paid Sick Leave
Pursuant to Chapter 4 of 2016 (SB 3, Leno), IHSS providers became eligible to receive eight hours of paid sick leave beginning in 2018‑19. The maximum amount of accrued paid sick leave hours will increase to 16 hours annually on July 1, 2020 and ultimately will increase to 24 hours annually on July 1, 2022 (after the state minimum wage reaches $15 per hour). In general, providers must first work a certain number of hours to be eligible to receive and use their paid sick leave hours. The 2020‑21 budget includes $53 million General Fund for paid sick leave costs, nearly double the estimated paid sick leave costs in 2019‑20. This largely is due to the maximum amount of accrued paid sick leave hours that a provider may be eligible to receive doubling in 2020‑21—from 8 hours in 2019‑20 to 16 hours in 2020‑21.
The budget assumes that 75 percent of IHSS providers—421,541 in 2019‑20 and 438,477 in 2020‑21—will accrue and use the maximum amount of paid sick leave. While we do not raise any major concerns at this time, paid sick leave costs could come in lower than estimated if fewer IHSS providers utilize paid sick leave or if providers use a lower than estimated amount of paid sick leave hours in 2019‑20 and 2020‑21.
Given the very limited availability of utilization data, we find these budget assumptions reasonable at this time. These estimates, however, should be revised in May when more data are available to better reflect actual utilization and paid hours of paid sick leave. We will continue to monitor paid sick leave utilization data relative to current budget assumptions and provide further comments at the time of the May Revision if necessary.
IHSS County MOE
The Governor’s budget estimates that IHSS county MOE costs will increase by $83 million, from $1.58 million in 2019‑20 to $1.67 million in 2020‑21. Counties generally pay for their share of IHSS costs with revenues from 1991 realignment. While total IHSS county MOE costs increase from 2019‑20 to 2020‑21, the IHSS county MOE is projected to offset a decreasing share of the nonfederal IHSS costs—26 percent and 24 percent, respectively. This primarily is due to recent changes made to the IHSS county MOE financing structure. Next, we discuss the recent changes to the IHSS county MOE financing structure and overall effects on state costs.
IHSS County MOE Has Evolved Over Time. Beginning in 2012‑13, the historical IHSS county share‑of‑cost model was replaced with an IHSS county MOE. In 2017‑18, the IHSS county MOE financing structure was revised, ultimately resulting in higher IHSS county MOE costs. When this change was made, realignment revenues were not enough to cover total county IHSS costs. Moreover, in January 2019, DOF released a report finding that 1991 realignment revenues would not be enough to cover IHSS county MOE costs in the long run. To address this problem, the 2019‑20 budget made a number of modifications to the IHSS county MOE, including rebasing the IHSS county MOE costs to a lower amount in 2019‑20—from $2 billion to $1.5 billion—and lowering the annual adjustment factor from up to 7 percent to 4 percent. (The new IHSS county MOE would still increase annually by the counties’ share of costs from locally established wage increases.) The changes to the MOE resulted in better aligning county IHSS costs with realignment revenue. Overall, these changes shifted, on net, roughly $300 million of what otherwise would have been county costs to the state in 2019‑20, increasing to roughly $550 million in 2022‑23. (For more information on these changes, please refer to The 2019‑20 Budget: Assessing the Governor’s 1991 Realignment Proposals and The 2019‑20 May Revision: Update to the Governor’s 1991 Realignment Proposals.)
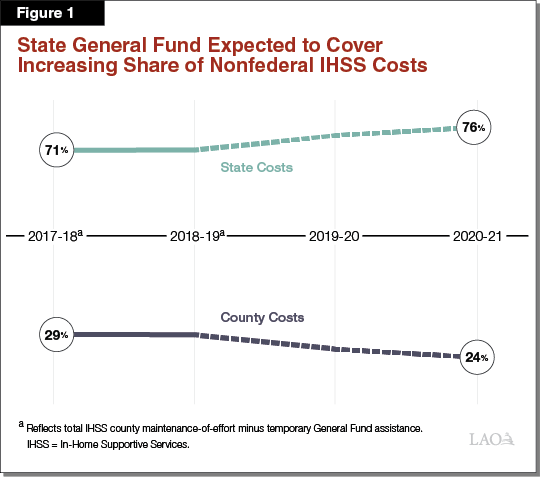
State Costs Expected to Increase More Over Time Due to Recent Change in IHSS County MOE. While the change to the IHSS county MOE in 2019‑20 alleviated some IHSS‑related costs pressures for counties, it did so by increasing costs pressures experienced by the state. As a result, the state is expected to cover a larger share of nonfederal IHSS costs over time. As shown in Figure 1, the IHSS county MOE accounted for 29 percent of total nonfederal IHSS costs in 2017‑18 and 2018‑19, with the state covering the remaining 71 percent. However, the budget estimates the counties’ share of costs will decrease to 26 percent in 2019‑20 and 24 percent in 2020‑21, resulting in the state’s share of cost increasing over time—74 percent in 2019‑20 and 76 percent in 2020‑21. Overall, the fact that the IHSS county MOE is offsetting a decreasing share of IHSS nonfederal costs is a key reason why the year‑to‑year increase in state IHSS costs (16 percent) is greater than the growth in total IHSS costs (13 percent).
Update on IHSS Collective Bargaining Provisions. Budget‑related legislation enacted in 2017‑18 temporarily provided counties and unions the ability to appeal to the Public Employment Relations Board (PERB) if a bargaining agreement over IHSS provider wages and benefits had not been reached by January 1, 2018. As a part of the 2019‑20 budget, this provision was extended to counties and unions that had not reached a bargaining agreement on or after October 1, 2019. Additionally, a county may be subject to financial penalties if an agreement is not reached under certain conditions—such as if an agreement is not reached following the completion of the fact‑finding process that issues recommended settlement terms that favor unions more than counties. We understand that, thus far, one county has been subject to a withholding of 1 percent of 1991 realignment funds. These provisions are set to expire by January 1, 2021.
SSI/SSP
The SSI/SSP program provides cash grants to low‑income aged, blind, and disabled individuals. The state’s General Fund provides the SSP portion of the grant while federal funds pay for the SSI portion of the grant. Total spending for SSI/SSP grants is estimated to remain relatively flat at $9.7 billion in 2019‑20 and 2020‑21. This largely is due to the effects of estimated caseload decline (1.8 percent in 2020‑21) being partially offset by increased federal expenditures resulting from the estimated annual increases to the federal SSI grant. Of this total, the Governor’s budget proposes about $2.7 billion from the General Fund in 2020‑21, which is $44 million less than updated 2019‑20 General Fund cost estimates.
Background on SSI/SSP Grants
Both the State and Federal Government Contribute to SSI/SSP Grants. Grant levels for SSI/SSP are determined by both the federal government and the state. The federal government, which funds the SSI portion of the grant, is statutorily required to provide an annual cost‑of‑living‑adjustment (COLA) each January. This COLA increases the SSI portion of the grant by the Consumer Price Index for Urban Wage Earners and Clerical Workers (CPI‑W). In years that the CPI‑W is negative (as was the case in 2010, 2011, and 2016), the federal government does not decrease SSI grants, but instead holds them flat. The state has full discretion over whether and how to provide increases to the SSP portion of the grant. Until 2011, the state had a statutory COLA. Despite the state statutory COLA, there were many years when the COLA was not provided due to budget constraints. As part of the 2016‑17 budget package, the Legislature provided a COLA of 2.76 percent on the SSP portion of the grant, the first since 2005. The Governor’s 2020‑21 budget proposal does not include an increase to the SSP portion of the grant. The 2018‑19 budget included legislation to provide future annual COLAs to the SSP portion of the grant beginning in 2022‑23, to the extent that funding is provided in future budget years. Currently, DOF’s multiyear budget projections do not include funding for a COLA to the SSP grant in 2022‑23 and onwards. We estimate that the cost of providing the SSP COLA in 2022‑23 (based on an estimated California Necessities Index of 2.8 percent) would be roughly $70 million.
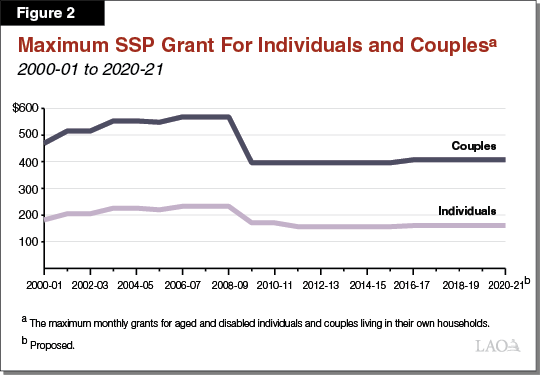
During Constrained Budget Environment, SSP Grants for Individuals and Couples Reduced to Federally Required Minimum. The state is required to maintain SSP monthly grant levels at or above the levels in place in March 1983 ($156.40 for SSP individual grants and $396.20 for SSP couple grants) in order to receive federal Medicaid funding. As shown in Figure 2, during the most recent recession, the state incrementally decreased SSP grants for individuals and couples until they reached these minimum levels in June 2011 and November 2009, respectively. Since these reductions, SSP grants for individuals and couples have only been increased once—in 2016‑17, as described earlier.
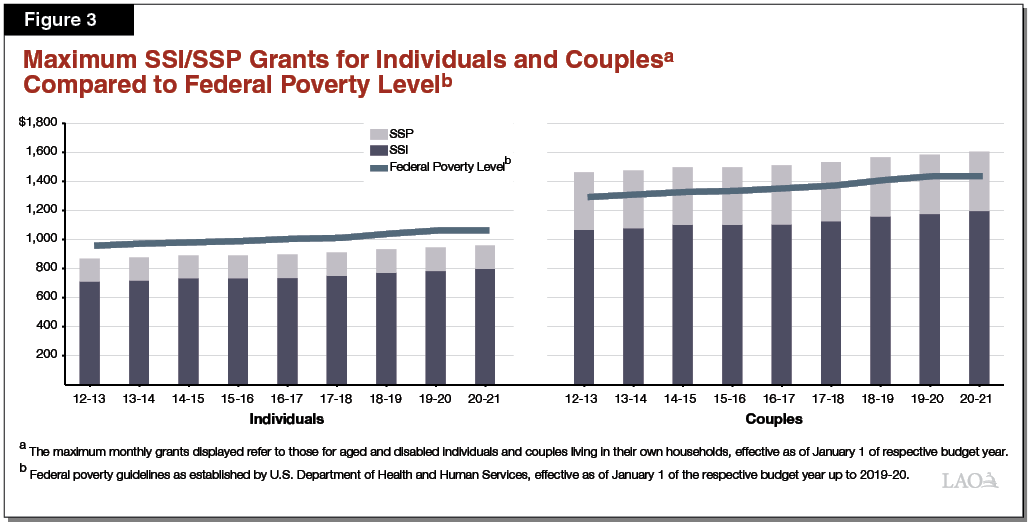
Total Grants Have Been Gradually Increasing Largely Due to Federal COLAs, but Remain Below FPL for Individuals. As shown in Figure 3, the maximum SSI/SSP monthly grant amount for individuals (the bulk of the SSI/SSP caseload) and couples have been increasing gradually since 2011‑12—predominantly due to the provision of federal COLAs. Despite these increases, however, current maximum SSI/SSP grant levels for individuals remain below the federal poverty level (FPL), while grant levels for couples remain just above the FPL.
Governor’s Budget Estimates
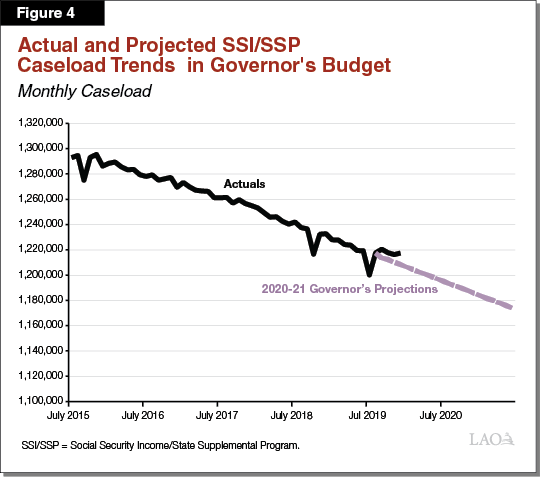
Caseload Slightly Decreasing. The SSI/SSP caseload grew at a rate of less than 1 percent each year between 2011‑12 and 2014‑15. Beginning in 2015‑16, however, SSI/SSP caseload began to slowly decline at an average rate of 1.4 percent each year. Figure 4 shows the budget projects that caseload will decrease annually by 1.8 percent in 2019‑20 and 2020‑21, which generally aligns with past caseload trends. While we do not raise any major concerns at this time, based on recent actual monthly caseload data, caseload likely could be slightly higher in 2019‑20 than current budget projections. Typically, these estimates are revised in May when a greater amount of data is available to better reflect actual caseload. We will continue to monitor SSI/SSP caseload data relative to current budget assumptions and provide further comments at the time of the May Revision if necessary.
Federal SSI Grant Increase. As shown in Figure 5, the Governor’s budget estimates that the CPI‑W that the federal government will use to adjust the SSI portion of the grant in 2021 will be 1.7 percent, increasing the maximum monthly SSI/SSP grant by $14 for individuals and $20 for couples. This is roughly the same as our estimate of the CPI‑W (1.8 percent). (The actual CPI‑W will not be known until the fall.) The expected increase to the SSI portion of the grant in 2021 is relatively the same as the 2020 grant increase (based on 1.6 percent CPI‑W), but less than the 2019 grant increase (based on 2.8 percent CPI‑W).
Figure 5
SSI/SSP Monthy Maximum Grant Levelsa Governor’s Proposal
|
2019‑20 |
2020‑21 Governor’s Estimatesb |
Change From 2019‑20 |
|
|
Maximum Grant—Individuals |
|||
|
SSI |
$783.00 |
$797.00 |
$14.00 |
|
SSP |
160.72 |
160.72 |
— |
|
Totals |
$943.72 |
$957.72 |
$14.00 |
|
Percent of Federal Poverty Levelc |
89% |
90% |
|
|
Maximum Grant—Couples |
|||
|
SSI |
$1,175.00 |
$1,195.00 |
$20.00 |
|
SSP |
407.14 |
407.14 |
— |
|
Totals |
$1,582.14 |
$1,602.14 |
$20.00 |
|
Percent of Federal Poverty Levelc |
110% |
112% |
|
|
aThe maximum monthly grants displayed refer to those for aged and disabled individuals and couples living in their own households, effective as of January 1 of the respective budget year. bReflects Governor’s budget estimate of the January 2021 federal cost‑of‑living adjustment for the SSI portion of the grant. cCompares grant level to federal poverty guidelines from the U.S. Department of Health and Human Services for 2020. |
|||
CalWORKs
Background
The CalWORKs program was created in 1997 in response to the 1996 federal welfare reform legislation that created the federal Temporary Assistance for Needy Families (TANF) program. CalWORKs provides cash grants and job services to low‑income families. The program is administered locally by counties and overseen by DSS.
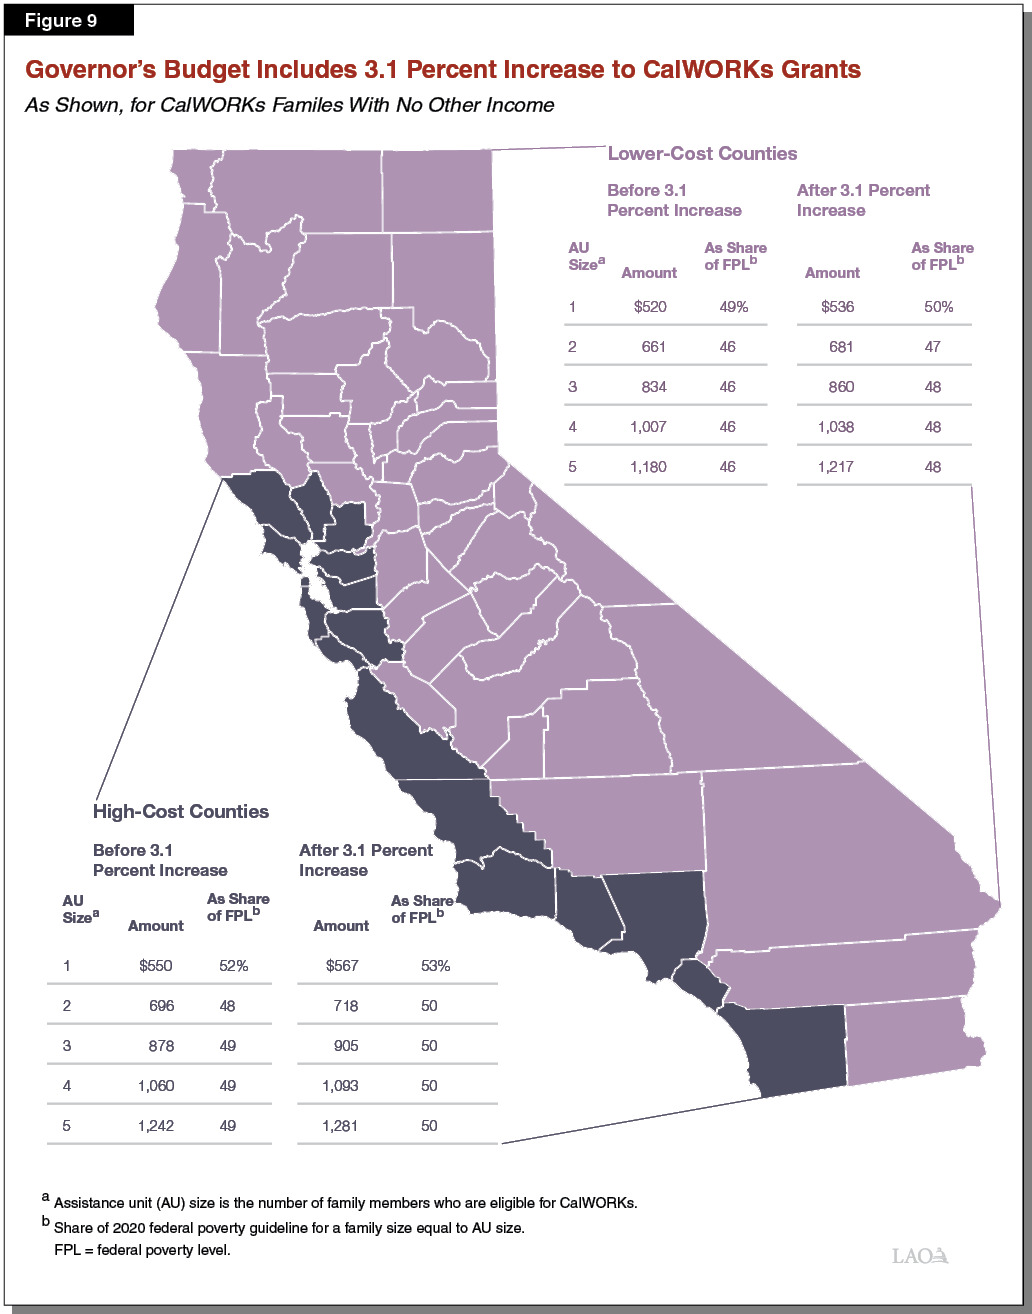
CalWORKs Provides Cash Assistance to Low‑Income Families. Grant amounts generally are adjusted for family size, income level, and region. Recipients in high‑cost counties receive grants that are 4.9 percent higher than recipients in lower‑cost counties. As an example, a family of three in a high‑cost county that has no other earned income currently receives $878 per month, whereas a similar family in a lower‑cost county receives $834 per month. In 2019‑20, the administration estimates the average CalWORKs grant amount to be $689 per month across all family sizes and income levels. These grants are funded through a combination of federal TANF block grant funding, state General Fund, and county dollars. Families enrolled in CalWORKs typically are also eligible for CalFresh food assistance and Medi‑Cal health coverage.
State, Federal Law Require Most Adults Receiving CalWORKs Assistance to Work or Participate in Employment Services. As a condition of receiving CalWORKs, adults generally are required to be employed or to participate in job search and readiness training. People who are enrolled in these activities also may receive services to help them meet these requirements, including subsidized child care, reimbursement for transportation, and housing assistance. Housing assistance may include short‑term vouchers, rental deposits, and long‑term subsidized housing. Adults who do not meet the work participation requirements of the program may be sanctioned. Sanctioned adults are temporarily ineligible to receive cash assistance, meaning grants for these families are reduced by about $100 to $200 per month until the sanction is addressed.
Adults Generally Limited to 48 Months of CalWORKs Cash Assistance. When CalWORKs was first established, adults in the program could collect cash assistance for a total of 60 months (the maximum allowed for recipients of federal TANF funding). Starting in 2011, California reduced this to a 48‑month time limit. This change was one of several made during the most recent recession to reduce the state’s program costs at a time when CalWORKs caseload was at a historic high (about 585,000 cases, or about 60 percent more than in 2019‑20). Adults who exceed the time limit are no longer included as part of the CalWORKs case for purposes of determining the family’s grant amount. (Children and other eligible adults in these families continue to receive assistance.) This has the effect of reducing the family’s monthly grant amount, typically by about $100 to $200 per month for each ineligible member.
In More Than Half of Cases, Family Size Differs From CalWORKs Assistance Unit Size. Monthly CalWORKs grant amounts are set according to the size of the assistance unit (AU). The size of the AU is the number of CalWORKs‑eligible people in the household. Grant amounts are adjusted based on AU size—larger AUs are eligible to receive a larger grant amount—to account for the increased financial needs of larger families. In about 40 percent of CalWORKs cases, everyone in the family is eligible for CalWORKs and therefore the AU size and the family size are the same. In the remaining 60 percent of cases, though, one or more people in the family are not eligible for CalWORKs and therefore the AU size is smaller than the family size.
Family Members May Be Ineligible for CalWORKs for Several Reasons. Most commonly, people are ineligible for CalWORKs because they (1) have exceeded the 48‑month time limit, (2) are currently sanctioned for not meeting the work participation requirements, or (3) are receiving SSI/SSP benefits (state law prohibits individuals from receiving both SSI/SSP and CalWORKs). Additionally, individuals may be ineligible due to their immigration status. Undocumented immigrants, as well as most immigrants with legal status who have lived in the United States for fewer than five years, are ineligible for CalWORKs.
Federal, State, and County Governments Share CalWORKs Costs. Federal law allows for a degree of state flexibility in the use of federal TANF funds. The state receives $3.7 billion annually for its TANF block grant, about $2 billion of which goes to CalWORKs (an additional $1 billion helps fund student aid and the remainder helps fund a variety of smaller human services programs). To receive its annual TANF block grant, the state must spend an MOE amount from state and local funds to provide services for families eligible for CalWORKs. This MOE amount is $2.9 billion. State and federal CalWORKs funding generally is allocated to counties which directly serve eligible families. In addition to funding for cash grants, counties receive several other funding allocations to administer and operate CalWORKs. The main funding allocation—known as the “single allocation”—currently funds employment services, eligibility determination and administrative costs, and child care subsidies.
Under State Law, Local Revenue Growth Automatically Triggers CalWORKs Grant Increases. Following a major realignment of state and local responsibilities in 1991, some funds generated by the state sales tax and vehicle license fee accrue to a special fund with a series of subaccounts which pay for a variety of health and human services programs. Under state law, sufficient revenue growth in the Child Poverty and Family Supplemental Support Subaccount triggers an increase in CalWORKs cash grant amounts. In the past, this account funded grant increases of 5 percent in 2013‑14 and 2014‑15 and of 1.43 percent in 2016‑17, as well as funding the repeal of the maximum family grant policy starting in 2016‑17.
2019‑20 Budget Act Made Several Changes to CalWORKs Program. Among the most notable changes made to CalWORKs in the most recent budget are:
- Increased cash grants beginning in October 2019 at an estimated cost of $331.5 million in 2019‑20. This increase was designed to bring the grant amount for all AUs of one to at least 50 percent of the 2019 FPL for households of one.
- Increased the earned income disregard (or the amount families can earn before further income reduces their grant amounts) from $225 to $500 per month starting in June 2020.
- Increased the value of assets a family can possess and remain eligible for CalWORKs from $2,250 to $10,000, and increased the separate limit on the value of family automobiles from $9,000 to $25,000 starting in June 2020.
- Changed the way the state funds counties for CalWORKs employment services.
- Increased funding for and made permanent the CalWORKs Home Visiting program.
- Granted greater flexibility for CalWORKs families to access Homeless Assistance benefits (emergency funding intended to prevent families from experiencing homelessness).
CalWORKs Caseload Continues Historic Decline
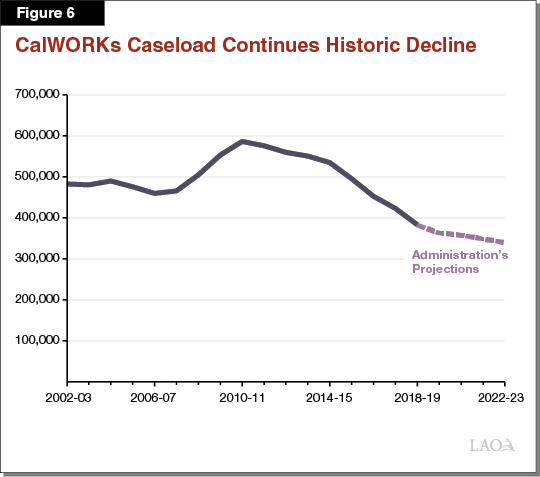
Fewer People Participating in Program Than at Any Point in Its History. The number of families in California receiving cash assistance declined rapidly following federal welfare reform in 1996, largely as a result of new time limits on receiving aid and the requirements that most adults receiving aid participate in work‑related activities. Figure 6 shows CalWORKs caseload settled at approximately 480,000 families following this transition and the economic expansion of the mid‑2000s. Caseload then increased during the Great Recession, peaking at 585,000 families during 2010‑11. The caseload has since declined every year, and the administration estimates it will drop further to 358,000 in 2020‑21.
Low Caseload Due Primarily to Economic, Demographic Factors. Our office forecasts CalWORKs caseload using three factors: (1) current economic conditions, (2) economic conditions over the last two years, and (3) the number of Californians ages 0‑18. Lower unemployment rates are linked to lower CalWORKs caseloads, and California’s unemployment rate (3.9 percent in December 2019) is at its historic low. Further, we find high numbers of initial jobless claims are linked to increases in CalWORKs caseload on about a two‑year lag (this could be because many of the recently unemployed only turn to CalWORKs after exhausting all other options), and initial jobless claims have been very low in California for many years. Finally, there are fewer Californians under the age of 18 now than in other recent years, largely because California’s birth rates are at a historic low. Because only families with minor children are eligible for CalWORKs assistance, fewer children generally means fewer CalWORKs cases.
Caseload Decline Expected to Continue in Short Term, but Long‑Term Floor Unknown. Both our office and the administration assume the caseload decline will continue through at least 2020‑21 and likely longer. In the event of a recession, we anticipate caseload would increase in line with increased unemployment, and likely would remain high for several years even after the economy recovers. Should the expansion continue, we anticipate some families will continue to receive CalWORKs assistance either due to a temporary financial crises or because one or more adult family members struggle with substantial barriers to long‑term employment—such as mental health challenges, substance use, domestic violence, or other issues causing family instability. Because these factors are somewhat independent of the overall economy, continued expansion is unlikely to ever drive the CalWORKs caseload to zero. Consequently, we expect the CalWORKs caseload to reach a “floor” at some point, but are uncertain when that will occur.
Budget Overview
Total CalWORKs Spending Projected to Increase as a Result of 2019‑20 Changes. As shown in Figure 7, the Governor’s budget proposes $5.5 billion in total funding for the CalWORKs program in 2020‑21, a net increase of $169 million (3 percent) relative to the most recent estimate of current‑year spending. This increase is the net effect of higher spending on cash grants (due to recent and proposed increases in grant levels and other policies included in the 2019‑20 Budget Act) offset somewhat by lower underlying costs that result from declining year‑over‑year caseload.
Figure 7
CalWORKs Budget Summary
All Funds (Dollars in Millions)
|
2019‑20 Revised |
2020‑21 Proposed |
Change From 2018‑19 |
||
|
Amount |
Percent |
|||
|
Number of CalWORKs Cases |
$363,095 |
$358,086 |
‑$5,009.0 |
‑1% |
|
Cash Grants |
3,031 |
3,183 |
152.0 |
5 |
|
Single Allocation |
||||
|
Employment services |
$851 |
$832 |
‑$18.5 |
‑2% |
|
Cal‑Learn case management |
26 |
32 |
5.9 |
23 |
|
Eligibility determination and administration |
579 |
585 |
5.9 |
1 |
|
Subtotals |
($1,456) |
($1,449) |
(‑$6.6) |
(—) |
|
Stage 1 Child Carea |
$320 |
$333 |
$12.7 |
4 |
|
Home Visiting Initiative |
90 |
117 |
28.0 |
31 |
|
Other County Allocations |
412 |
405 |
‑8.0 |
‑2 |
|
Otherb |
23 |
14 |
‑9.0 |
‑39 |
|
Totals |
$5,331 |
$5,500 |
$169.0 |
3% |
|
aIn 2019‑20 and prior years, this was included in the single allocation. Starting in 2020‑21, it is a separate allocation. We present it as a separate line item in both years for ease of comparison. bPrimarily includes various state‑level contracts. |
||||
General Fund Accounts for Small, but Growing, Share of CalWORKs Costs. Figure 8 shows how CalWORKs costs are shared between federal, state, and local revenue sources. The budget proposes a notable increase in the amount of General Fund going towards CalWORKs (77 percent), although the General Fund still accounts for a fairly small share of overall program costs (17 percent). This increase reflects the cumulative cost of several policy changes made over the last several years (previously those costs were borne in part using one‑time carryover of federal funds).
Figure 8
CalWORKs Funding Sources
(Dollars in Millions)
|
2019‑20 Revised |
2020‑21 Proposed |
Change From 2019‑20 |
||
|
Amount |
Percent |
|||
|
Federal TANF block grant funds |
2,263 |
$1,982 |
‑$281 |
‑12% |
|
State General Fund |
516 |
913 |
396 |
77 |
|
Realignment and other county fundsa |
2,552 |
2,605 |
53 |
2 |
|
Totals |
$5,331 |
$5,500 |
$169 |
3% |
|
aPrimarily various realignment funds, but also includes county share of grant payments, about $60 million. TANF = Temporary Assistance for Needy Families. |
||||
Budget Includes 3.1 Percent Grant Increase Triggered by Local Revenue Growth. The administration estimates a budget‑year cost of $73 million (annual cost of $97 million) to fund a 3.1 percent increase to cash grants starting in October 2020. This increase was triggered and will be funded by revenue growth in the Child Poverty and Family Supplemental Subaccount. Figure 9 shows this increase would raise grants for all AU sizes in high‑cost counties to at or above 50 percent of the 2020 FPL (assuming household size equals AU size), whereas grants for most AU sizes in lower‑cost counties would remain somewhat below 50 percent of the FPL. (As part of the 2018‑19 Budget Act, the Legislature set a goal to increase CalWORKs grants to 50 percent of the FPL for a family that is one person larger than the AU size, a considerably higher target than would be reached in 2020‑21 under the Governor’s budget.)
Administration’s Caseload Forecast Appears Reasonable. The Governor’s budget updates previous caseload projections and assumes that an average of 363,095 families will receive CalWORKs assistance each month during 2019‑20. This updated projection reflects a 5.3 percent decline relative to 2018‑19 and is 0.3 percent lower than the level assumed in the 2019‑20 Budget Act. The Governor’s budget further projects that an average of 358,086 families will receive CalWORKs assistance each month during 2020‑21, a year‑over‑year decline of about 1.4 percent. Although the continued rate of caseload decline appears reasonable, more data will be available for us to fully assess the estimate for the May Revision.
Budget Begins Process of Major Child Care Reorganization. The budget includes $6.8 million to the California Health and Human Services Agency to establish a new Department of Early Childhood Development, which would oversee a number of existing child care programs including CalWORKs Stage 1 (currently overseen by DSS) and CalWORKs Stages 2 and 3 (currently overseen by the California Department of Education). Under the Governor’s proposal, these programs would remain at their current departments until 2021‑22, when they would be shifted to the new department. (We will describe and assess this proposal in detail in our report The 2020‑21 Budget: Early Education Analysis.)
Continuum of Care Reform
California’s child welfare services (CWS) system serves to protect the state’s children from abuse and neglect, often by providing temporary out‑of‑home placements for children who cannot safely remain in their home, and services to safely reunify children with their families. Beginning in 2012, the Legislature passed a series of legislation implementing CCR. This Legislative package makes fundamental changes to the way the state cares for youth in the foster care system. The state pays for the net costs of CCR, which include upfront implementation costs. While not a primary goal, the Legislature enacted CCR with the expectation that reforms eventually would lead to overall savings to the foster care system, resulting in CCR ultimately becoming cost neutral to the state. This analysis (1) provides background and implementation updates for the major changes underway as a result of CCR, (2) outlines the Governor’s proposed budget for CCR in 2020‑21, and (3) provides key questions and issues for the Legislature to consider as it evaluates the budget proposal.
CCR Background
CCR aims to achieve a number of complementary goals including: (1) ending long‑term congregate care placements; (2) increasing reliance on home‑based family placements; (3) improving access to supportive services regardless of the kind of foster care placement a child is in; and (4) utilizing universal child and family assessments to improve placement, service, and payment rate decisions. In this section, we first highlight some of the key issues CCR is intended to address and then discuss some of the major changes underway as a result of CCR. (We note that the changes we highlight are not an exhaustive accounting of all CCR changes, but are those most relevant for understanding the Governor’s 2020‑21 budget proposal for CCR.)
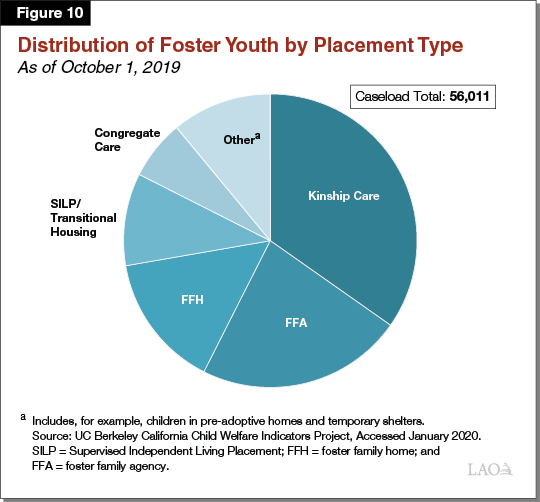
Types of Out‑of‑Home Placements for Foster Youth. Counties—which carry out the day‑to‑day child welfare activities for the state—historically have relied on various placement types for foster youth—kinship care, foster family homes (FFHs), foster family agencies (FFAs), and congregate care. (For this analysis, we refer to kinship care, FFHs, and FFAs as Home‑Based Family Care [HBFC].) The nearby box explains these placement types in more detail. Figure 10 illustrates the distribution of foster youth across these various placements as of October 2019.
Home‑Based Family Care (HBFC)
Kinship Care. Established child welfare policy and practice in the state prioritizes placement with a noncustodial parent or relative. Kinship care comprises care from relatives and nonrelative extended family members, and is a unique foster care placement type in multiple respects. For example, unlike other placement types, kin caregivers can take in foster youth on an emergency basis before being fully approved by counties as foster caregivers.
Foster Family Homes (FFHs). County‑licensed foster homes, known as FFHs, are often the preferred placement option when a suitable kin caregiver cannot be found and the child does not have needs requiring a higher level of services. Counties recruit FFH caregivers and provide basic social work services to foster youth in this placement type.
Foster Family Agency (FFA) Homes. FFAs do not directly house the youth under their care. Rather, FFAs are private, nonprofit agencies that recruit and approve foster caregivers, place youth into FFA‑supervised foster homes, and provide supportive services to the youth in their care—typically youth with elevated needs compared to those placed in FFHs.
Congregate Care
Congregate care includes group homes and Short‑Term Residential Therapeutic Programs (STRTPs). Operated as private, nonprofit agencies, group homes and STRTPs provide 24‑hour care, supervision, and services to foster youth with the highest levels of need, often youth whose significant emotional or behavioral challenges can make it difficult for them to successfully remain in home‑based family foster care settings. Professional staff, as opposed to a parent‑like foster caregiver, provide care and supervision to youth in group homes and STRTPs. Group homes and STRTPs are considered the most restrictive, least family‑like foster care setting, and are generally the least preferred placement option. Under Continuum of Care Reform (CCR), STRTPs are expected to replace group homes eventually as the permissible congregate care placement setting for CWS‑supervised foster youth who need intensive services that are unavailable in an HBFC setting. (We discuss the differences between group homes and STRTPs further in the “Major Changes Under CCR” section of this analysis.)
Transitional and Independent Living Placements
In recent years, counties increasingly have relied upon supervised independent living placements (SILPs) and transitional housing placements instead of HBFC placements or congregate care settings for older, relatively more self‑sufficient youth. SILPs are independent settings, such as apartments or shared residences, where nonminors who remain in the foster care system past their 18th birthday may live independently and continue to receive monthly foster care payments. Transitional housing placements provide foster youth ages 16 to 21 supervised housing as well as supportive services, such as counseling and employment services, that are designed to help foster youth achieve independence.
Impetus for CCR
Congregate Care Placements Are Costly and Associated With Poor Outcomes for Children. Congregate care placements can cost more than $13,000 per child per month depending on the level of care provided. In contrast, foster care payments for home‑based family settings generally range from $1,000 per child per month for relative and FFH placements to over $2,700 per child per month for FFA placements. (Some home‑based placements for youth who require intensive services can receive grant payments of over $6,300.) Moreover, long‑term stays in congregate care are associated with elevated rates of reentry into foster care, lower educational achievement, and higher rates of involvement in the juvenile justice system. (Given youth placed in congregate care may have higher needs, however, determining whether congregate care placements themselves directly lead to these poor outcomes is difficult.) Recognizing the above shortcomings associated with congregate care, CCR aims to end long‑term congregate care placements.
Concerns About the Availability and Capacity of Home‑Based Family Placements. Reducing reliance on congregate care placements has been a priority for the state for some time. A major challenge to achieving this goal has been an inadequate supply of home‑based family placements suitable for youth with elevated needs. Additionally, historically, the mental health and other supportive services to help home‑based family caregivers care for youth with elevated needs have not been accessible at all home‑based family placement types. Improving the capacity and availability of home‑based family placements is a principal goal under CCR. In addition, CCR aims to make mental health and other supportive services more accessible to youth in home‑based placements.
Major Changes Under CCR
CCR Created a New Placement Type
STRTPs Replace Group Homes for CWS‑Supervised Foster Children. As described earlier, foster youth can receive care in various settings, depending on their needs. Given the aforementioned concerns about group homes, a key goal of CCR is to end group homes as a placement option for CWS‑supervised foster youth. Under CCR, Short‑Term Residential Therapeutic Programs (STRTPs) are expected to replace group homes as the permissible placement setting for youth who cannot safely and stably be placed in home‑based family settings, providing a similar level of supervision as group homes, but with expanded services and supports. In addition, CCR aims to reduce the overall number of placements in STRTPs by increasing services available for home‑based placements.
STRTPs are intended to provide exclusively short‑term, intensive treatment and other services facilitating youth’s transition to a family setting as quickly and successfully as possible. As a result of the shorter expected durations of stay in STRTPs, as well as reducing the number of STRTP placements (as compared to group homes), STRTP capacity statewide (number of beds) will be lower than statewide group home placement capacity prior to CCR.
CCR restricts STRTP placements to youth who have been assessed as requiring the high level of behavioral and therapeutic services that STRTPs are required to provide. Children whose level of need may qualify them for STRTP placement include, among others, those assessed as having a serious mental illness and victims of commercial sexual exploitation.
CCR Establishes a New Foster Care Payment Rate Structure
CCR Foster Care Payment Rates to Vary Based on Children’s Needs. Until January 2017, the state’s foster care payment rates primarily varied by age for youth in HBFC. For example, a foster caregiver caring for a child below age 5 would receive a monthly payment of around $700 while a foster caregiver caring for a child over age 14 would receive around $900. Under the foster care payment rate structure envisioned under CCR, rates vary by the youth’s level of need as determined by a statewide “level of care” (LOC) assessment tool, which we describe later in this analysis.
There are five payment rates under CCR’s HBFC payment rate structure, each with a corresponding LOC. LOC 1 (basic rate) represents the lowest level of care and corresponds with the lowest payment rate. Intensive Services Foster Care (ISFC)—a level of care above LOC 4—represents the highest level of care for home‑based family settings and comes with the highest payment rate. In addition to changing the basic structure of foster care payment rates, the HBFC basic rate generally is higher than the basic rate prior to CCR. Unlike the rate structure that governed group home payment rates—which differentiated group home payment rates by the level of care and supervision that different group homes provided—under CCR, there is a single monthly payment rate paid for all STRTP‑placed youth. Figure 11 summarizes payment rates under CCR for the current year. (We note that these rates have been only partially implemented. We discuss continued delays in full implementation of this rate structure later on in this update.)
Figure 11
2019‑20 Level of Care‑Based Foster Care Payment Rates
Per Child Per Month Rates
|
HBFC Level of Care |
1 |
2 |
3 |
4 |
ISFC |
|
County‑Supervised Foster Family Homes |
$1,000 |
$1,112 |
$1,225 |
$1,337 |
$2,609 |
|
Foster Family Agency (FFA) placements |
|||||
|
Foster caregivers |
$1,000 |
$1,112 |
$1,225 |
$1,337 |
$2,609 |
|
Services and administration (retained by FFA) |
1,266 |
1,312 |
1,358 |
1,440 |
3,682 |
|
Total Payment for a Child Placed in an FFA Home |
$2,266 |
$2,424 |
$2,583 |
$2,777 |
$6,291 |
|
STRTP |
$13,532 |
||||
|
ISFC = Intensive Services Foster Care and STRTP = Short‑Term Residential Therapeutic Program. |
|||||
Assessment Tool Used to Determine Rate for Each Child. DSS developed an LOC assessment tool to determine the foster care payment rate that caregivers will receive. The assessment is designed to identify the care needs of a foster child and to translate those care needs into an appropriate foster care payment rate. We note that, due to concerns with the tool, the LOC tool and rate structure has been only partially implemented.
CCR Aims to Expand Access to Mental Health and Other Supportive Services
Improving foster youth’s access to mental health services has been a longstanding goal of the state. CCR builds on these efforts by requiring STRTPs to provide specialty mental health services to resident foster youth. In addition, FFAs are required to ensure access to mental health services for the foster youth they supervise either by providing the services themselves or contracting with mental health service providers to do so on their behalf. On top of aiming to improve access to mental health services, CCR mandates that certain other “core services” be made available to foster youth. These core services include permanency services to help foster youth reunify with their parents or, alternatively, secure permanency through guardianship or adoption.
CCR Changed the Caregiver Approval and Placement Processes
Resource Family Approval (RFA) Replaced the Previous Approval, Licensing, and Certification Processes for Home‑Based Family Caregivers. Before foster caregivers may begin providing care and receiving foster care payments, they must be approved to provide care. (Although in the case of kinship placements, relative caregivers may begin providing care for a child and obtain temporary grant funding while their application is processed.) Prior to CCR, the approval process differed by placement type—for example, nonrelative caregivers were licensed according to one set of criteria while relative caregivers were approved under a different set of criteria. CCR replaced the multiple approval standards with a single, more comprehensive approval process that incorporates features included in assessments for prospective adoptive parents (such as a psychosocial assessment). Because RFA is a more comprehensive approval process, completing the process is intended to qualify a foster caregiver for guardianship and adoption. CCR legislation required all new prospective foster caregivers to complete the RFA process beginning in January 2017. Obtaining RFA is required of all existing foster caregivers by the end of December 2020 in order for them to continue to serve as foster caregivers.
More Collaborative Placement and Service Decisions Through the Use of Child and Family Teaming. To increase child and family involvement in decisions relating to foster youth’s care, CCR mandates the use of child and family “teaming” through every stage of the case planning and service delivery process. The child and family team (CFT) may include, as deemed appropriate, the affected child, her or his custodial and noncustodial parents, extended family members, the county caseworker, representatives from the child’s out‑of‑home placement, the child’s mental health clinician, and other persons with a connection to the child. The CFT is required to meet at least once every six months (or once every 90 days for youth receiving specialty mental health services) to discuss and agree on the child’s placement and service plan.
Functional Assessment Tool Used to Inform Placement and Service Decisions. CCR requires foster youth to receive a comprehensive strengths and needs assessment upon entering the child welfare system in order to improve placement decisions and ensure access to necessary supportive services. In late 2017, the Child and Adolescent Needs and Strengths (CANS) tool was chosen by DSS as the state’s functional assessment tool to be used within the CFT process and was gradually rolled out for use across the counties. The tool is used only to inform the placement and care decisions of the CFT. It is administered separately from the LOC assessment tool—which is to be used in determining foster care payment rates—as discussed earlier in this analysis.
CCR Funding
State Provides Funding for Net Costs of CCR. As a result of 2011 realignment—described more fully in the nearby box—counties are only required to implement new state CWS policies to the extent that the state provides funding to cover the new policies’ costs. CCR creates new costs for counties, for example, in the form of higher administrative costs, while also potentially generating eventual savings for counties as the proportion of foster youth in costly placements such as congregate care placements decreases. As counties implement the various components of CCR, the state provides them up front with the estimated costs of roll out. Once CCR is fully implemented, the state has agreed with counties to fund CCR’s net costs on a county‑by‑county basis. That is, the state will fund the difference between (1) the new costs that CCR creates on a county and (2) any savings that CCR generates for that same county. The state will continue to fund counties’ CCR activities until each county’s CCR‑related savings equal or exceed its CCR costs. The state will not recoup from counties any CCR‑related savings that exceed counties’ CCR‑related costs. (We understand that the state and counties are in the process of finalizing a methodology to track CCR’s overall ongoing net costs for counties in order to identify the amount of state funding needed, if any, to pay for CCR on an ongoing basis.)
Realignment
2011 Realignment Revenues Major Source of CWS Funding. Until 2011‑12, the state General Fund and counties shared significant portions of the nonfederal costs of administering child welfare services (CWS), including foster care. In 2011, the state enacted legislation known as 2011 realignment, which dedicated a portion of the state’s sales tax to counties to administer CWS.
As a result of Proposition 30 (2012), under 2011 realignment, counties either are not responsible or only partially responsible for CWS programmatic cost increases resulting from federal, state, and judicial policy changes. Proposition 30 protects counties by establishing that counties only need to implement new state policies that increase overall program costs to the extent that the state provides the funding. Counties are responsible, however, for all other increases in CWS costs—for example, those associated with rising caseloads. Conversely, if overall CWS costs fall, counties retain those savings.
Federal Funds Also Help Support Foster Care. Funding for various child welfare services, including some foster care services, stems from several federal sources in addition to the state and county funds described previously. In many cases, counties may use federal TANF and Title IV‑E dollars to help pay for foster care payments and some other services related to foster care.
CCR Eventually Expected to Result in Savings Due to Caseload Movement. In addition to generating some higher county costs, CCR is expected to result in offsetting savings for counties. As previously discussed, CCR aims to shorten foster youth’s lengths of stay in congregate care, reduce the number of youth ever placed in congregate care, and provide greater resources to home‑based family placements in order to improve their stability. To the extent that CCR succeeds in reducing the number of foster youth in more costly congregate care placements in favor of less costly placement settings, such as HBFC settings, counties are expected to experience offsetting savings.
Update on CCR Implementation in 2019‑20
In this section, we describe CCR implementation progress and challenges over the past fiscal year. For more detail about CCR implementation in prior years, refer to our 2018‑19 and 2019‑20 human services budget briefs. (The updates we highlight are not an exhaustive accounting of all CCR progress, but are those most relevant for understanding the Governor’s 2020‑21 budget proposal for CCR.)
RFA
Timeliness of RFA Process Has Improved, but Still Misses Target. CCR legislation generally directs RFA to be completed within 90 days of application. In practice, a majority of RFA applications have been taking longer than 90 days to process. These RFA delays could present an obstacle to successful CCR implementation because the goal of placing as many foster youth as possible in family care settings necessitates that resource families are identified and approved in a timely manner. To help RFA processing times, the Legislature approved one‑time funds in the 2019‑20 Budget Act for counties to address their RFA backlogs. Specifically, the 2019‑20 budget provided county welfare agencies and probation departments $25.9 million ($17.9 million General Fund) to assist with implementing RFA, in addition to $6.7 million ($4.7 million General Fund) in one‑time funding explicitly to address the backlog. As of the third quarter of 2019 (the most recent period for which data was available), the median RFA processing time was 120 days, and more than 3,000 resource families were approved by counties each quarter during each of the six most recent quarters. While processing times still exceed the target 90 days, this is a marked improvement from the peak median processing time of 176 days in early 2018.
Additional Funding for Placements Prior to Approval. Chapter 35 of 2018 (AB 1811, Committee on Budget) requires counties to provide grant payments to kinship foster caregivers with a pending RFA application in an amount equal to the basic rate paid to approved resource families. These grants are funded through Emergency Assistance‑Temporary Assistance for Needy Families (EA‑TANF) funding with counties responsible for the nonfederal share of costs (30 percent). For caregivers determined to be ineligible for EA‑TANF, the state General Fund covers what would have been the federal share of costs. In 2019‑20, recipients are generally eligible for this funding for up to 120 days (and under certain conditions, up to 365 days) until their applications are approved or denied. Current law reduces the maximum length of grant funding from 120 days to 90 days without the option for an extension beginning in 2020‑21, under the assumption that the RFA process likely would speed up as counties gained more experience with the process. However, as of the third quarter of 2019, the median RFA processing time for families with placement prior to approval was 116 days—an improvement from the peak median processing time of 164 days in early 2018, but still missing the 90 day target.
LOC‑Based Rate Structure
LOC Assessment Tool And Rate Structure Remain Partially Implemented. Implementation of the LOC assessment tool developed by DSS to determine foster care payment rates began in early 2018 exclusively for FFAs. DSS intended to apply the tool to all HBFC placements thereafter, but rollout beyond FFA placements has been delayed with no new implementation dates officially set. The extended delay stems from longstanding stakeholder concerns about the LOC assessment tool developed by DSS. For example, alongside other concerns, one issue that has been raised is that the tool may assign foster youth with elevated needs into inappropriately low LOC levels. In response to these concerns, DSS has halted the rollout of the tool beyond the FFAs. In the meantime, all other HBFC placements made since 2017 have been receiving the LOC 1 rate (or the ISFC rate for youth with elevated needs). Because the LOC 1 rate generally is higher than the pre‑CCR age‑based rates, foster caregivers are receiving higher payments through this partial implementation of the LOC‑based rate structure than they would have under the pre‑CCR payment rate structure.
Group Homes and STRTPs
More Group Homes Transitioned to STRTPs. Originally, CCR legislation required all group homes to end operations as congregate care providers or convert into STRTPs by January 2019. This deadline was subsequently extended as DSS continues to process provisional and permanent licenses for STRTPs. As of January 2020, there were nearly 350 licensed STRTPs (with a total capacity of more than 4,000). This is a marked increase from October 2018, when there were fewer than half as many licensed STRTPs.
Foster Youth Transitions from Group Homes to Other Placements
Congregate Care Placements Continue to Decline. As of January 2020, the congregate care caseload was around 3,500. Both in terms of raw numbers and proportionally, this is the lowest congregate care placements have been in over a decade. However, the number of youth residing in congregate care has been declining since 2003—long before the implementation of CCR. What portion of the decline in congregate care placements is attributable to CCR efforts is unknown.
For foster youth who were in group home placements as of May 2019, counties were required to develop child‑specific transition plans detailing the targeted placement type for those youth. According to DSS, around 30 percent of targeted placements for youth in group homes are STRTPs, 27 percent are HBFC placements, and 43 percent are a type of transitional housing or independent living program (for older foster youth) or plans to reunify with biological parents.
Utilization of CFTs and CANS Assessment
Increased Usage of CFTs. Since CFT implementation began in 2017, counties increasingly have integrated this approach into case management for foster youth. As of November 2019, nearly 70 percent of foster youth and nonminor dependents in foster care had received a CFT meeting, compared to around 40 percent one year prior.
Implementation of CANS Continues. In 2019, counties began rolling out CANS assessments as part of the CFT process. As of December 2019, more than 6,000 CANS assessments have been completed using an automated system. We understand, however, that more CANS assessments have been completed outside of the automated system. Exactly how many have been completed in total, however, is unclear. (We note that DSS’s budget assumes full implementation of CANS in 2019‑20.)
Overview of the Governor’s Budget for CCR
Proposed CCR Budget Slightly Increases From 2019‑20 to 2020‑21. The administration proposes approximately $495 million ($329 million General Fund) for CCR in 2020‑21. This represents an increase of less than 2 percent from the $486.2 million ($327.6 million General Fund) provided in the 2019‑20 revised budget. Figure 12 compares the 2019‑20 and 2020‑21 budgets by major CCR component area.
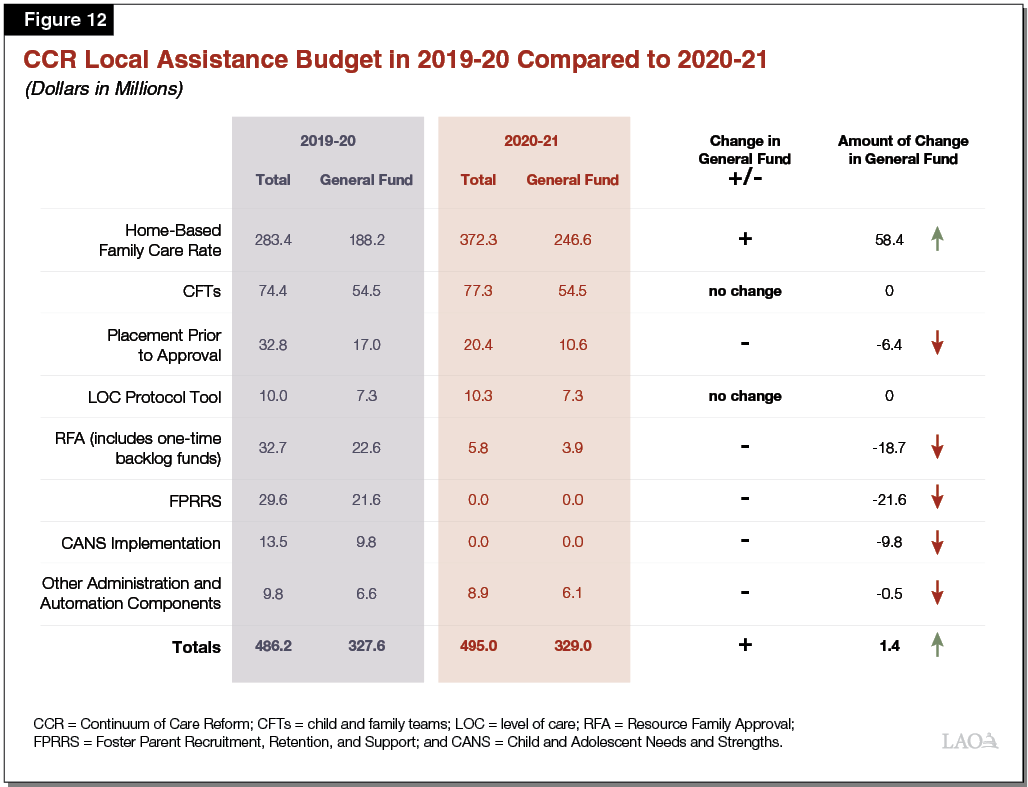
Lower Spending for Several CCR Components Offset by Projected Increase in HBFC Rate. As Figure 12 illustrates, funding for several CCR components is lower or zeroed out in 2020‑21 compared to 2019‑20. This primarily is because initial ramp‑up funding for those elements is scheduled to end in 2019‑20. These decreased costs, however, are more than completely offset by anticipated increases in the HBFC rate. In this section, we describe these components in greater detail.
- RFA Funding for Counties Sunsets in 2019‑20. Ramp‑up funding that the state provided to help counties implement the RFA process required under CCR—including rapidly increasing the number of foster families approved for home‑based care placements—is scheduled to end in 2019‑20. In addition, the one‑time RFA backlog funding included in the 2019‑20 budget is not proposed for renewal in 2020‑21. Beginning in 2020‑21, county welfare departments are fully responsible for the RFA process. The $5.8 million ($3.9 million General Fund) RFA funding included in the 2020‑21 budget is for county probation departments.
- Expiring Funding for Foster Parent Recruitment, Retention, and Support (FPRRS). Through 2019‑20, the state provided counties with ramp‑up funding to help ensure that counties could quickly build up and effectively retain their supply of high‑quality, home‑based foster caregivers—a prerequisite for CCR’s successful implementation. Ramp‑up funds for FPRRS are budgeted to sunset in 2019‑20, with counties bearing full responsibility for continuing to recruit, retain, and support home‑based foster caregivers beginning in 2020‑21.
- Expiring Funding for CANS Implementation. In 2019‑20, the state provided counties with one‑time funding to begin utilizing CANS assessments within the CFT process. Funding was meant to provide additional support to counties for the extra time that caseworkers needed to complete the assessments during the initial roll out and training phase. This funding is not budgeted for renewal in 2020‑21, assuming counties will have completed necessary initial trainings and that caseworkers will be able to complete the assessments as part of their normal responsibilities going forward.
- Decrease in Placement Prior to Approval Funding. As described earlier in this report, family members may begin providing care for a child before completing the RFA process (whereas nonfamily members may not begin fostering prior to completing RFA). Counties are required to provide grant payments to those kinship caregivers with a pending RFA application in an amount equal to the basic level rate paid to resource families having completed RFA. In 2019‑20, kinship caregivers pending approval could receive EA‑TANF grants and state funds for up to 120 days, with the possibility for extension up to 365 days. In 2020‑21, the maximum duration of funding decreases to 90 days (with no extension). The shorter possible funding duration—combined with assumptions about shorter RFA processing times—results in a lower budgeted amount for placements prior to approval in 2020‑21.
- Higher Spending on Projected HBFC Rates. The proposed 2020‑21 budget assumes that the cost of the HBFC rates will be nearly $250 million General Fund in 2020‑21 (about $60 million more than estimated costs for 2019‑20). We understand from the department that this increase is primarily a result of their projections of (1) the movement of youth across placement types and (2) the estimated costs of those various placement types.
LAO Assessment
Although we raise no major concerns with the Governor’s proposed budget for CCR, we do recommend that the Legislature use the budget process to seek clarification on several key components of the proposal. In this section, we identify those issues and highlight some remaining questions about CCR’s implementation that we currently are working with the administration to understand.
State Funding for RFA Ends Before Target Dates Are Met
CCR’s success depends in no small part on the continued recruitment and retention of resource families, but state funding for counties’ RFA is set to expire at the end of 2019‑20. Continued RFA processing that takes over 90 days could negatively impact the supply of home‑based foster caregivers, particularly in light of the decrease in placement prior to approval funding to 90 days beginning in 2020‑21.
Consider Extending 2019‑20 Level of Funding to Assist Counties With the RFA Process. Given the critical importance of resource families for CCR’s success, the Legislature could consider extending budgetary support to county welfare departments for RFA processing until counties have an opportunity to demonstrate they are able to sustain processing times of 90 days or less. We estimate funding these activities in 2020‑21 would cost approximately $20 million General Fund. The Legislature also could choose some lower level of funding, to more gradually “phase out” funding from the 2019‑20 levels.
Implementation of CANS Assessment Tool
Full Implementation of CANS Not Likely in 2020‑21. The 2020‑21 budget assumes full implementation of CANS in 2020‑21, and therefore discontinues the state funding support for implementation. We understand, however, that CANS will not be fully implemented in the budget year. This raises several key questions that we are continuing to work with the administration to understand.
- Timeline for Full Implementation of CANS. When does the administration expect full implementation of CANS? Could ending state funding for implementation support for CANS impact the full rollout of CANS?
- Ongoing CANS Workload Assessment. The 2019‑20 budget included budget‑related legislation requiring the department to work with counties to determine the ongoing workload associated with CANS. It is our understanding that this assessment is beginning. Absent this assessment, how did the administration determine that no state funding for CANS was needed in 2020‑21?
Implementation of LOC Assessment‑Based HBFC Rates
Current Stall in LOC Protocol Tool’s Implementation Means LOC‑Based Rates Cannot Be Fully Implemented. Full implementation of the HBFC payment rate structure as envisioned by CCR requires the use of an LOC assessment to determine foster youth’s general level of need and, accordingly, to determine an appropriate foster care payment rate. As noted earlier in this analysis, DSS developed the LOC protocol tool to perform this function, but the tool has not been fully implemented. DSS has expressed an ongoing willingness to coordinate with advocates to find an appropriate solution. However, full implementation of an LOC protocol tool has been stalled for some time. As a result, CCR’s HBFC rate structure has not been fully implemented, with the majority of foster youth receiving the basic rate (LOC 1).
We are in the process of working with the administration to understand issues currently still outstanding regarding the LOC tool including:
- How Will Rollout of the LOC Tool Proceed? The rollout of the LOC tool has been stalled for over a year. At this point, how the tool will be used beyond its current implementation for FFAs is unclear. We recommend that the Legislature seek clarification from the administration on how it plans to move forward with the tool.
Key Questions to Consider Regarding HBFC Rate Estimate. To calculate the HBFC rate increase, we understand that DSS makes estimates about the movement of youth across various placement types—for example, from STRTPs and group homes to HBFC placements—and the cost of the associated placement types and level of care. We are continuing to work with the administration to fully understand all of the components that comprise the HBFC rate. Some key questions to consider are:
- Placement Assumptions. What does the budget assume to be the distribution of foster youth across all placement types in 2019‑20 and 2020‑21?
- LOC Rate Assumptions. What is the assumed number of foster youth receiving each LOC rate in the budget year? What proportion of foster youth remain on the former age‑based rate structure in 2019‑20 and 2020‑21?
- Budget Impact of Delay in LOC Implementation. What would be the budgetary impact of a continued delay in the rollout of the LOC rate structure in 2020‑21?