
Local property taxes distributed to school and community college districts affect the state's Proposition 98 school funding requirements. Last week, we noted that our office’s estimates of local property taxes offsetting Proposition 98 are $353 million higher than the administration’s across 2015-16 and 2016-17. These differences continue in later fiscal years. Different assumptions about revenue from education revenue augmentation funds (ERAF) drive the majority of our variance from the administration.
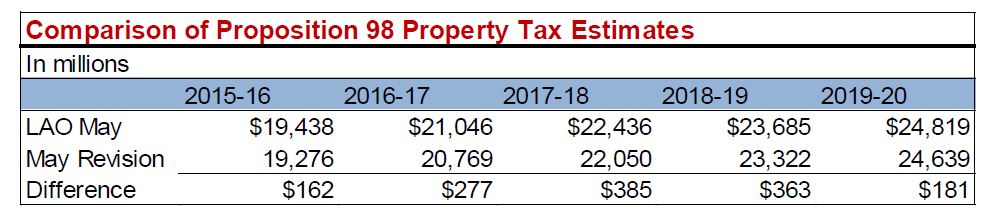
In this post, we discuss how our method of estimating ERAF differs from the administration and suggest that the administration’s approach appears to have multiple shortcomings. We also discuss the details of a technical error we discovered in data related to redevelopment agency (RDA) dissolution provided to us by the administration. Based on this new information, we have revised our property tax estimates upward by $87 million across 2015-16 and 2016-17, so that our office's estimates ("LAO May") are now $439 million higher than the administration's ("May Revision") across the 2015-16 and 2016-17 fiscal years, as shown below. The administration’s estimates also are based on this erroneous data.
Our office's multiyear economic growth scenario budget outlook (released last week here) already accounts for our revised property tax estimates.
Estimating ERAF
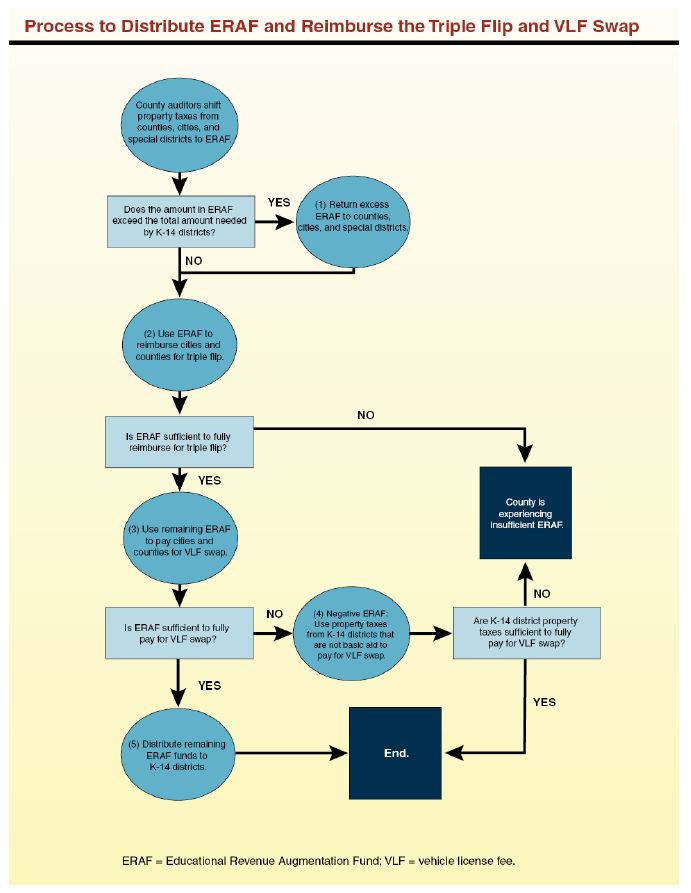
How ERAF Is Distributed. The flowchart below displays the complex process county auditors follow to allocate ERAF. A detailed description of this process can be found here.
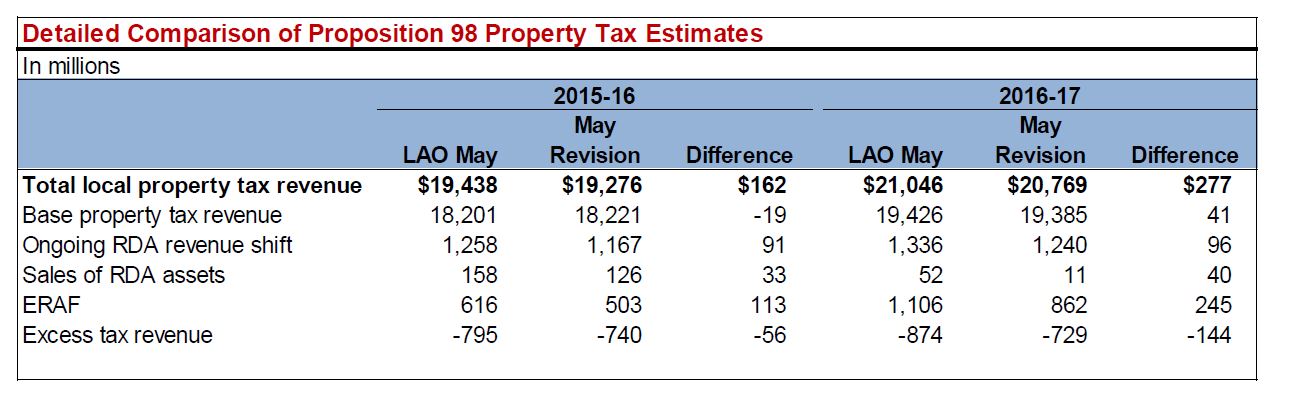
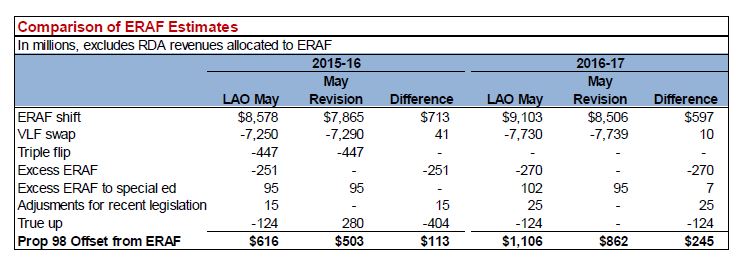
Comparing Our ERAF Estimates With the Administration’s. Our estimate of ERAF allocated to schools exceeds the administration’s by $113 million in 2015-16 and $245 million in 2016-17. The table below compares our assumptions about the various moving pieces of ERAF with the administration’s.
Some Concerns With Administration’s Approach. Our assumptions differ substantially from the administration on some key components of ERAF. These differences appear to arise from some shortcomings in three key parts of the administration’s method:
-
ERAF Shift. For 2015-16, our office’s estimate of the ERAF shift ($8.6 billion) comes from data reported by counties to the State Controller (SCO). This data represents the amount county auditors report having deposited in their countywide ERAF accounts. This is the most up-to-date and reliable data that we are aware of. It is our understanding that the administration’s assumption is not based on this data. We are uncertain of the data source for the administration’s assumption. For 2016-17, both our office and the administration grow our 2015-16 ERAF shift estimates by an amount slightly less than growth in statewide assessed values.
-
Excess ERAF. Based on our understanding of the administration’s method, it appears that they do not account for the return of excess ERAF to non-education local governments.
-
No Adjustment For Past Underestimates. For 2015-16, the administration includes a $280 million upward adjustment (shown in the “true up” line). This adjustment is made to better tie its estimates to data reported by schools and community colleges to the California Department of Education (CDE). The administration’s method has consistently required this type of upward adjustment in prior years. Nonetheless, the administration does not appear to attempt to account for this in 2016-17 or future years. Our method, on the other hand, attempts to account for the need for true ups in the past. We similarly have made adjustments to better tie to CDE data in prior years. We believe the need for this adjustment arises due to reporting errors in CDE and SCO data and the complexity of ERAF allocation. Recognizing this, we adjust our 2015-16 and 2016-17 estimates based on the typical adjustment required in prior years.
Technical Error in RDA Data
Administration Maintains RDA Dissolution Data. Successor agencies and county auditors report RDA dissolution payments and property tax information related to former RDAs directly to the Department of Finance (DOF). The administration uses this data to develop its estimate for state savings from RDA property tax residual distributions to schools. To develop our estimate of state savings, we must rely on information provided by the administration on RDA dissolution payments.
Administration Double Counted RDA Administrative Costs. Upon reviewing the administration’s assumptions for RDA payments, we determined a portion of the administrative costs for RDA dissolution was overstated. Specifically, the administration double counted the administrative costs associated with successor agencies. As a result, the administration’s RDA dissolution cost estimates are $86 million too high in 2015-16 and $91 million too high in 2016-17.
Consequently, Administration Underestimated RDA State Savings. As explained in our earlier report, lower RDA dissolution costs result in additional property tax revenue for local governments, including schools. More property tax revenue for schools reduces state costs to meet the Proposition 98 minimum guarantee. Because the administration overstated RDA dissolution costs, the administration also overstated state costs to meet the Proposition 98 guarantee.
State Savings of Roughly $100 Million. Under the administration’s property tax estimates, correcting for the overstated administrative costs would reduce state costs for schools $105 million across 2015-16 and 2016-17. Under our office's estimates, correcting this error reduces state costs $87 million. The difference in the savings estimates stem from differing assumptions about the share of RDA residual property taxes going to schools. Specifically, the administration assumes 60 percent of the residual goes to schools, whereas our office assumes 59 percent of the residual goes to schools.
Future Estimates Would Improve With Better Access to Data. As noted above, the DOF receives information regarding RDA dissolution directly. One challenge in developing our estimates is access to this data. Relying on DOF for this data delays our office’s ability to vet the administration’s RDA estimates thoroughly.
Follow @LAOEconTax on Twitter for regular California economy and tax updates.