
Proposition 13 Report: More Data on California Property Taxes
September 22, 2016
We receive various inquiries after publishing a report like this week's Common Claims About Proposition 13. Other questions emerge from online conversations about the report. You can contact us via Twitter direct message @LAOEconTax or via lao.ca.gov/staff. While we cannot answer all the questions we receive, we try to be as helpful as we can in facilitating conversation about important policy issues.
In this post, we provide additional data concerning trends in California's property tax over the last several decades.
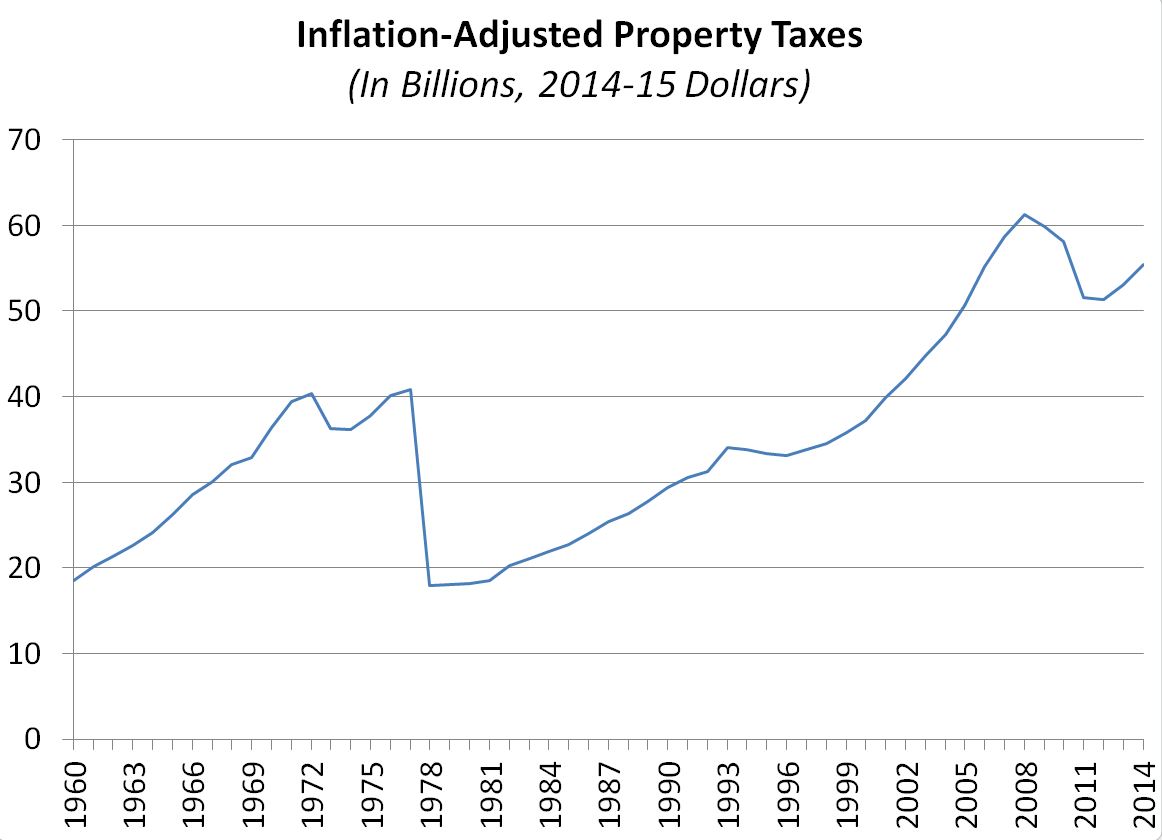
In our recent Proposition 13 report (Figure 1), we showed the trend of all California local governments' property tax revenue in inflation-adjusted 2014-15 dollars, as shown below. For a series of financial data covering long periods of time, inflation-adjusted ("real") numbers generally are preferred to control for the changed buying power of money over time. This is because a dollar a few decades ago could buy the same amount of goods and services that it would take several dollars to buy today. The figure below shows that property taxes dropped sharply in 1978-79 after Proposition 13, and on an inflation-adjusted basis have grown in the decades since. In 2014-15 dollars, property taxes rose to $40.8 billion before Proposition 13, fell to $18.0 billion after the measure's passage, and reached $55.5 billion in 2014-15.
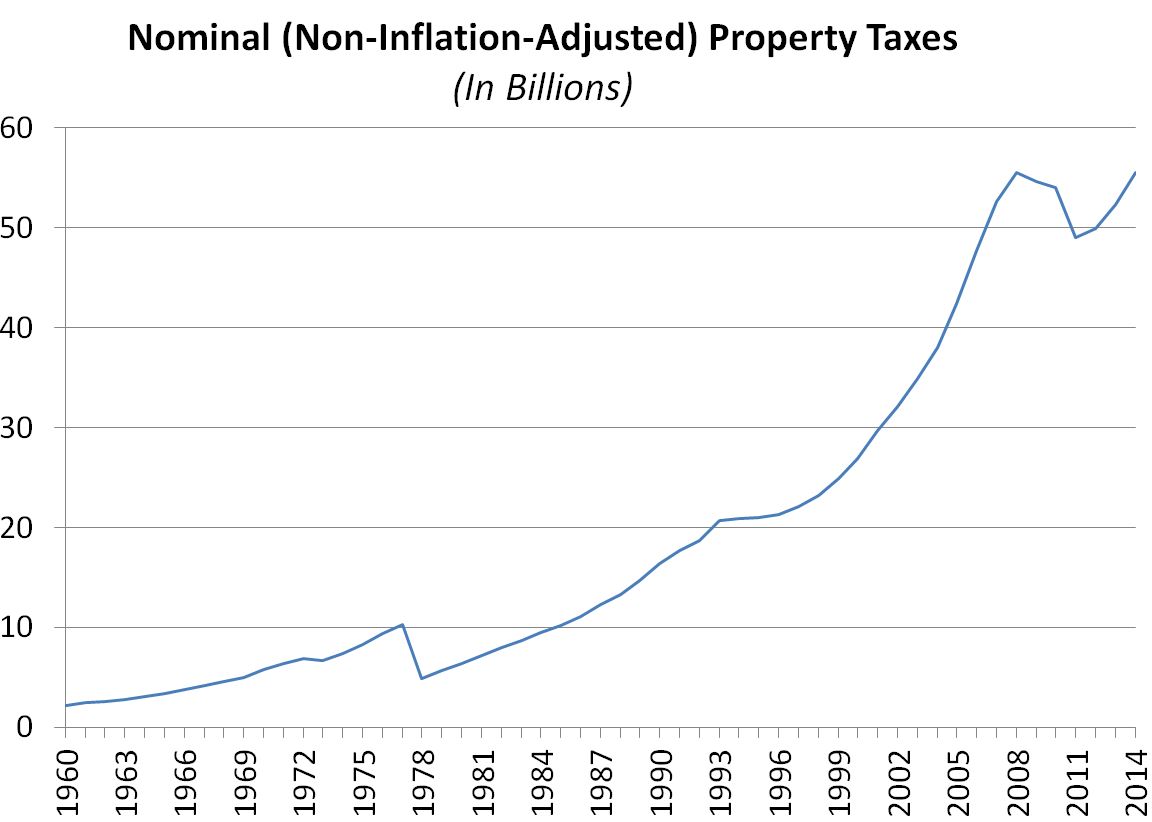
Some, however, are curious about the trend of property taxes unadjusted for inflation—in what are known as "nominal dollars." Below, we show this trend. Before Proposition 13, in nominal dollars, property taxes rose to $10.3 billion, fell to $4.9 billion after the measure's passage, and reached $55.5 billion in 2014-15.
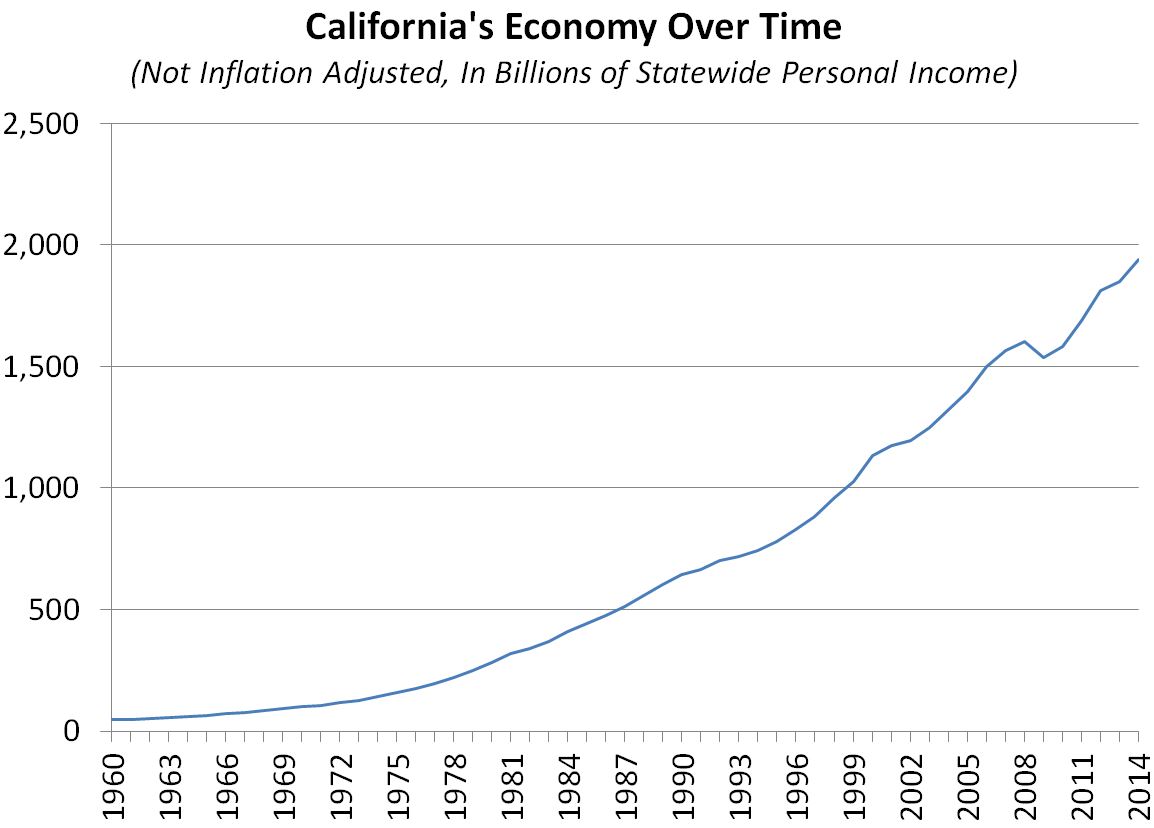
It is not surprising that property taxes have grown over time. So have the state's economy and its population. Below, we show the growth of California's economy, as measured by nominal statewide personal income. This is a good proxy for the size of the overall state economy. Fueled upward by population growth, inflation, productivity improvements, and innovation, the growth of the state's economy mirrors that of nominal property taxes shown above. When Proposition 13 passed in 1978, statewide personal income was $220 billion per year in nominal dollars. By 2014, California personal income exceeded $1.9 trillion. (In 2015, after the end of our historical property tax data series, personal income exceeded $2 trillion for the first time.)
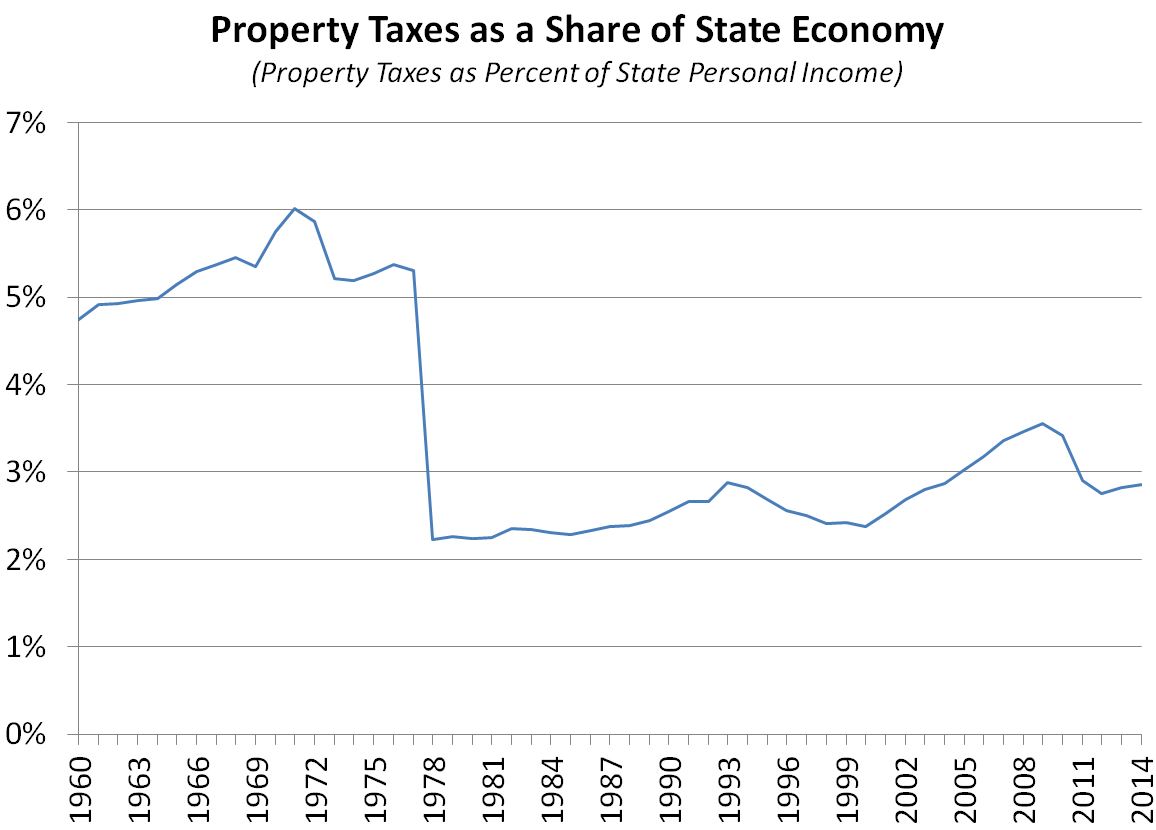
One way to look at property tax trends over time is to look at how big property taxes are compared to the overall state economy. The chart below shows that local governments' property taxes totaled 5.3% of the state’s economy just before Proposition 13, fell to 2.2% of the economy just after Proposition 13, and have risen slightly in the decades thereafter to reach 2.9% of the economy in 2014-15.
For context, note that state government's General Fund and special fund budgets [which are funded from income, sales, and other taxes, but not property taxes] have fluctuated between about 7% and 8% of statewide personal income since passage of Proposition 13. In the decades prior to Proposition 13, state budgets equaled a smaller share of personal income. See our 2015-16 state budget infographic for more information.
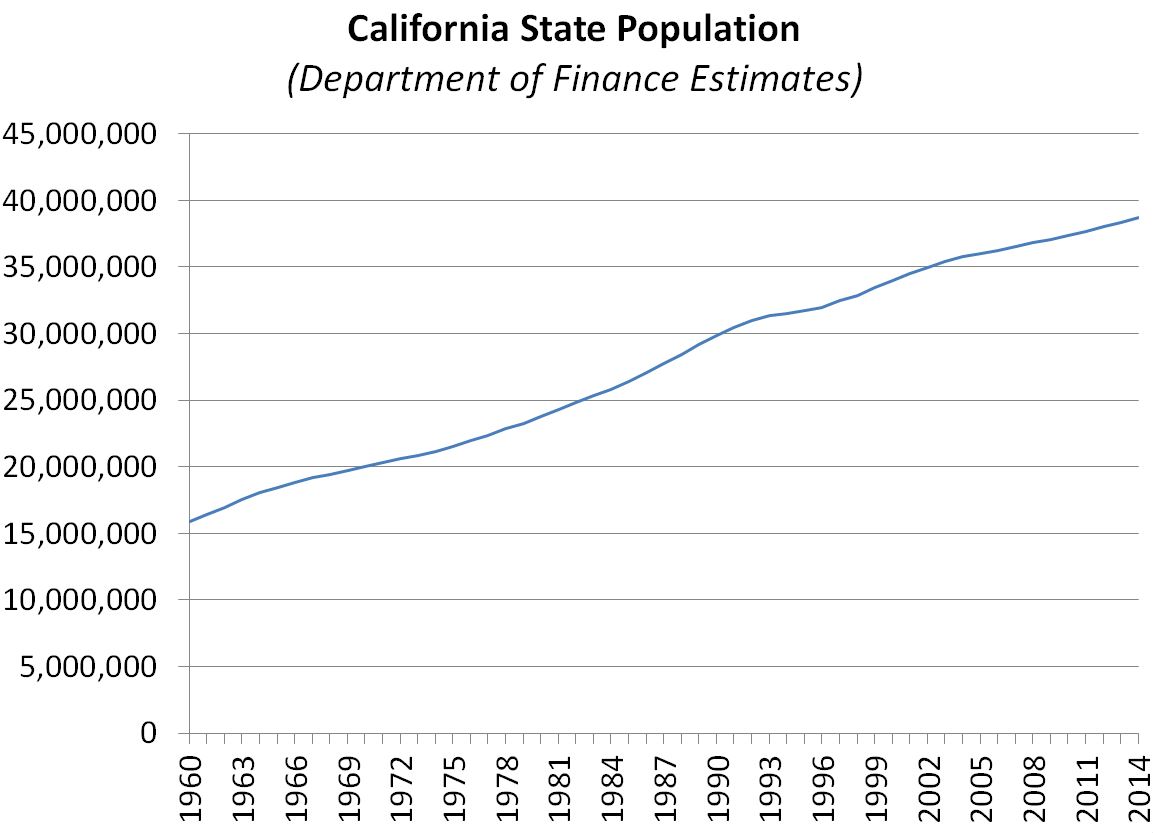
As mentioned above, the state's population also has grown since Proposition 13, as summarized below. At about 22.8 million when Proposition 13 passed, the state's population exceeded 38.7 million in 2014.
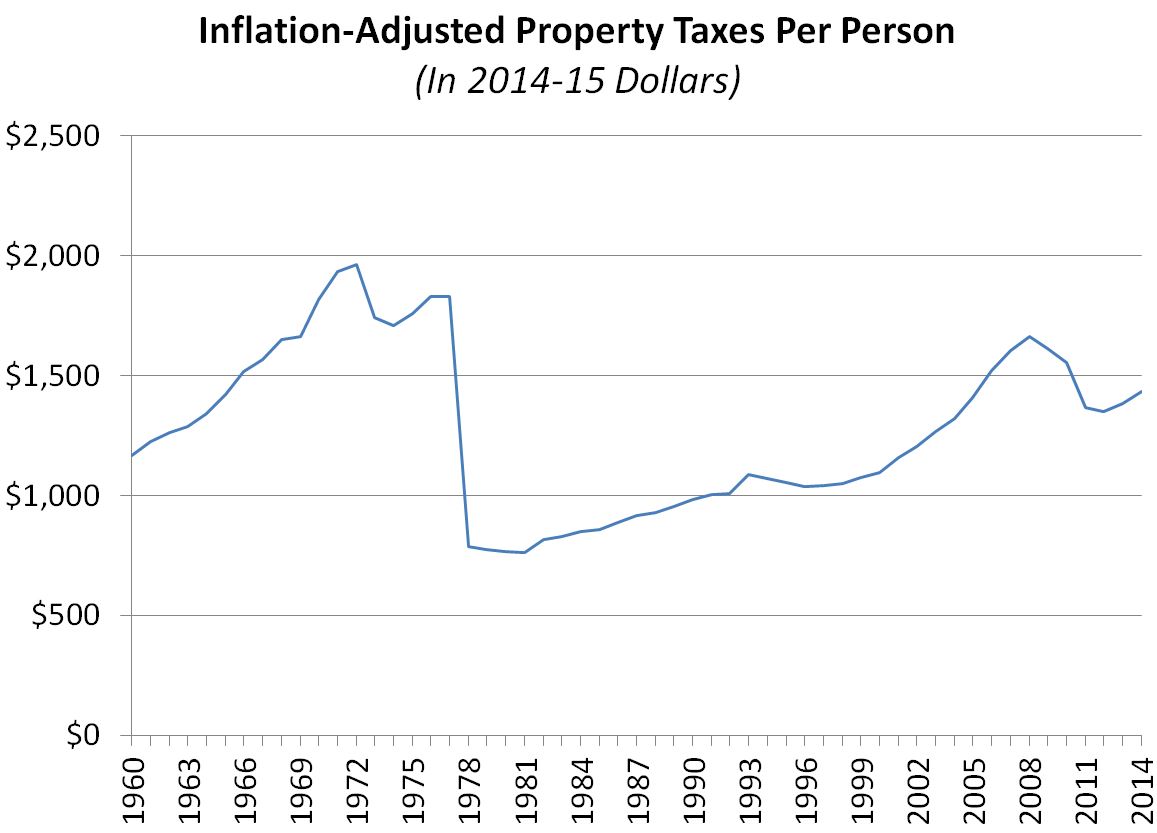
Another way to view the trend of local property taxes is to look at inflation-adjusted property taxes per person. This adjusts the inflation-adjusted totals displayed earlier in this post to control for population growth. Below we display the trend of inflation-adjusted local property taxes per person in 2014-15 dollars. By this measure, real property taxes per person were $1,827 when Proposition 13 was passed, $788 after the measure took effect in 1978, and rose to about $1,430 in 2014.
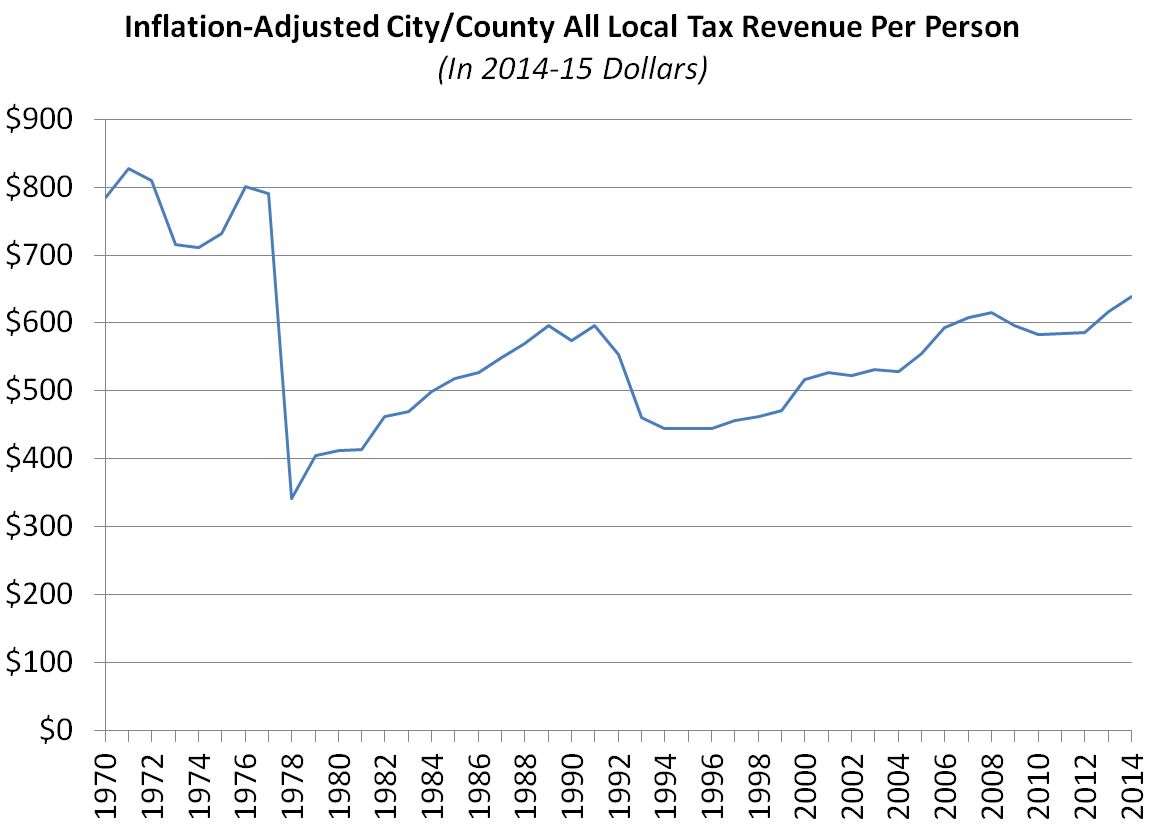
In our report, we also consider all inflation-adjusted city and county government tax revenues per person, including not only property taxes but also sales and other taxes received by California cities and counties, excluding state and federal funds. (This excludes property taxes received by school districts and other local governmental entities.) Adjusted for inflation, as shown below, cities and counties received roughly $790 per person in all tax revenues in 1977-78 before Proposition 13. This figure fell to about $340 just after Proposition 13 and has risen subsequently to about $640 per person as of 2014-15.
Again, for context, we note that state government taxes per person (which do not include property taxes), adjusted for inflation, totaled $2,636 (2014-15 dollars) in 1977-78 when Proposition 13 was passed and grew to $3,603 in 2014-15, based on nominal-dollar data in the state Department of Finance's Schedule 2.
Follow @LAOEconTax on Twitter for regular California economy and tax updates.