California's New Minimum Wage: Low-Wage Workers' Family Sizes & Incomes
December 6, 2016
Low-Wage Workers. We estimate that 30 percent of California workers—roughly five million people—make less than $12.50 per hour currently. In this post, we refer to these people as “low-wage workers.” (Based on our estimates, this part of the workforce will be affected directly by the fully implemented statewide minimum wage.)
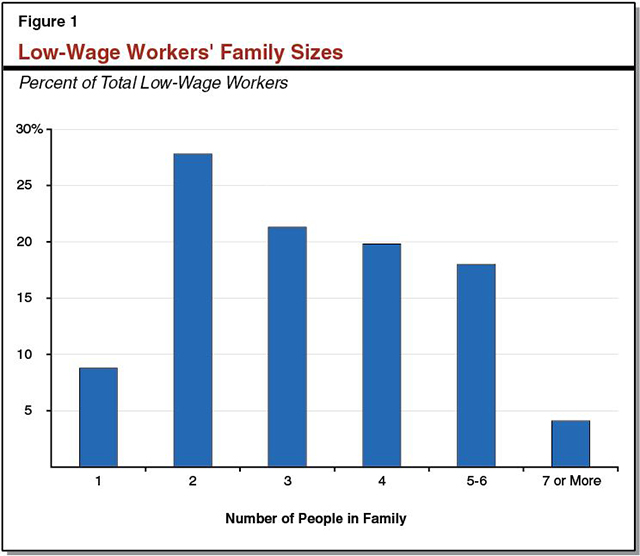
Family Sizes. As shown in Figure 1 below, the size of low-wage workers’ families varies considerably. (Here, “family” refers to people who live together who are related by blood, marriage, or adoption.) The vast majority of low-wage workers live with at least one other family member. Nearly one-quarter of them live in families of five or more people.
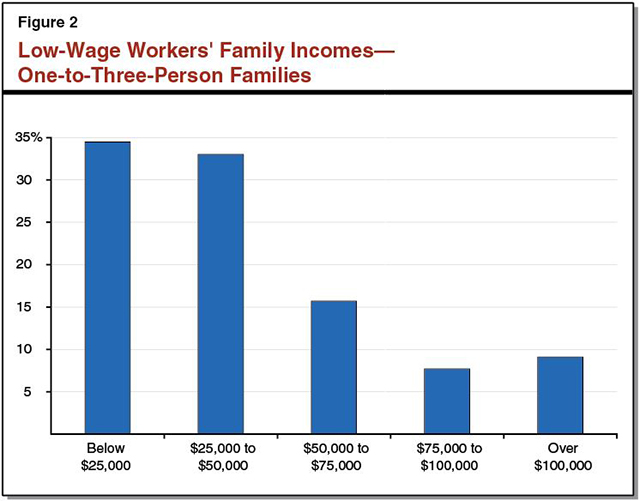
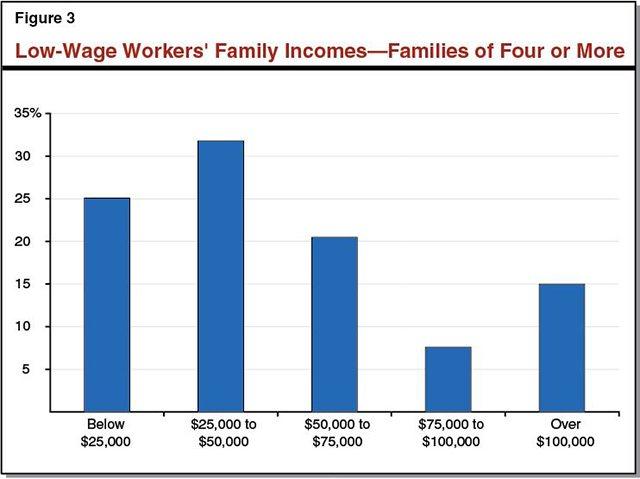
Family Incomes. The two figures below display estimated family incomes for California’s low-wage workers. Figure 2 displays estimated incomes for one-to-three-person families, while Figure 3 displays estimated incomes for families with four or more people. Most low-wage workers live in low-to-middle-income families, but some live in higher-income families.
Data Source: 2015-2016 Monthly Current Population Survey (CPS). The CPS is the federal government’s primary data source for unemployment rates and other labor market conditions. Minimum wage research often relies upon data from this survey, and we generally regard it as one of the best data sources for statewide analyses of low-wage workers. Like all survey data, however, the CPS has a variety of limitations. Due to these limitations, the actual numbers could be higher or lower than the estimates presented here. (We downloaded the CPS data for October 2015 through September 2016 from the National Bureau of Economic Research.)
For other posts in this series, click here.
Follow @LAOEconTax on Twitter for regular California economy and tax updates.


