
2017 May Revision: LAO Revenue Outlook
May 12, 2017
This is one of the LAO's responses to the 2017-18 May Revision. Other LAO responses are here.
This post presents our May 2017 General Fund revenue outlook for 2015-16 through 2020-21. Our estimates of General Fund revenues and transfers are slightly above those of the administration—nearly $900 million over 2015-16, 2016-17, and 2017-18 combined.
LAO May Revenue Outlook
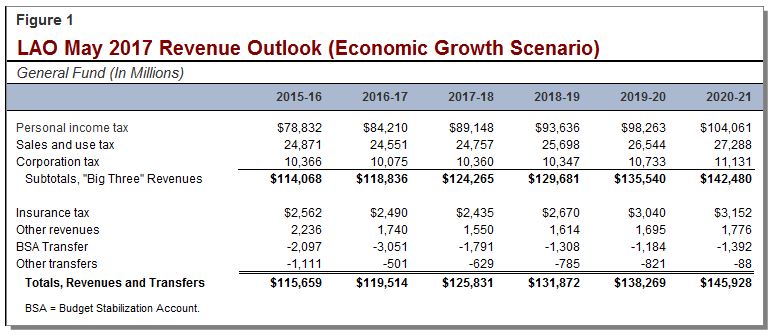
Figure 1 presents our General Fund revenue outlook for 2015-16 through 2020-21. Our estimates of General Fund revenues and transfers are slightly above those of the administration—nearly $900 million over 2015-16, 2016-17, and 2017-18 combined. Our May 2017 revenue outlook is based on an economic scenario that assumes continuing economic growth for the next several years. Alternatively, if a recession occurs over this time frame—or if economic growth is slower than we assume—General Fund revenues would be substantially below the levels shown in the figure.
Personal Income Tax (PIT)
Healthy Growth in Taxable Wages Assumed. Based on our consensus economic growth scenario, Californians' wages and salaries are projected to grow at a healthy pace over the next few years. Wage and salary growth is the principal driver of PIT revenue growth. While the economic growth scenario anticipates a continued slowing in job growth in the state, it also anticipates that individuals' salaries will increase over the next couple of years due to a tightening labor market and rising minimum wages, among other factors. In our revenue projections, overall taxable wages and salaries of California residents grow by 6 percent in 2017, 7 percent in 2018, and another 6 percent in 2019.
Temporary Capital Gains Boost and Potential Stagnation Later. Based on recent data received from state tax agencies, Californians' capital gains over the last few years are less than we assumed previously. Our new revenue projections reflect this information, with 2015 capital gains down from $127 billion in our November 2016 estimates to $118 billion now. Stocks were weak during the early part of 2016, and we now estimate that 2016 capital gains fell to $114 billion—similar to the amount assumed by the administration in its revenue estimates. (Hard data on 2016 capital gains will only emerge after extension filers send in their PIT returns this fall.)
With the booming stock market of recent months, those selling stocks now are recording much larger gains than they would have a year ago. Therefore, our current projections anticipate that capital gains income on 2017 PIT returns will grow substantially to $138 billion before dropping over the next couple of years when stock prices are assumed to stagnate. General Fund capital gains tax revenue—a key factor in determining Proposition 2 (2014) debt payments and budget reserve requirements—climbs from $12.1 billion in 2016-17 to $13.3 billion in 2017-18 under our estimates before falling back to around $12 billion during the following two fiscal years. The administration’s capital gains tax revenue estimates are similar to ours during that period. However, we estimate that June 2017 PIT collections will be around $1 billion higher than the administration does, which explains our higher PIT estimates for 2016-17.
Corporation Tax (CT)
Fewer Tax Refunds in 2016-17 Boost 2015-16 Revenues. There have been about 10 percent fewer refunds claimed by corporate taxpayers in 2016-17 than assumed in the Governor’s January budget estimates. Under the state’s complex accrual accounting rules, lower refunds in 2016-17 increase 2015-16 revenues. Those lower refunds, along with a handful of other minor changes in accruals since January, have led both our office and the administration to increase our estimates of CT revenue in 2015-16 by hundreds of millions of dollars.
Continued Profit Growth Offset by Tax Provisions. As described in our May economic outlook, our estimates are premised on an economic growth scenario complied by a national economic data firm. Under that scenario, U.S. corporate profits will grow by 4.6% in 2017 and at a similar pace thereafter. Our outlook for CT revenue growth is weaker than the projected growth in profits, however, because we assume that corporate taxpayers will continue to use a substantial amount of tax credits and net operating loss (NOL) deductions. For example, firms that lost money in prior years may use a NOL deduction to significantly reduce their taxable income after they return to profitability. Thus when profits rise, so does the use of NOLs. Similarly, firms that invested in qualified research activities accumulated tax credits that they can now use as their profits rise. We expect the continued use of these tax provisions to temper the growth in the CT over the coming years.
Sales and Use Tax (SUT)
Sales Tax Estimates Down. SUT collections were well below the administration’s projections in February and March. This weakness not only reduced revenue in 2016-17, but also established a lower base for subsequent growth. Additionally, consumers have not been borrowing as much money as expected, further weakening the short-term outlook for taxable sales. These developments have caused significant downward revisions in both our office’s and the administration’s SUT estimates for 2016-17. Thereafter, we both project moderate SUT growth.
Insurance Gross Premiums Tax
Lower Estimates of Revenue Loss Associated With Managed Care Organizations Deal. The 2016-17 budget package levied a special health care tax on managed care organizations (MCOs) for three years and exempted them from the CT and the insurance tax over the same period. We have lowered our estimates of the insurance tax revenue loss associated with this deal. Specifically, we estimate that the MCO deal reduced insurance tax revenues by about $460 million in 2016-17 and 2017-18 combined, down from $560 million for the same period under the administration’s January 2017 revenue estimates. In their May 2017 revenue forecast, the administration reduced their estimates of the revenue loss even further, reducing the revenue loss by half.
Administration Outlook Close to LAO Outlook
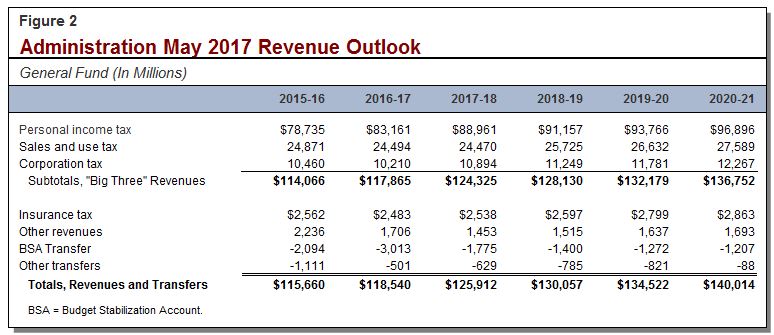
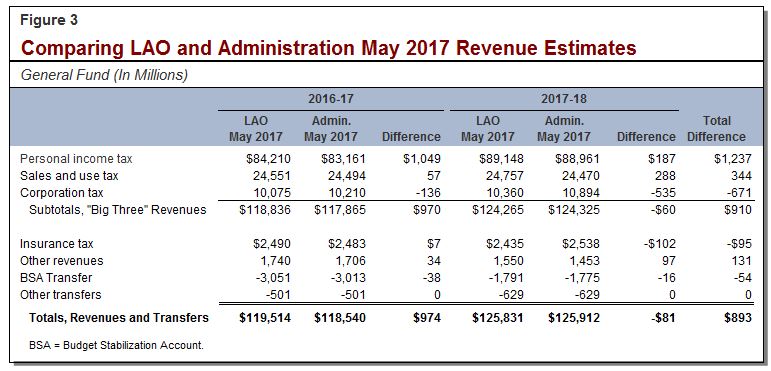
Figure 2 shows the administration’s May 2017 revenue outlook. As shown in Figure 3, our revenue estimates are $893 million above those of the administration for 2016-17 and 2017-18 combined. This is the combination of our estimates exceeding the administration’s by nearly $1 billion in 2016-17 and our estimates coming in slightly below the administration’s for 2017-18. Generally, the difference is explained by our higher estimates of PIT and SUT revenues offset by our lower estimates of CT revenue.
Follow @LAOEconTax on Twitter for regular California economy and tax updates.