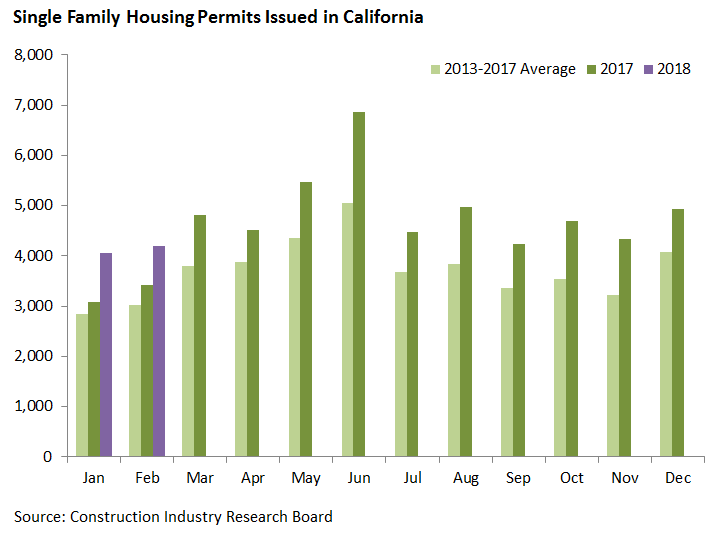
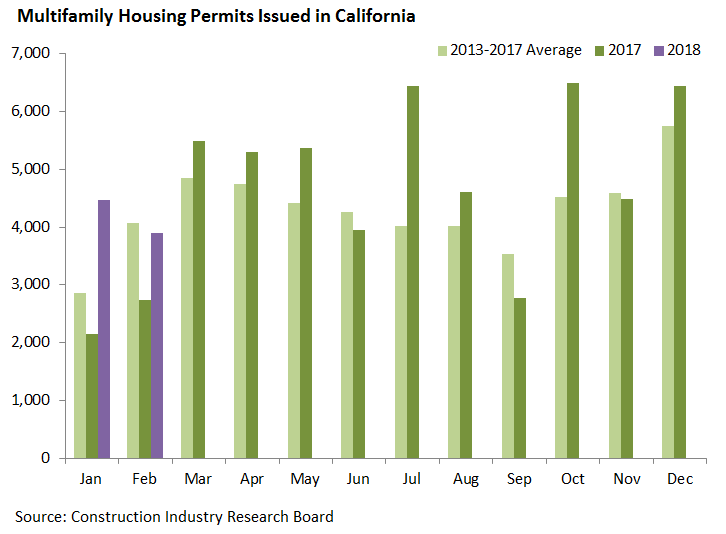
Through the first two months of 2018, 16,632 housing units have been permitted statewide. This is well ahead of the 2017 pace, but the first two months of 2017 were unusually weak. This year’s pattern is more in line with 2015 and 2016. As the graphs below show, January and February are typically slow months of the year for permit activity.
Single family homes (8,250) have made up about half of the statewide total so far this year, as they did in 2016 and 2017. Single family permits are up 27 percent in the first two months of 2018 compared to 2017.
Multifamily housing units (8,382) account for the other half of the statewide total. Multifamily permits are up 72 percent in the first two months of 2018 compared to 2017.
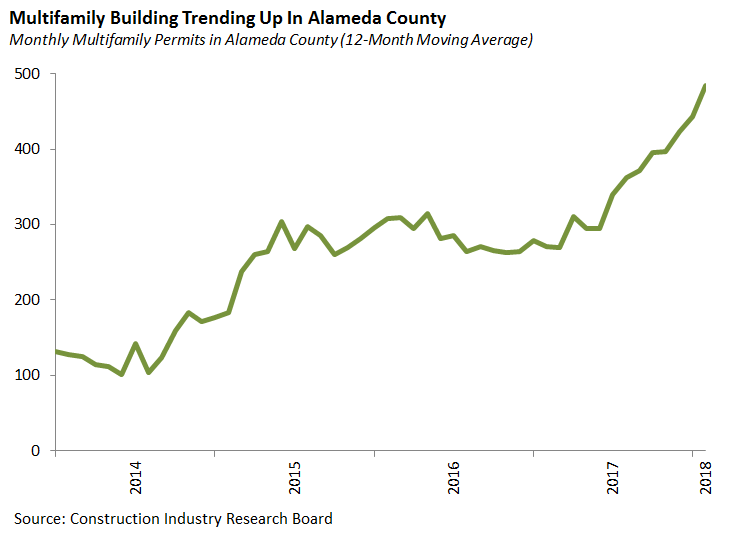
In recent months, multifamily permitting has been especially strong in Alameda County, led by Oakland. This recent uptick is part of a general upward trend in Alameda County over the last five years.
Data source: CIRB (Construction Industry Research Board), a service provided by the California Homebuilding Foundation http://www.mychf.org/cirb.html.


