
Bottom Line: Little change from July. Economic conditions continue to be consistent with historically strong state revenues. Conditions have improved consistently over the past year.
Knowing when the state’s next budget slowdown will happen is impossible. Many economic factors outside the state’s control influence state revenues. Despite this, certain data points can help us understand whether shifting economic conditions are likely to lead to growth or declines in state revenues in the coming months.
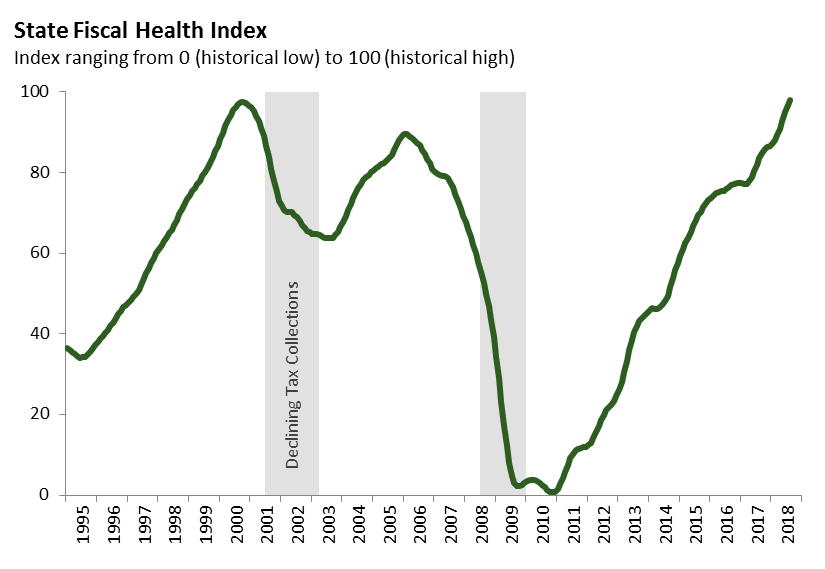
We created the State Fiscal Health Index to track the strength of economic conditions relevant to the state’s fiscal health. The figure below shows the index through August 2018. The index ranges from 0 (representing the lowest level in the last 25 years) to 100 (representing the highest level in the last 25 years). The higher the index, the better the conditions for state revenues. As of August, the index is at 98. This suggests that economic conditions are near historical highs and the state’s near term revenue outlook is strong. But it is worth noting that economic conditions have not remained at such elevated levels for an extended period of time in the past.
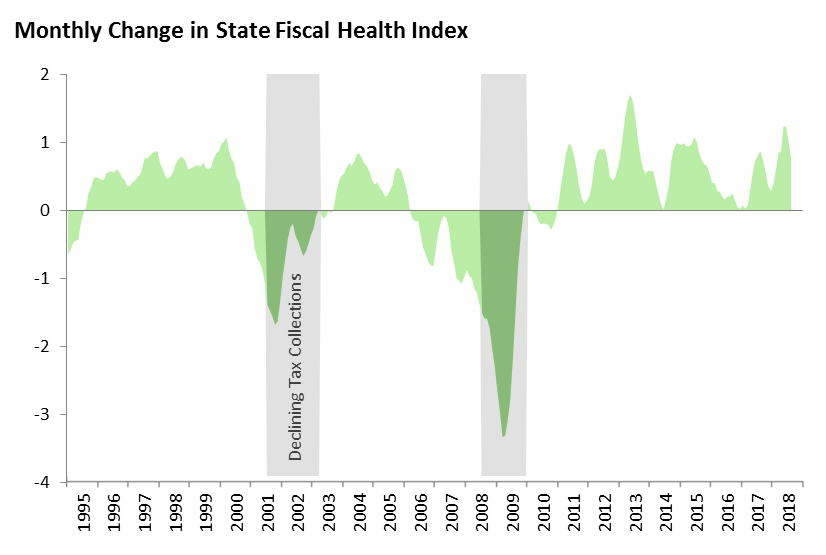
Perhaps more important than the level of the index, is the change in the index from month to month. In general, when the index is increasing, state revenues are likely to increase over the next six to twelve months. On the flipside, a consistent decline in the index over a few months has typically signaled that the state is entering an extended period of revenue weakness. The figure below shows the monthly change in the index through August 2018. The index recently has grown consistently, increasing from 88 six months ago and 84 in August 2017.
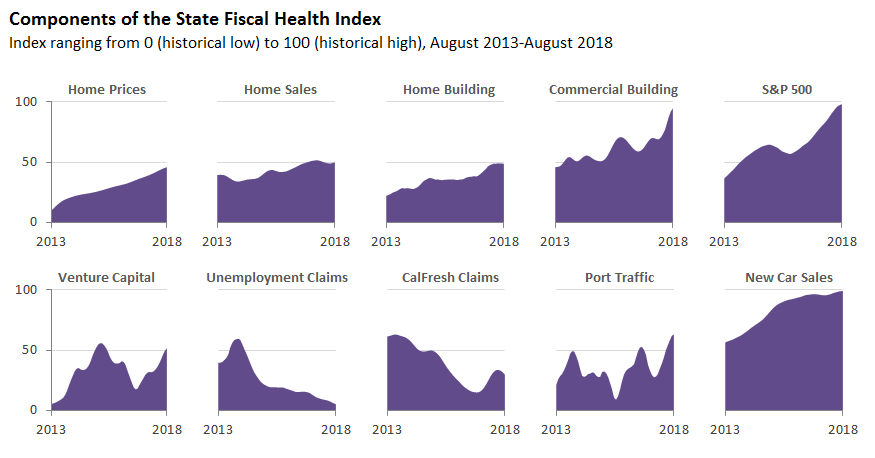
The index combines ten key data points: home prices, home sales, residential and commercial building permits, the S&P 500 stock market index, venture capital funding, unemployment insurance claims, CalFresh claims, port traffic, and new car sales. With the exception of the S&P 500, all of this data is specific to California. An increase in these economics variables signals a more positive revenue situation, while a decline suggests a worsening revenue outlook. There are two exceptions to this pattern: claims for unemployment insurance and CalFresh. When claims for unemployment insurance and CalFresh decline this signals an improving revenue situation, while rising claims signal a worsening situation. The graph below shows the recent trends in these variables.
Note: Economic data are frequently revised following an initial release. In the coming months, we similarly may revise our index to reflect any changes in the underlying data.