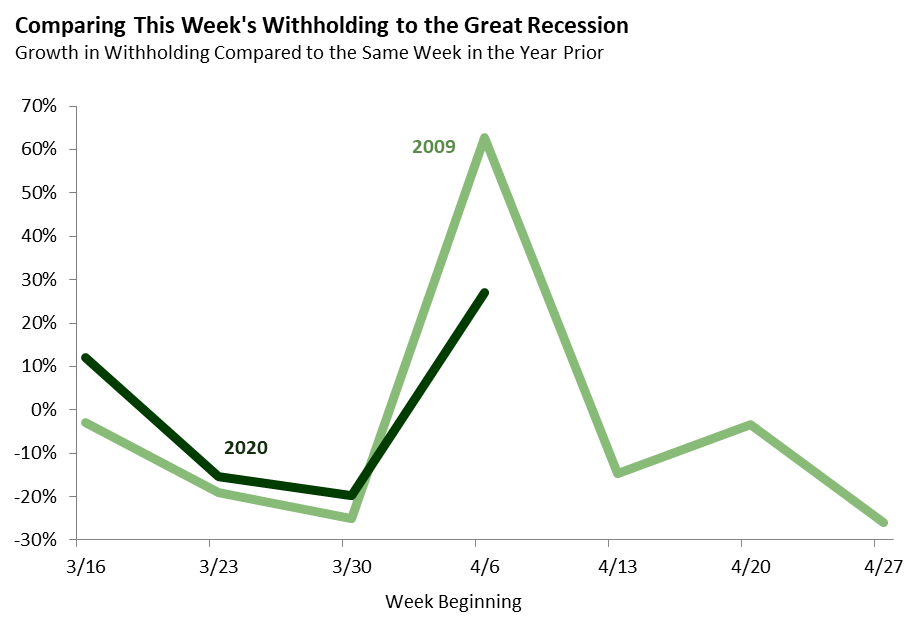
Bottom Line: Withholding has shown significant weakness for three weeks in a row. This weakness has been similar to what was seen during the trough of the Great Recession.
California employers are required to make regular income tax withholding payments for their employees, which can provide a real-time indication of the direction and magnitude of the aggregate change in the employers’ payrolls. Most withholding payments are for employees’ wages and salaries, but withholding is also due on bonuses and stock options received by employees. We caution against giving too much weight to withholding numbers in any given week because a single anomalous day can result in numbers that are difficult to interpret. Nonetheless, given the pace and possible severity of the shift in the state’s economy resulting from the COVID-19 outbreak, tracking weekly withholding is worthwhile as a way to assess the state’s rapidly changing economic situation.
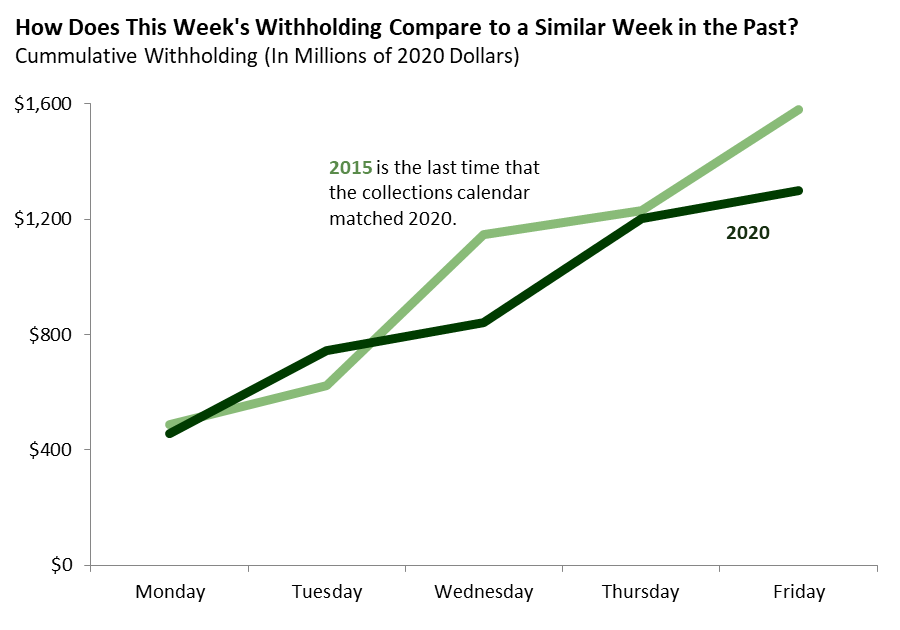
Withholding this week was especially affected by timing issues. Timing issues arise when the days of the month fall on different days of the week year-to-year. As a result of these calendar differences, payments are made on different days each year. These timing issues make a comparison between 2020 and 2019 (as we have done in prior posts) somewhat misleading. Instead, it is more helpful to compare this week’s collections to the same week in a prior year with an identical collection calendar, the most recent of which was 2015. The first graph compares withholding payments received this week to payments received in the comparable week in 2015 (adjusted for inflation). For the third week in a row, withholding shows a significant impact of the COVID-19 outbreak, with payments this week down 18 percent compared to the same week in 2015.
The second graph compares the trajectory of withholding since the beginning of the COVID-19 slowdown with the trajectory of withholding during 2009, when the state was in the depths of the Great Recession. Unlike the graph above, this graph shows a simple year-over-year change, which in this case is less problematic because 2009 had an identical collection calendar to 2020. As a result, the comparable week in 2009 had the same timing anomalies as the current week in 2020. This anomaly produces the spike seen in the graph below. Overall, the trajectory of withholding over the last three weeks has been similar to the trajectory during the depths of the Great Recession.
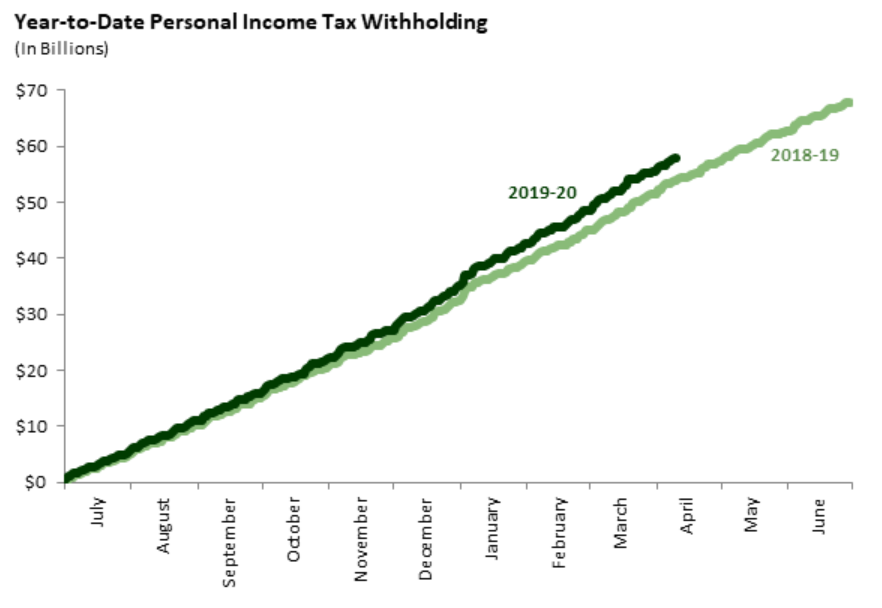
The final graph compares withholding payments so far in the 2019-20 fiscal year to 2018-19. As of now, year-to-date payments in 2019-20 remain ahead of 2018-19.