This post is updated to include withholding data from Friday July 3rd.
Bottom Line: California income tax withholding continues to run about 3 percent below the comparable week in 2019.
California employers are required to make regular income tax withholding payments for their employees, which can provide a real-time indication of the direction and magnitude of the aggregate change in the employers’ payrolls. Most withholding payments are for employees’ wages and salaries, but withholding is also due on bonuses and stock options received by employees. We caution against giving too much weight to withholding numbers in any given week because a single anomalous day can result in numbers that are difficult to interpret. Nonetheless, given the pace and severity of the shift in the state’s economy resulting from the COVID-19 pandemic, tracking weekly withholding is worthwhile as a way to assess the state’s rapidly changing economic situation.
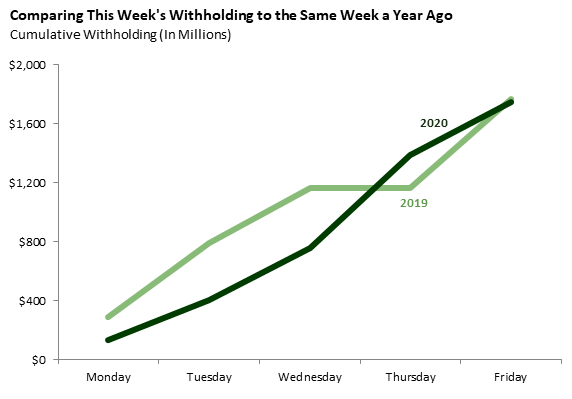
The first graph compares withholding payments received last week to payments received in the comparable week in 2019, which ran from Monday, July 1 to Friday, July 5 of that year. Withholding was down 1 percent from the comparable week in 2019. While there were only four processing days in the comparable week last year, the entire week was within the month of July. (Typically, the first few days of each month have elevated collections.) In contrast, this year the week included the last few days of June and the first few days of July. There were five processing days this year, however, since Independence Day fell on the weekend. These factors roughly canceled each other out and collections ended up very close to the comparable week in 2019.
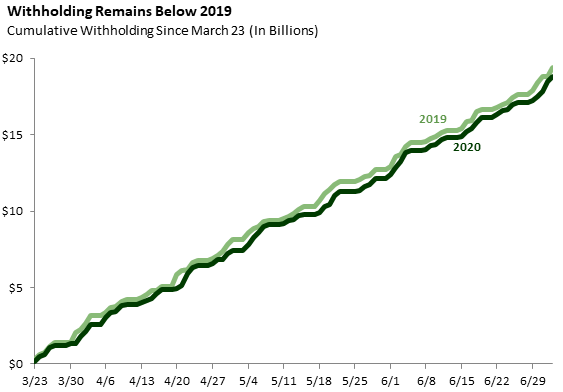
The second graph shows total withholding collections since Monday March 23, when we first started to see evidence of an impact of the pandemic on withholding. As shown in the graph, total collections between March 23 and July 2 are down 3.0 percent ($576 million) compared to 2019. The cumulative decline stood at 3.2 percent ($559 million) last week and has hovered around the 3 percent range for nearly a month now.
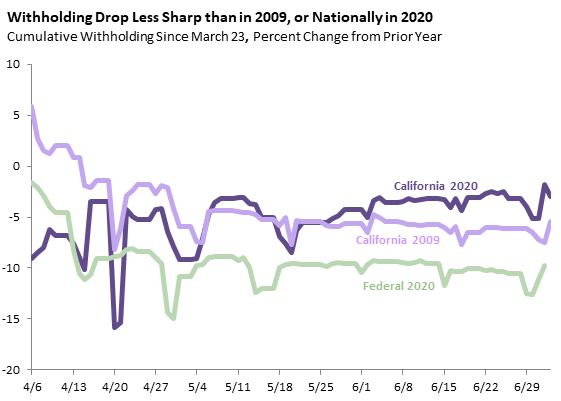
The final graph shows the year over year changes in cumulative withholding for California in 2020, the United States in 2020 (from the federal income tax), and California in 2009 at the trough of the Great Recession. California’s withholding decline this year has been less steep than it was in 2009, and not nearly as sharp as the federal decline this year. While California’s economy has been hurt as badly by the recession as the national economy, its withholding collections have likely held up better because its income tax falls more heavily on the higher-paid workers who have experienced fewer employment losses than their lower-paid counterparts.