Home prices are important to the California economy for a number of reasons. In the short and medium terms, home price increases often drive construction activity, which in turn spurs employment growth in a wide range of sectors. In the longer term, chronically high housing costs have hurt the state’s business climate and been a key reason California loses residents to other states on net in most years.
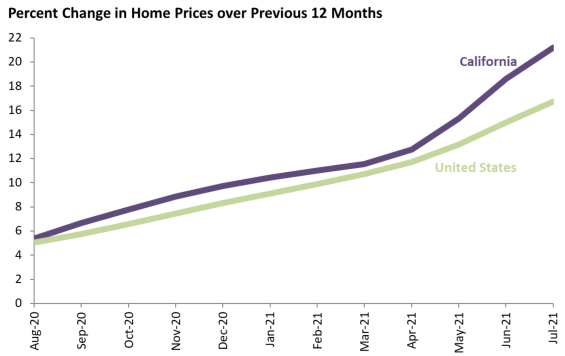
July 2021 data again show rapid increases in home prices in both California and the rest of the country over the past year: the typical home in California has appreciated 21.2 percent since July 2020, well above the national figure of 16.7 percent. California has seen higher 12-month growth rates before: price growth topped out at 25.2 percent in 2004 and 23.7 percent in 2013. In contrast, the nation’s highest previous growth rate since 1996 (the first year in Zillow’s database) was 11.9 percent in 2005. High materials prices, low interest rates that make monthly mortgage payments more affordable (all else equal), low inventory levels, and possibly the pandemic-driven shift to remote work have contributed to the price increases.
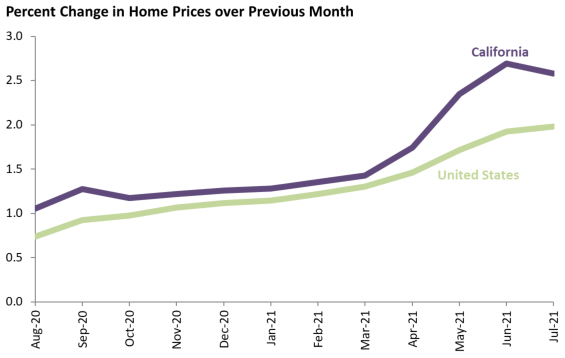
The next figure shows the month to month change in home prices in the state and the nation. The state has seen more price growth than the nation in each of the last twelve months. In July, the state growth rate of 2.58 percent was below the previous month’s rate for the first time since October, but still the second highest monthly growth rate in the history of the series. The national figure of 1.98 percent was the highest monthly growth rate in series history, the ninth straight month that the growth rate has set a record.
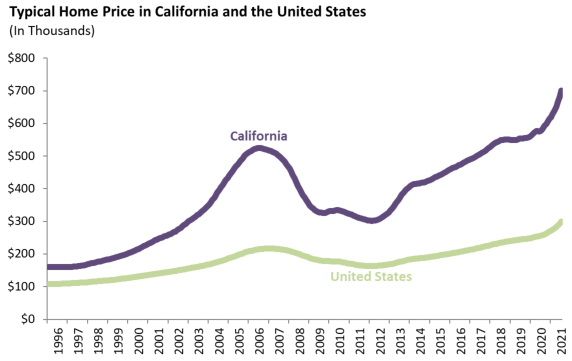
The slower home price growth that prevailed in 2018 and 2019 made a minor dent in the affordability gap between the state and the rest of the country. Housing in California has always been relatively expensive, and the gap has widened considerably since 2012. Previous recessions have had disparate effects on home prices: they were largely unaffected by the collapse of the dot-com bubble in 2001, while in the late 2000s the collapse of the housing bubble was the single biggest factor that led to the financial crisis. Recent evidence shows the affordability gap widening again.
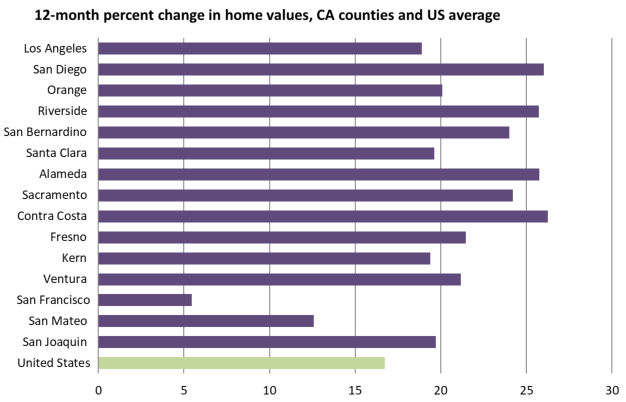
The graph below shows appreciation over the past 12 months for the state’s 15 largest counties, and suggests that the shift to remote work has been a key factor in recent price changes. San Francisco has long been northern California’s largest business hub, and historically a large share of its work force has commuted in from other counties. With remote work becoming more common, there is less of a premium on living close to the office and as such home prices in San Francisco have not seen the explosive growth common in the rest of the nation. San Francisco’s average home price is up just 5.5 percent over the past year, and the neighboring and more expensive San Mateo is up 12.6 percent. All the other large counties in the state have seen growth in the vicinity of 20 to 25 percent, with San Francisco’s relatively affordable neighbors Alameda and Contra Costa seeing higher growth than most.