Differences in Property Tax Revenue for Counties, Cities & Special Districts
January 6, 2016
This is the third blog post in our series California’s Property Tax: Where Does Your Money Go? This post examines the revenue from the 1 percent tax available for a subset of local governments.
Below, we consider the property taxes available within each county for all non-school local governments. We exclude schools’ property taxes from this analysis because state law guarantees schools relatively similar levels of funding regardless of how much property tax revenue they receive. Thus, unlike other types of local governments, schools that receive large amounts of property tax revenue generally may not be “better off” than schools that receive lesser amounts.
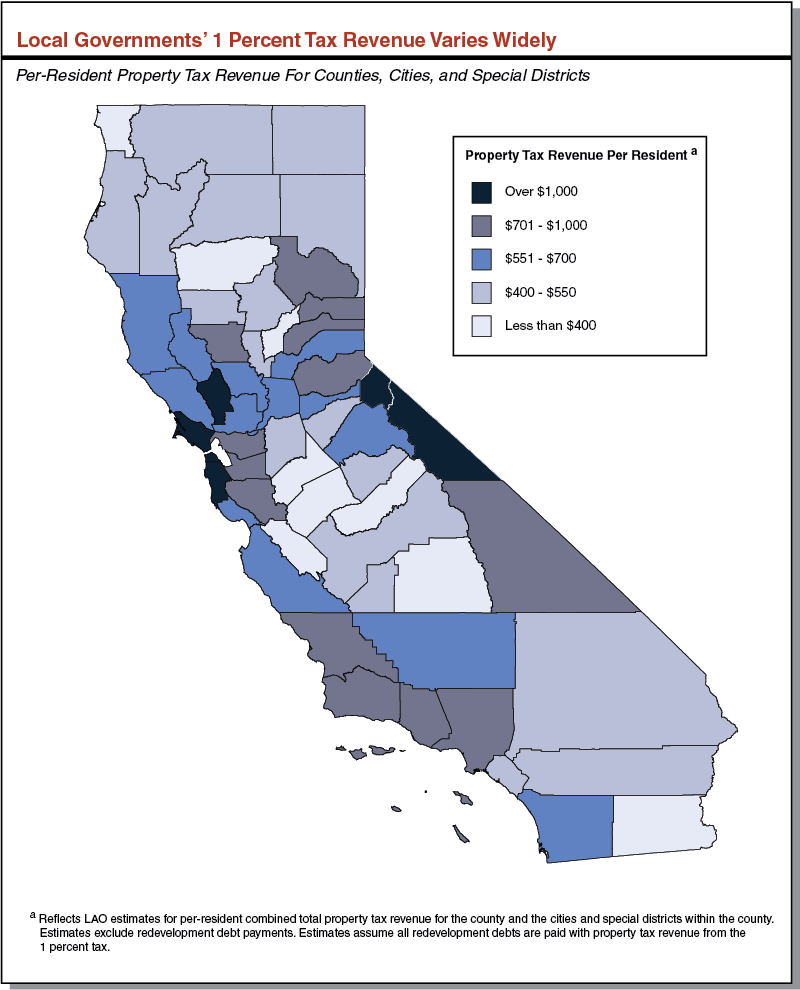
Property Tax Revenue for Counties, Cities, and Special Districts Varies Widely. Almost all property taxes collected in a county stay within that county. Within each county, total property tax revenue available for the county, cities, and special districts ranges from over $5,000 per resident in Alpine County to less than $270 per resident in Imperial County. As seen in the map below, though Alpine and Imperial Counties are at the extremes of the distribution, there are still significant differences among counties’ property tax revenue for non-school local government services. The variation across counties largely is explained by three factors:
-
Total Assessed Value. Counties with higher assessed values generate more property tax revenue than those with lower assessed values.
-
Remaining Redevelopment Debt. As explained in our earlier post, some areas of the state are still paying debts related to redevelopment agency projects. Redevelopment debt is paid with part of the revenue from the 1 percent tax. As a result, those counties with higher redevelopment debt have less property tax revenue available for other local governments.
-
Property Taxes Distributed to Schools. As discussed in the earlier post, statewide, schools receive the greatest share of the 1 percent tax. Within each county, however, schools’ share of property tax revenue varies from 20 to 64 percent. The share of the property tax schools receive in each county is based on formulas from the mid-1970s. In counties where schools receive a larger share of the 1 percent tax, less property tax remains for the county, cities, and special districts.
Click here to view a larger version of the map and scroll over each county for exact amounts.
To receive email notices of future posts in this series, email the LAO's local government analyst, Carolyn Chu.
Follow @LAOEconTax on Twitter for regular California economy and tax updates.

