Fiscal Outlook: Focus on Revenues
November 15, 2017
For other reports and posts related to our November 2017 Fiscal Outlook, see here.
Near-Term Revenue Estimates
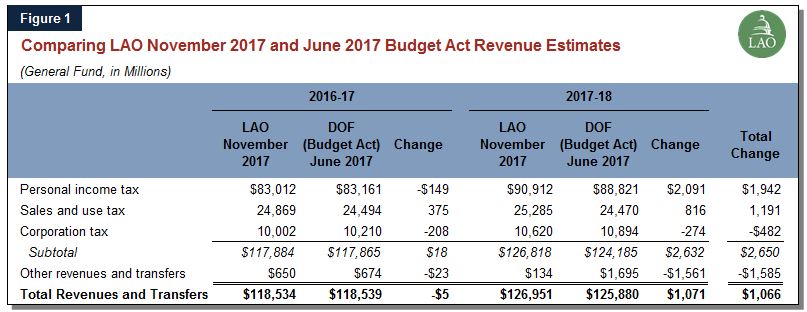
Higher Revenues for 2016-17 and 2017-18 Combined. Figure 1 compares our November 2017 revenue estimates with the administration’s revenue estimates that were incorporated into the June 2017 budget package. As shown in the figure, our estimates of revenues from the state’s three largest taxes are $2.7 billion higher than budget assumptions for 2016-17 and 2017-18 combined. In particular, our estimate of personal income tax (PIT) revenues for 2017-18 is $2.1 billion higher than estimates in the budget. Much of this difference relates to our assumptions concerning 2017 capital gains, which we discuss in our Fiscal Outlook report. Consistent with our assumptions about capital gains, we estimate a much larger 2017-18 “true up” transfer to the state’s rainy day fund. The larger transfer (deposit) to the rainy day fund is reflected as a reduction in revenues and largely explains the difference shown in the table for “other revenues and transfers.” Taking the rainy day fund deposit into account, we estimate that total revenues and transfers will be $1.1 billion higher than assumed in the June budget plan across 2016-17 and 2017-18 combined.
PIT Withholding Has Been Strong. In addition to our estimates of capital gains, we also see upside in PIT revenue from wage and salary income, which generally comes to the state in the form of withholding. PIT withholding growth has been consistently strong through the first ten months of 2017 and is 9% higher than across the same ten months of 2016. This growth is stronger than in all but two years since 2009, and suggests that wage and salary growth in some income groups could be stronger than overall wage and salary growth assumed in our economic scenario. For example, it is possible that wage and salary growth has been concentrated among higher earners who pay higher withholding rates.
Higher 2016-17 SUT Base Carries Into 2018-19 and Beyond. We estimate that sales and use tax (SUT) revenue was $24.9 billion in 2016-17—roughly the same as 2015-16 revenue. SUT revenue was flat in 2016-17 because Proposition 30’s temporary quarter-cent rate expired at the end of 2016. This mid-fiscal year rate cut likewise slows projected revenue growth between 2016-17 and 2017-18 from what it would have been absent the rate change. Our projections of SUT revenues are higher than assumed in the 2017 budget plan primarily due to higher-than-expected revenue in spring and summer of 2017. This had the effect of boosting 2016-17 revenue, and we assume this higher SUT base carries through into the later years of our revenue outlook.
Revenue Outlook
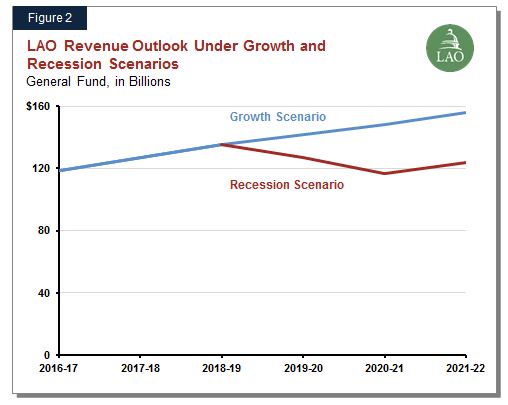
Comparison of Growth Scenario and Recession Scenario. Figure 2 compares our economic growth scenario with our recession scenario. Under our growth scenario, General Fund revenues and transfers grow from $127 billion in 2017-18 to $156 billion by 2021-22. This growth is consistent with our economic scenario, which is based on a consensus of economists and is provided to us by Moody’s Analytics, an economic consulting firm.
Our recession scenario is a hypothetical moderate recession, worse than the mild recession scenario we contemplated in our November 2016 Fiscal Outlook. We assume 10% year-over-year declines in both PIT and CT revenues in 2019-20 and 2020-21. This is accompanied by small losses of SUT revenue in each of those two fiscal years. General Fund revenue bottoms out in 2020-21 at $117 billion. In 2021-22, we assume that the economy begins to recover, and revenues increase to $124 billion. The revenue increase in that year is driven by the PIT, which we assume grows 6.5% over the 2020-21 level. See Chapter 2 of our Fiscal Outlook report for a description of the General Fund budget condition under these two revenue scenarios.
Follow @LAOEconTax on Twitter for regular California economy and tax updates.


