
Bottom Line: The chances of a downturn appear to be increasing, but it is too soon to draw firm conclusions.
Knowing when the state’s next budget slowdown will happen is impossible. Many economic factors outside the state’s control influence state revenues. Despite this, certain data points can help us understand whether shifting economic conditions are likely to lead to growth or declines in state revenues in the coming months.
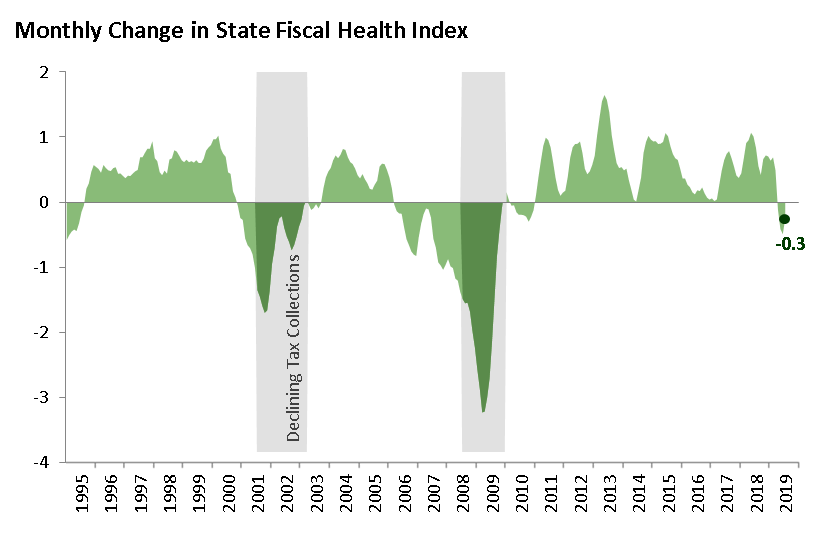
We created the State Fiscal Health Index to track the strength of economic conditions relevant to the state’s fiscal health. The index ranges from 0 (representing the lowest level in the last 25 years) to 100 (representing the highest level in the last 25 years). Both the level of the index and changes in the index from month to month offer information about the state’s fiscal health. When the index is high, revenues tend to be high compared to historical norms. Similarly, when the index is increasing, state revenues are likely to increase over the next six to twelve months. On the flipside, a consistent decline in the index over a few months has typically signaled that the state is entering an extended period of revenue weakness.
The figure below shows the index through July 2019. The index remained near historic highs in July.
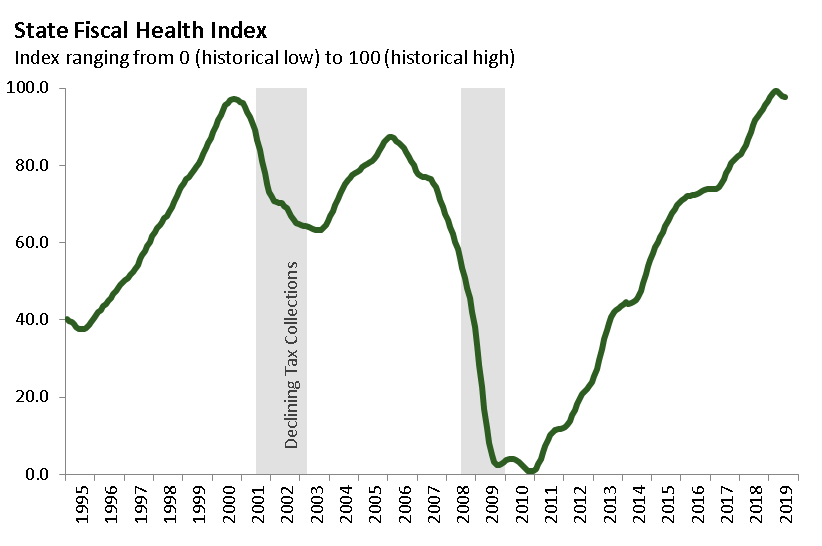
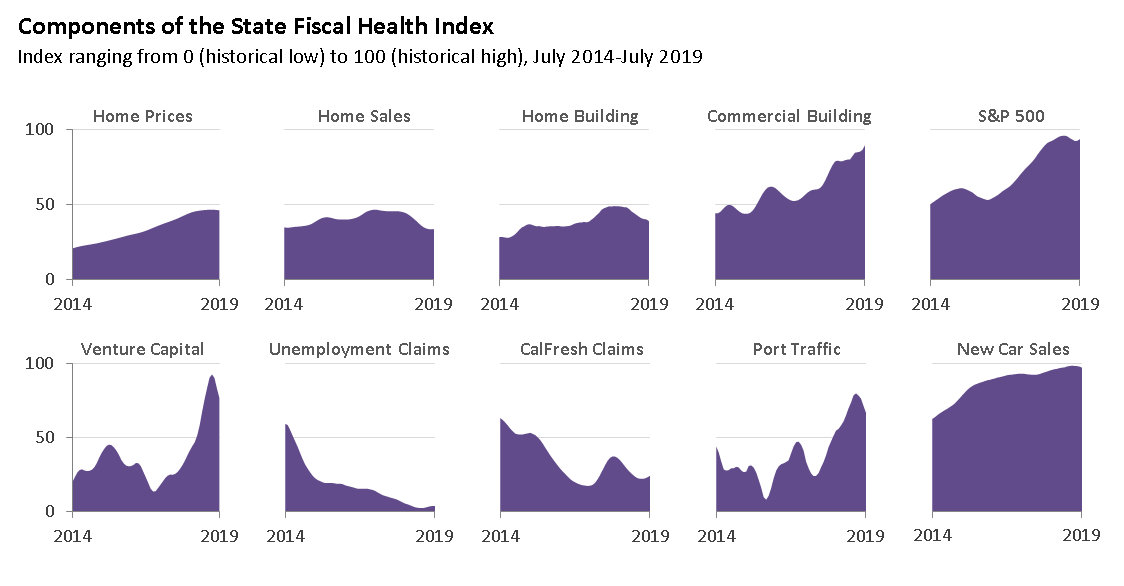
Although the index remains high, it has declined for four straight months. Declines of this magnitude have not been observed since the last recession. Weakness appears most pronounced in housing. In addition, new car sales (one indicator of the strength of consumer spending) have shown a pattern of decline throughout most of 2019. Most other indicators, while not outright declining, have stagnated. That being said, it is worth nothing that the magnitude of the index’s decline in July was smaller than the prior two months. Overall, it is too soon to draw any firm conclusions from recent patterns in the index, but each additional month of decline in index increases the risk that an economic slowdown is on the horizon.
The index combines ten key data points: home prices, home sales, residential and commercial building permits, the S&P 500 stock market index, venture capital funding, unemployment insurance claims, CalFresh claims, port traffic, and new car sales. With the exception of the S&P 500, all of this data is specific to California. An increase in these economics variables signals a more positive revenue situation, while a decline suggests a worsening revenue outlook. There are two exceptions to this pattern: claims for unemployment insurance and CalFresh. When claims for unemployment insurance and CalFresh decline this signals an improving revenue situation, while rising claims signal a worsening situation. The graph below shows the recent trends in these variables.
Note: Economic data are frequently revised following an initial release. In the coming months, we similarly may revise our index to reflect any changes in the underlying data.