Fiscal Outlook: Focus on Revenues
November 20, 2019
For other reports and posts related to our November 2019 Fiscal Outlook, see here.
Near-Term Revenue Estimates
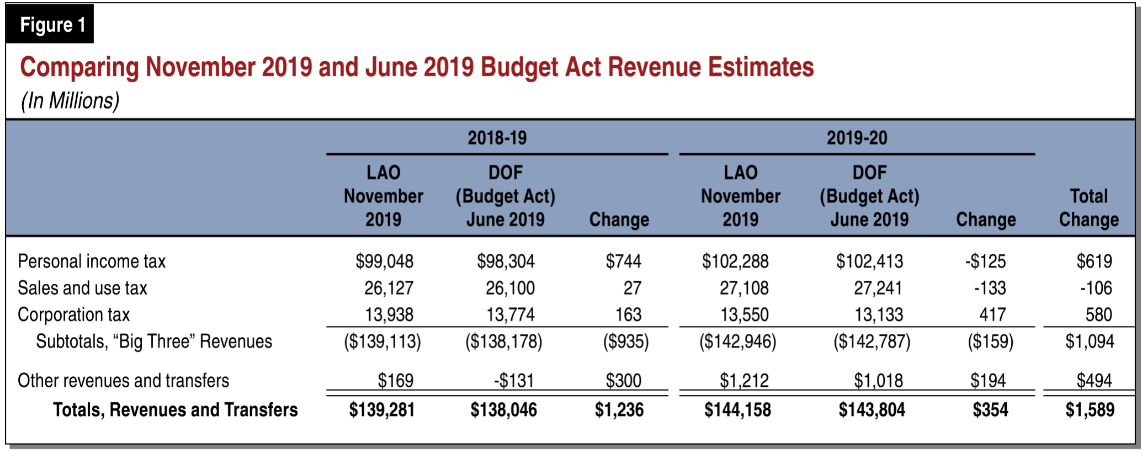
Higher Revenues Across 2018-19 and 2019-20. Figure 1 compares our November 2019 revenue estimates with the administration’s revenue estimates that were incorporated into the June 2019 budget package. As shown below, our estimates of the state’s largest three revenues—personal income tax (PIT), sales and use tax (SUT), and corporation tax (CT)—are just over $1 billion higher than budget assumptions across the two years. The largest source of this difference is in PIT revenues in 2018-19, which are almost $750 million higher. This higher estimate largely reflects higher receipts at the end of 2018-19.
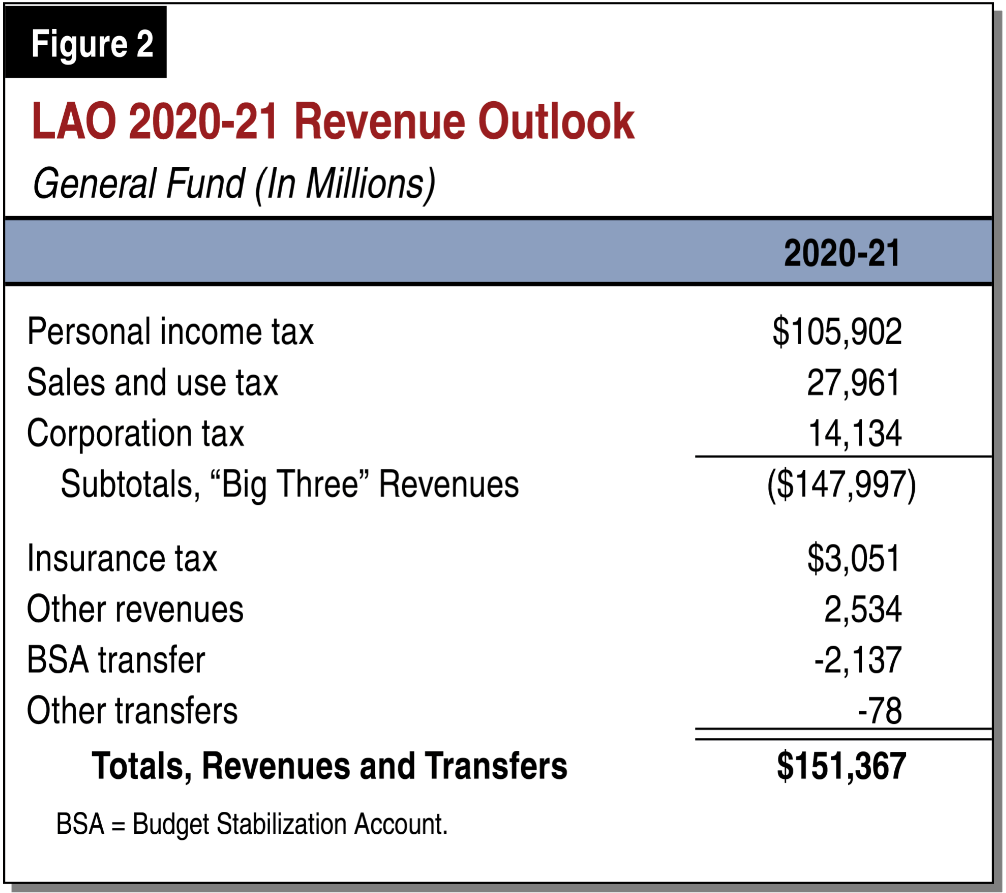
Changes in Transfers Result in Higher Revenues. Transfers into and out of the General Fund to other state funds are shown as revenues. Relative to June, we estimate the state will deposit less in constitutionally required transfers into the Budget Stabilization Account (the state’s main reserve fund) in 2018-19 and 2019-20. This is largely due to lower estimates of capital gains revenues. In addition, other transfers—which are principally repayments on loans from special funds—decline significantly from 2019-20 to 2020-21. This is because the state has now repaid all remaining special fund loans to the General Fund. (These transfers are reflected in Figure 2.)
Expect Revenues to Continue to Grow in 2020-21, but Somewhat Slower Than Previous Years. Revenues from California’s three largest taxes have increased 30 percent from 2012-13 to 2018-19 (in 2018-19 dollars). PIT revenues—driven by higher than average wage and asset price growth—have increased 33 percent over the same period. (Average annual growth has been 4.5 percent for the “big three” revenues, while PIT has grown almost 5 percent on average each year.) While we expect the economy to continue to grow in 2020-21, we expect revenue growth from PIT, SUT, and CT to slow, growing only 3.5 percent year to year. Our expectation for slower revenue growth largely is due to slower growth in wages and salaries. Figure 2 shows our estimates for 2020-21 and the rest of this post provides more detail on our estimates.
PIT Growth Has Slowed in Second Half of 2019. Revenue from PIT grew at a healthy 6 percent pace in 2018-19, but the early evidence suggests that growth will be much slower in 2019-20. In 2018-19, withholding grew 7 percent year over year. So far this year, however, withholding has grown 6 percent compared to same period in 2018. Moreover, estimated payments are almost 1 percent lower than the same period last year. (Tax filers who do not prepay most of their taxes through paycheck withholding must make quarterly estimated payments to the Franchise Tax Board. Many of these payments come from filers who receive a large share of their income from business income, capital gains, and other non-wage income.) The decline in estimated payments in part may be due to higher than normal receipts in 2018 due to a change in federal law. Specifically, certain taxpayers—those who receive income through S corporations, limited liability companies, and partnerships—may have delayed the realization of 2017 income in order to take advantage of lower federal tax rates that went into effect in 2018. This may have resulted in a one-time bump to revenues in 2018 that will not be repeated in 2019. Consequently, we estimate PIT growth to be 3.3 percent in 2019-20.
Slower PIT Growth Expected to Continue. We expect PIT revenues to grow by 3.5 percent from 2019-20 to 2020-21. Taxable income from capital gains is expected to remain high but relatively flat, as stock prices are projected to grow at a slower pace than in recent years. Taxable wages and salaries also are expected to grow at a slower pace starting in 2020, as the rapid pace of wage growth in the state’s technology sector and supporting industries slows modestly compared to the recent past.
SUT Projections in Line With Budget Act. Under our economic growth scenario, SUT revenues would grow by 3.8 percent in 2019-20, yielding $27.1 billion—very close to the $27.2 billion assumed in the 2019-20 Budget Act. In this scenario, annual SUT revenue growth would be roughly 3 percent in 2020-21 through 2022-23. These growth rates are due primarily to our assumption of roughly 4 percent personal income growth.
Strong CT Revenue Growth May Slow Later This Year. CT revenue growth was strong in 2017-18 and 2018-19—16.1 percent and 13.3 percent, respectively, despite relatively low growth in corporate profits. Similar to other PIT filers with business income, these high rates of growth may be attributable to corporations delaying the realization of 2017 income due to lower federal tax rates in 2018. While strong CT collections continued through the first half of 2019, we expect this trend to slow down as the effects of the federal tax law change dissipate. (This explains why we expect CT revenues to decline by 2.7 percent in 2019-20.) That said, we expect CT collections to grow 4.3 percent in 2020-21 due to continued corporate profitability under our economic growth scenario.
Revenue Outlook
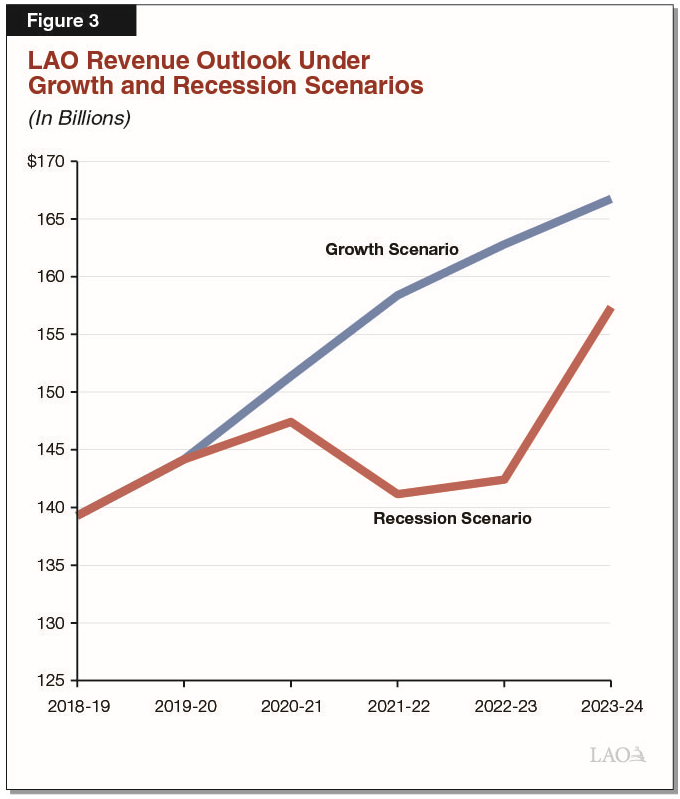
Comparison of Growth and Recession Scenarios. Figure 3 compares our revenue estimates under our economic growth scenario and our recession scenario. Our economic growth scenario is based on the consensus forecast as compiled by Moody’s Analytics. Under our growth scenario, General Fund revenues and transfers grow from $144 billion in 2019-20 to almost $167 billion in 2020-21. Our recession scenario begins in January 2021 and reflects a typical post-World War II recession in California. The resulting revenue loss—relative to the economic growth scenario—from this recession would be just over $50 billion over about three years.