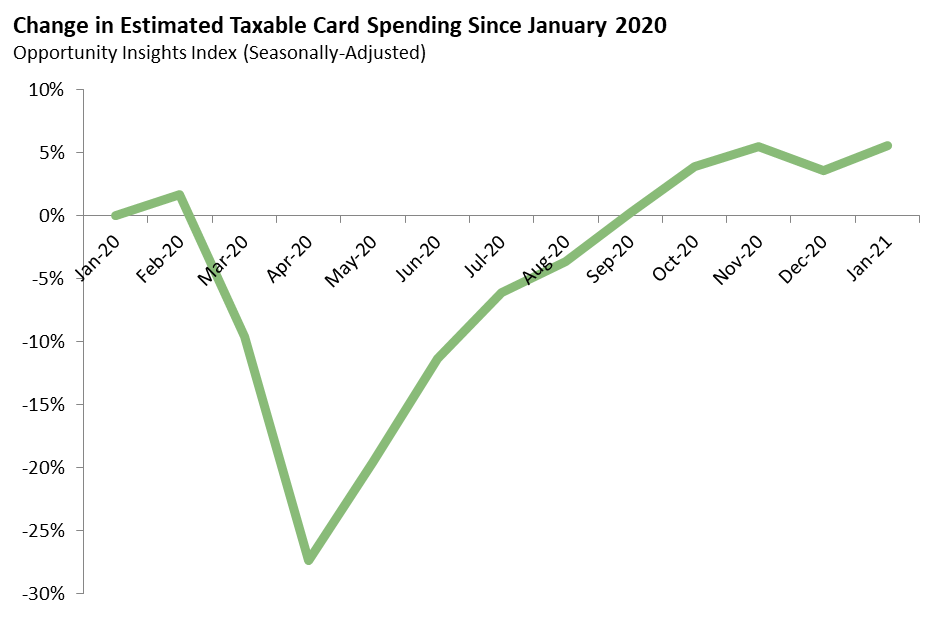
As described in an earlier post, we are using credit and debit card spending data provided by Opportunity Insights to track sales tax trends in California. To do this, we use an index—a weighted average of different spending categories—designed to track movements in California’s sales tax base. In this post, we update the index to include January data and to incorporate data revisions for earlier months.
Card Data: Growth Resumed in January. After declining by two percent in December 2020, the spending index grew by two percent in January 2021 (seasonally adjusted). As shown in the figure below, spending remained higher than it was in January 2020.
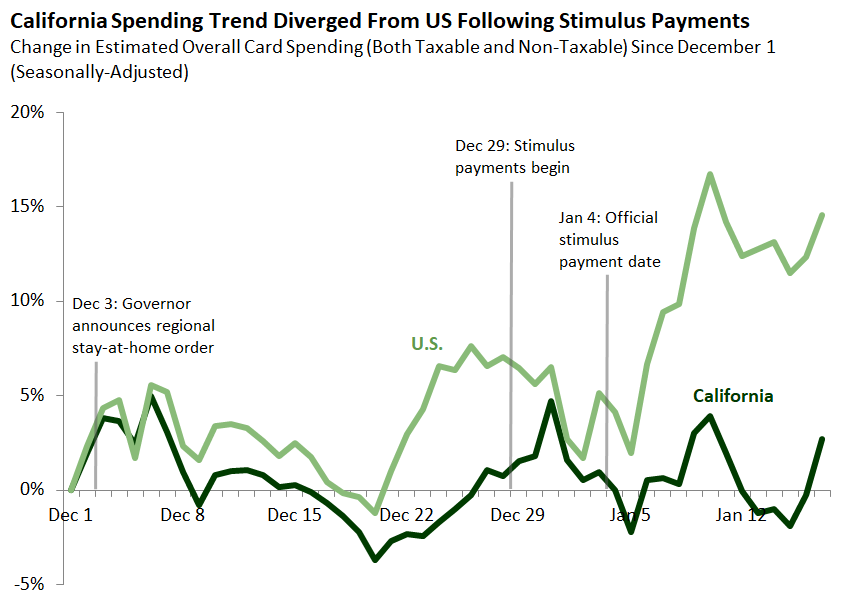
Apparent Response to Stimulus Much Weaker in California Than in Other States. The figure below displays daily overall card spending for California and for the U.S. as a whole from December through mid-January. The figure notes some key events during this period, including a round of federal stimulus payments. U.S. card spending increased substantially after the stimulus, while California card spending did not change much. Although this simple comparison is far from definitive, it suggests that the spending response to the stimulus might have been much weaker in California than in other states—perhaps due to the dire public health conditions and stay-at-home orders in place at the time.