
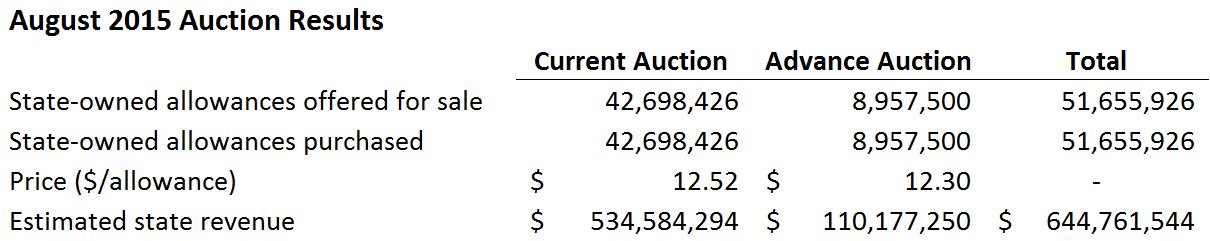
On August 25, 2015, the state released summary results from the cap-and-trade auction conducted on August 18, 2015. Based on the summary results, the state will collect $645 million in cap-and-trade auction revenue from the August auction. The auction included 2015 allowances (sold at the current auction) and 2018 allowances (sold at the advance auction). (The actual amount of state revenue will be determined in a few weeks and will depend on the future exchange rate between U.S. dollars and Canadian dollars. Please see summary results for more details on the process for collecting proceeds.)
Revenues Tracking Slightly Higher Than Most Recent Estimate From Administration. The August auction is the first of four quarterly auctions scheduled in 2015-16. The Governor’s May Revision assumed $2 billion in revenue in 2015-16. However, the 2015-16 budget does not include a revenue assumption for 2015-16, as well as an expenditure plan for auction revenue that will not be continuously appropriated based on existing state law. (The Legislature and the Governor report that they will decide on additional cap-and-trade funding allocations in separate legislation.) If the remaining three auctions have similar results to the August auction, state revenues will be several hundred million dollars higher than the $2 billion assumed in the Governor’s May Revision. It is important to note that future auction prices and revenues are subject to uncertainty due to many different factors, including changes in economic conditions and policy changes.
Comparison to Prior Auction Results. Generally, the results from the August auction are similar to results from the two prior auctions—allowance prices were near the minimum price and all of the allowances offered for sale were purchased. Below, we provide some additional context for the August auction results.
-
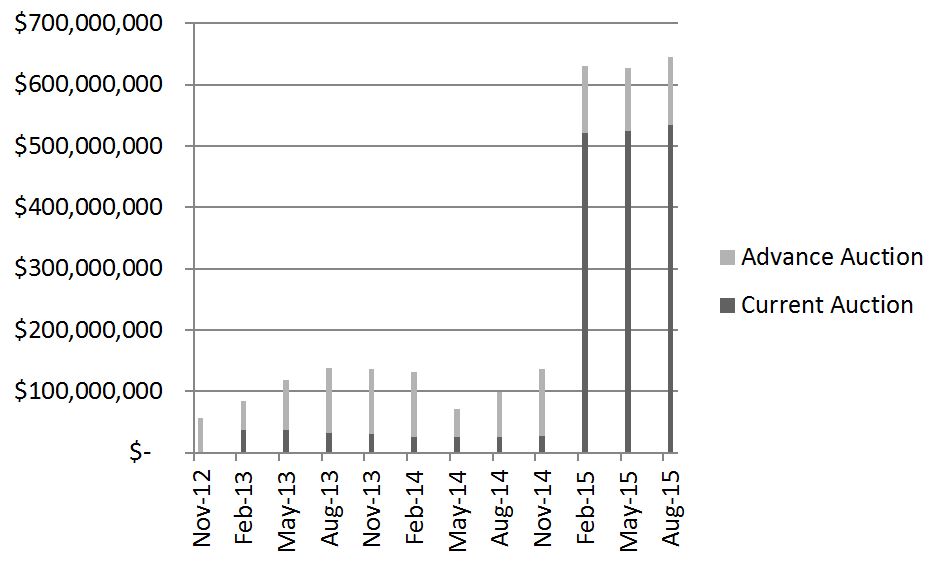
Significant Revenue Increase in Recent Auctions. The amount of state revenue collected from the August auction will likely be similar to the revenue collected from the most recent two auctions (nearly $20 million, or 3 percent, higher than the May 2015 auction). However, as illustrated in the figure below, state revenue from the last three quarterly auctions is significantly higher than prior auctions. The average revenue over the most recent three auctions exceeds $600 million, compared to an average of about $100 million in the prior three auctions. This increase is the result of a significant increase in the number of allowances offered and purchased (discussed below).
-
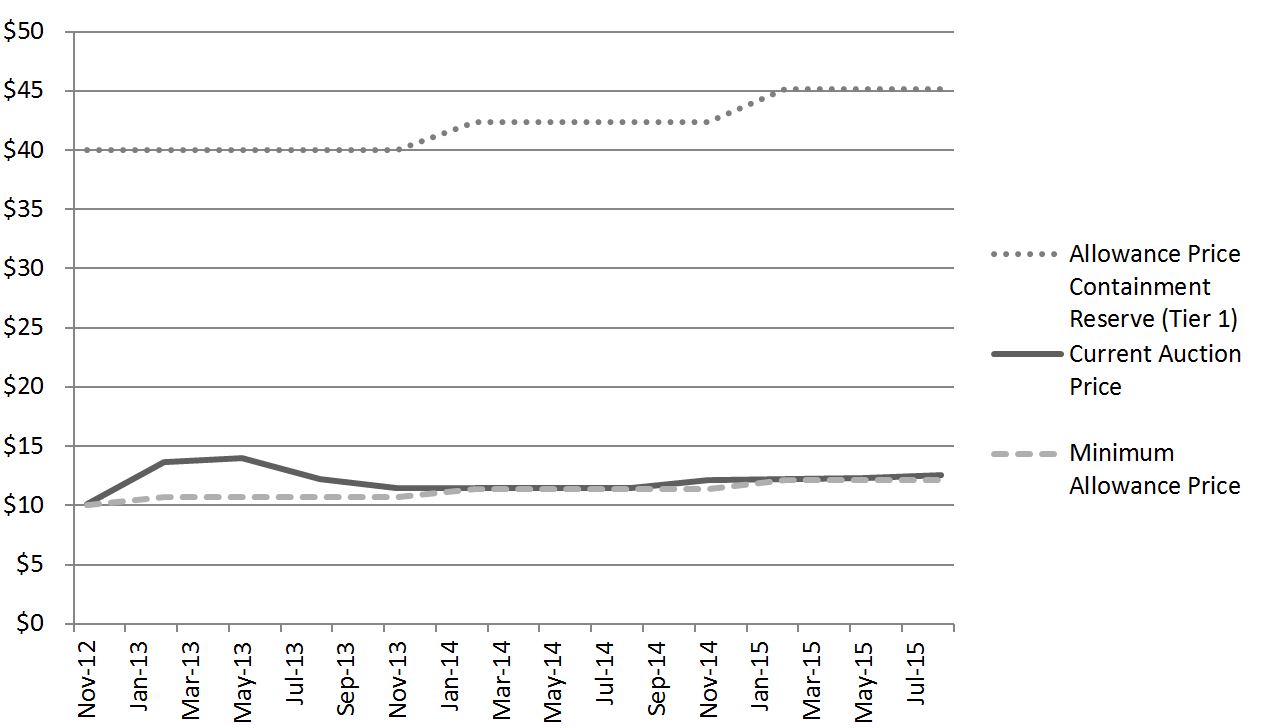
Prices Remain Near Minimum Level. As shown in the figure below, allowance prices continue to be relatively close to minimum prices established by the state. Prices are substantially less than allowance prices for Tier 1 of the allowance price containment reserve. (The allowance price containment reserve contains allowances that are available to be purchased at predetermined prices. It is intended to be a “release valve” to moderate potential spikes in allowance prices above a certain threshold. See here for more detail.)
-
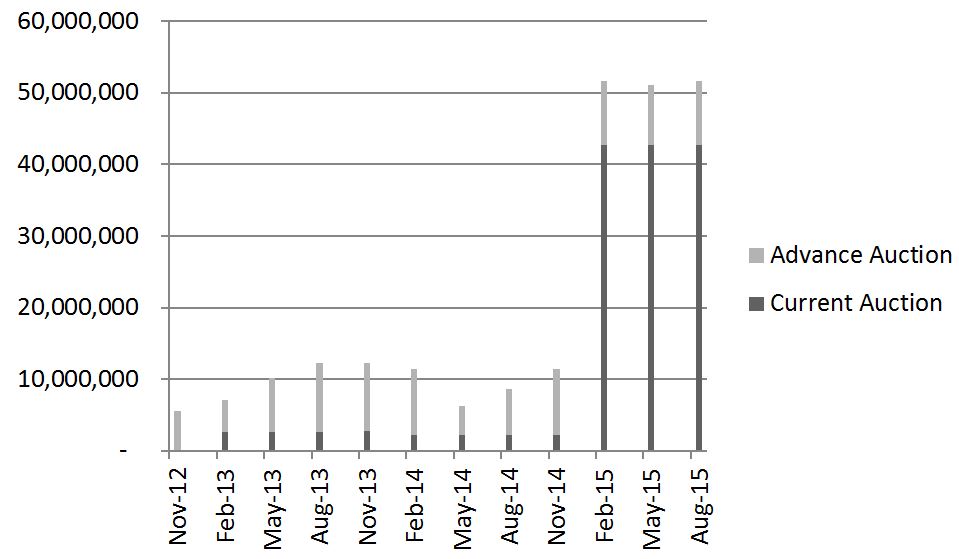
Significant Increase in The Number of State Allowances Sold. While allowance prices have remained relatively close to the minimum price over the last couple of years, the number of state-owned allowances offered for sale, and subsequently purchased, has increased substantially in recent auctions, as illustrated below. This increase is driven primarily by including transportation fuels under the cap beginning January 2015 and auctioning the additional allowances rather than giving them away for free. Prior to including transportation fuels under the cap, the state gave away the vast majority of the allowances to utilities or private industrial emitters.
What is the Difference Between the Current Auction and the Advance Auction? The current auction included 2015 vintage allowances and the advance auction included 2018 vintage allowances. The vintage year indicates when the allowance can be used to comply with the cap-and-trade regulation. For example, a 2015 vintage allowance can be used to cover an entity’s emissions in 2015 or a later year, but it cannot be used to cover emissions that occurred in 2014. Similarly, a 2018 vintage allowance cannot be used to cover emissions that occurred prior to 2018.