
On September 23, the U.S. Bureau of Economic Analysis (BEA) released initial data on 2014 gross domestic product (GDP) in the nation's metropolitan areas. GDP, a broad measure of the size of an economy, is an estimate of the value of goods and services produced in a region. In 2014, real (inflation-adjusted) GDP for the U.S. as a whole is estimated to have expanded by 2.4%. For California as a whole, real GDP expanded by an estimated 2.8% in 2014.
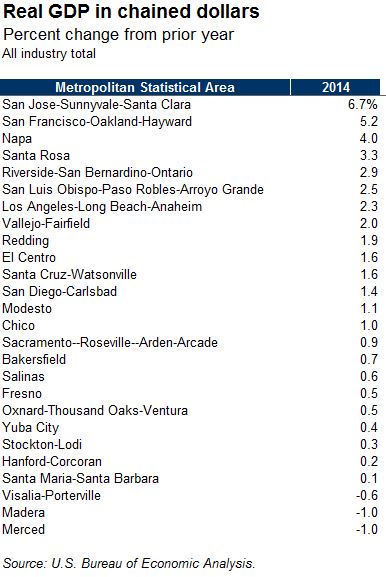
Bay Area Led California Economic Expansion in 2014. As shown above, California's real GDP growth was led by robust economic expansion in the Bay Area, where the 6.7% real GDP growth in the San Jose metropolitan region (consisting of Santa Clara and San Benito Counties) led the western U.S. Among all of the nation's 381 metropolitan statistical areas (MSAs), the San Jose MSA ranked 9th in terms of its real GDP growth rate in 2014, trailing Midland (Texas), San Angelo (Texas), Lake Charles (Louisiana), Greeley (Colorado), Wheeling (West Virginia), Dallas-Fort Worth-Arlington, Bismarck (North Dakota), and Victoria (Texas). While most of those regions have a connection to the oil and gas sector (which was strong until the drop in oil prices in late 2014), the San Jose region's growth was driven by increased economic activity in durable goods manufacturing (a sector that includes computer and electronic products manufacturing) and two technology-focused sectors in the Silicon Valley, professional/business services and information. Many jobs in these sectors are high-paying, and these industries export goods and services that bring money to California firms from out of the state.
The San Francisco-Oakland MSA (San Francisco, Alameda, San Mateo, Contra Costa, and Marin Counties) ranked 26th among the 381 MSAs in terms of the growth rate of real GDP in 2014. Professional/business services and information fueled the bulk of the San Francisco-Oakland region's growth in 2014, with a significant contribution from the financial services sector. The nearby Napa (Napa County) and Santa Rosa (Sonoma County) MSAs were the only other two California metropolitan regions with 2014 real GDP growth above 3%.
Four California MSAs Rank Among the Top 20 Largest Economies Nationally. As measured in current dollars, the San Francisco-Oakland MSA discussed above is the 7th largest MSA nationally at $412 billion, while the San Jose MSA ranks 19th at $214 billion. Combined, these two Bay Area MSAs make up 27% of California's $2.3 trillion state economy. The Los Angeles-Long Beach-Anaheim MSA (Los Angeles and Orange Counties), however, is the nation's 2nd largest, following New York-Newark, with $867 billion of GDP that makes up 37% of California's economy. The San Diego MSA (San Diego County) ranks 20th in the nation, with a $207 billion GDP (9% of California's total). Combined, therefore, these four large MSAs produce 74% of California's goods and services.
Three Central Valley MSAs With Declining Real GDP in 2014. The BEA data indicates that the economies of the Madera (Madera County), Merced (Merced County), and Visalia-Porterville (Tulare County) MSAs shrunk in real terms last year. For each of these regions, the BEA data shows that real declines in natural resources and mining were the key factors behind the overall real GDP decline. Specifically, in the agriculture and forestry sector, BEA reported around a 7% real decline in output from 2013 to 2014 in the Visalia area. (Less data is available for that sector in the Madera and Merced regions, as BEA refrains from displaying data that could disclose confidential proprietary information for a small number of businesses.)