For other reports and posts related to our November 2018 Fiscal Outlook, see here.
Property Taxes and the State Budget. Although the state receives no revenue from local property taxes, these taxes affect the state budget. State funding requirements for schools are met through a combination of property taxes received by schools and state General Fund dollars. As a result, when school property taxes increase (decrease), state general fund spending on schools typically decreases (increases).
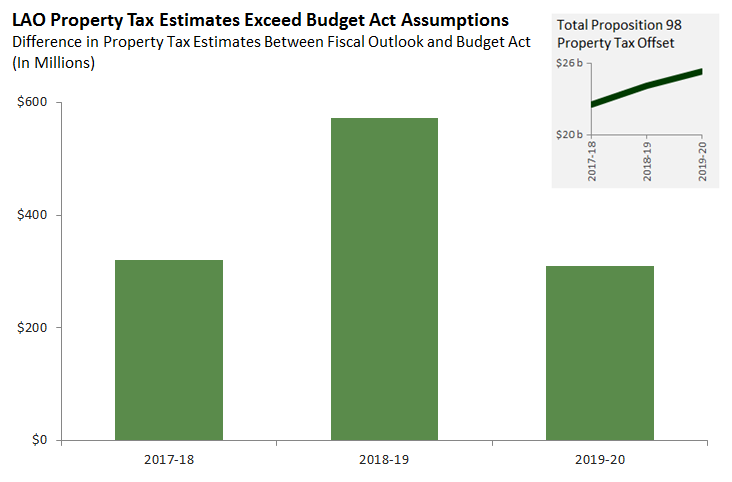
Our November 2018 Fiscal Outlook projects school property taxes will be higher than assumed in the 2018-19 Budget Act. We estimate that across the three-year budget window (2017-18 to 2019-20) school property taxes will be up $1.2 billion. Should property tax revenues meet our higher projections, more state General Fund dollars will be available for new commitments or additional reserves.
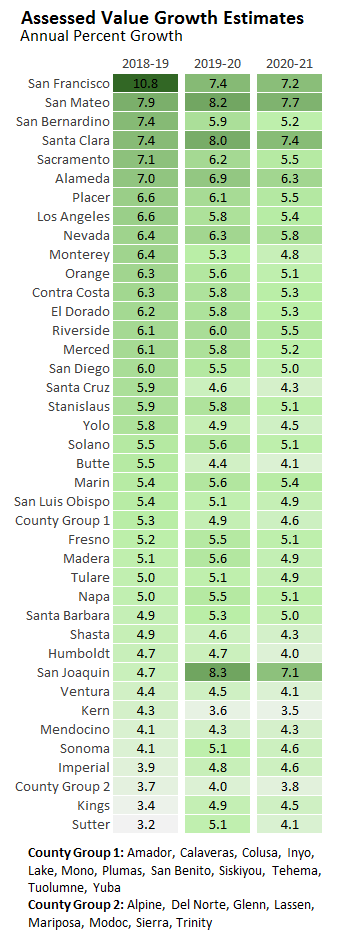
Property Taxes to Local Governments. In addition to affecting the state budget, property taxes are a primary revenue source for most local governments. Growth in local government property tax revenue is driven by growth in the taxable value of property—or assessed value. While the focus of our forecast is to estimate assessed value growth at the statewide level, our model allows us to produce estimates of assessed value growth for each county. The table below displays these estimates. Although our county estimates are not as refined as our statewide estimates, local governments may nonetheless find these numbers helpful as a point of comparison for estimates produced by others with more localized information.
As the table shows, assessed value growth is uneven across the state. Values in rapidly growing areas—primarily in the Bay Area—are projected to rise at twice the rate of slowly growing areas—such as Butte, Kern, and Shasta Counties. Regardless of these differences, however, we expect most counties to see a slowing of growth over the next couple years. Statewide we expect assessed value growth to tick down from 6.5 percent in 2018-19 to 6.1 percent in 2019-20 and further to 5.4 percent in 2020-21.
How Do We Forecast Assessed Value Growth? Three factors drive growth in assessed values:
- New Construction. When new buildings are constructed on a property, the county assessor adds the value of these building to the property’s assessed value. New construction, therefore, increases assessed values.
- Property Sales. Property taxes are based on a property’s purchase price. In the year a property is purchased, it is taxed at its purchase price. Each year thereafter, the property’s assessed value is adjusted for inflation (up to 2 percent). This continues until the property is sold and again is taxed at its purchase price. The assessed values of most properties fall below their market values in most years because market values usually grow by more than 2 percent per year. Because of this, without property sales—causing those properties’ assessments to reset to market value—increasing market values would not translate into growth in property taxes.
- Real Estate Prices. Increases in prices for homes and other properties amplify the effects of new construction and property sales on assessed value growth. When prices are higher, new construction is assigned a higher assessed value. Similarly, when prices are higher, the assessed values of recently sold properties are reset to higher levels.
To forecast assessed values, we use past data to measure the relationship between assessed value growth and new construction, property sales, and prices. Next, we develop forecasts of new construction, property sales, and home prices for each county. (In separate posts, we provide more detail on our forecasts of new construction and home prices.) Finally, we use our estimates of the relationship between assessed value growth and the three factors along with our forecasts of the three factors to estimate future assessed value growth. For example, we estimate that each dollar of permitted construction increases assessed values in the following year by $0.85. If we forecast that a county will have $10 million in new construction, this would lead to an assessed value increase of $8.5 million in the next year.


