
2021-22 Fiscal Outlook Revenue Estimates
November 18, 2020
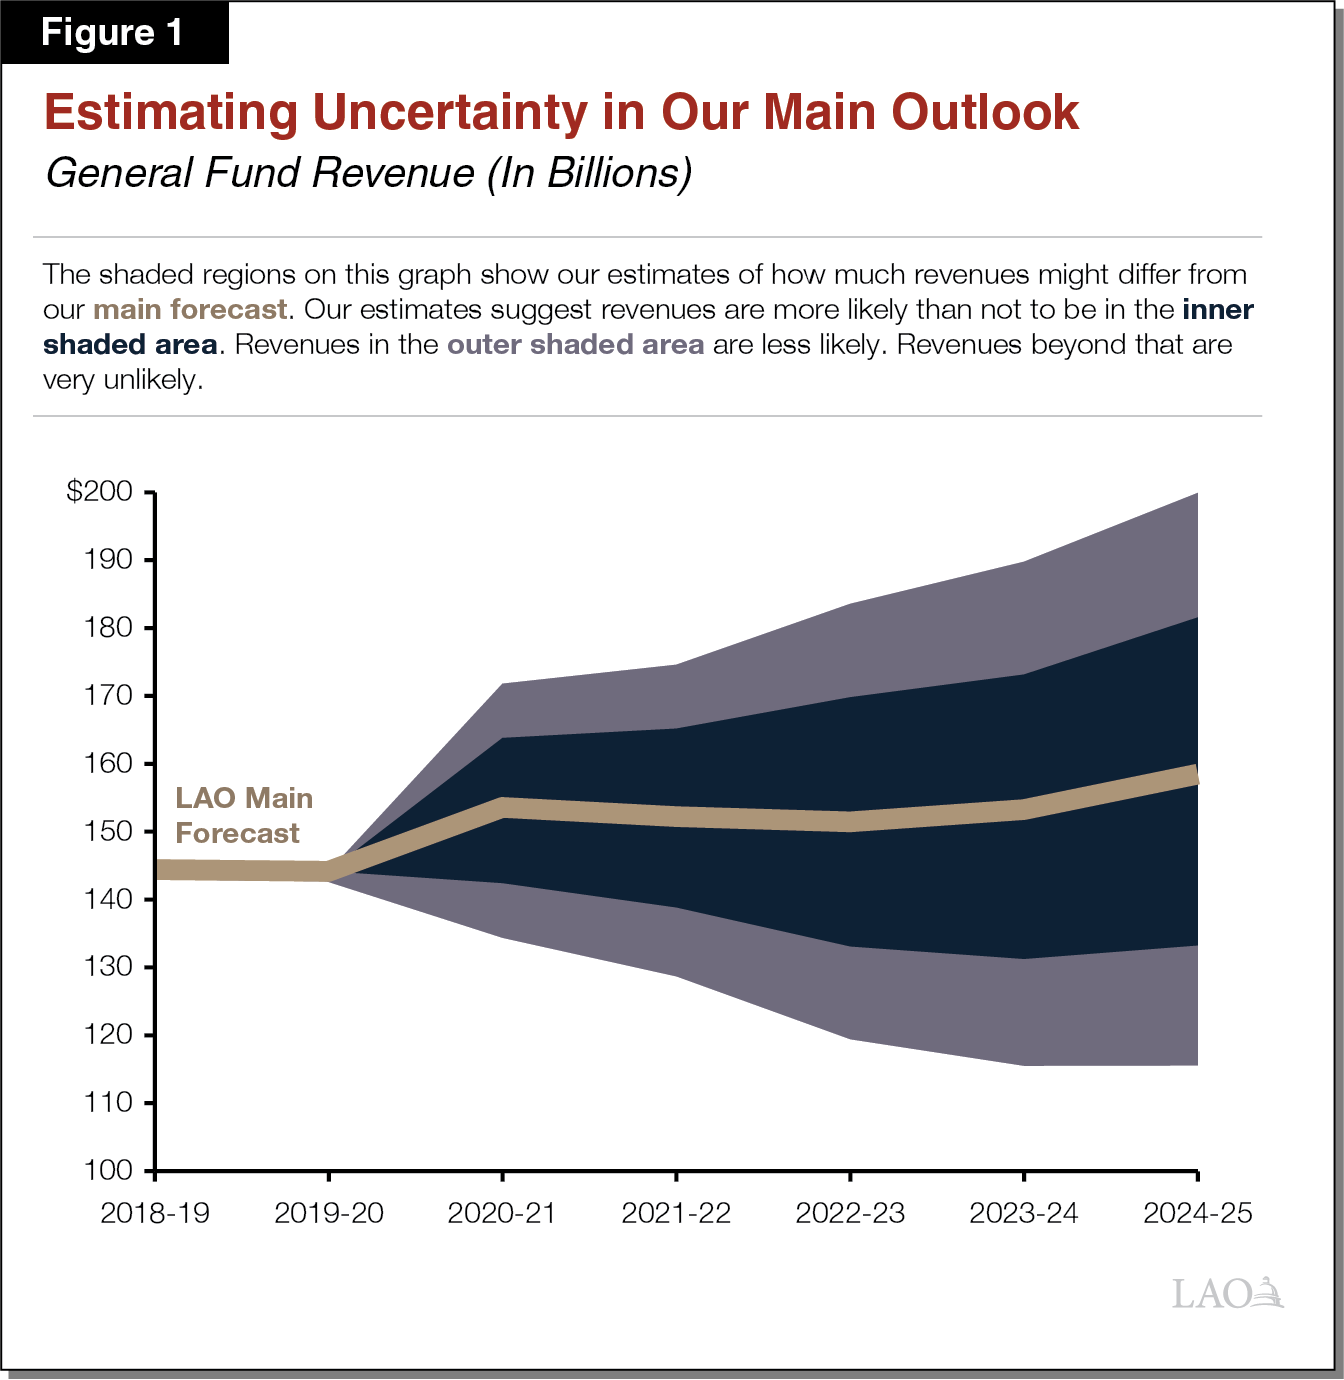
In The 2021-22 Budget: California’s Fiscal Outlook, we discussed how the state faces unprecedented uncertainty about its economic future. As a result, a wide range of General Fund revenue outcomes are possible in 2020-21 and beyond. Figure 1 shows our estimates of the breadth of these possible outcomes. Despite this uncertainty, the Legislature must select a single set of revenue assumptions around which to build the state’s budget. For this purpose, our main forecast provides our best assessment of the most likely revenue outcome.
Main Forecast Includes Strong Growth in 2020-21, Slow Growth After That. Figure 2 below shows the revenue estimates under our main forecast. We estimate that total General Fund revenues (excluding transfers and federal cost recovery) will grow at a relatively strong rate (7 percent) between 2019-20 and 2020-21. A large part of this growth is explained by a revenue accelerating action in the 2020-21 Budget Act (Budget Act) which limited corporation taxpayers’ use of tax credits and net operating loss deductions for three years. Beginning in 2021-22 and continuing through the remainder of our outlook, we project that revenues will grow much more slowly—only about 1 percent per year.
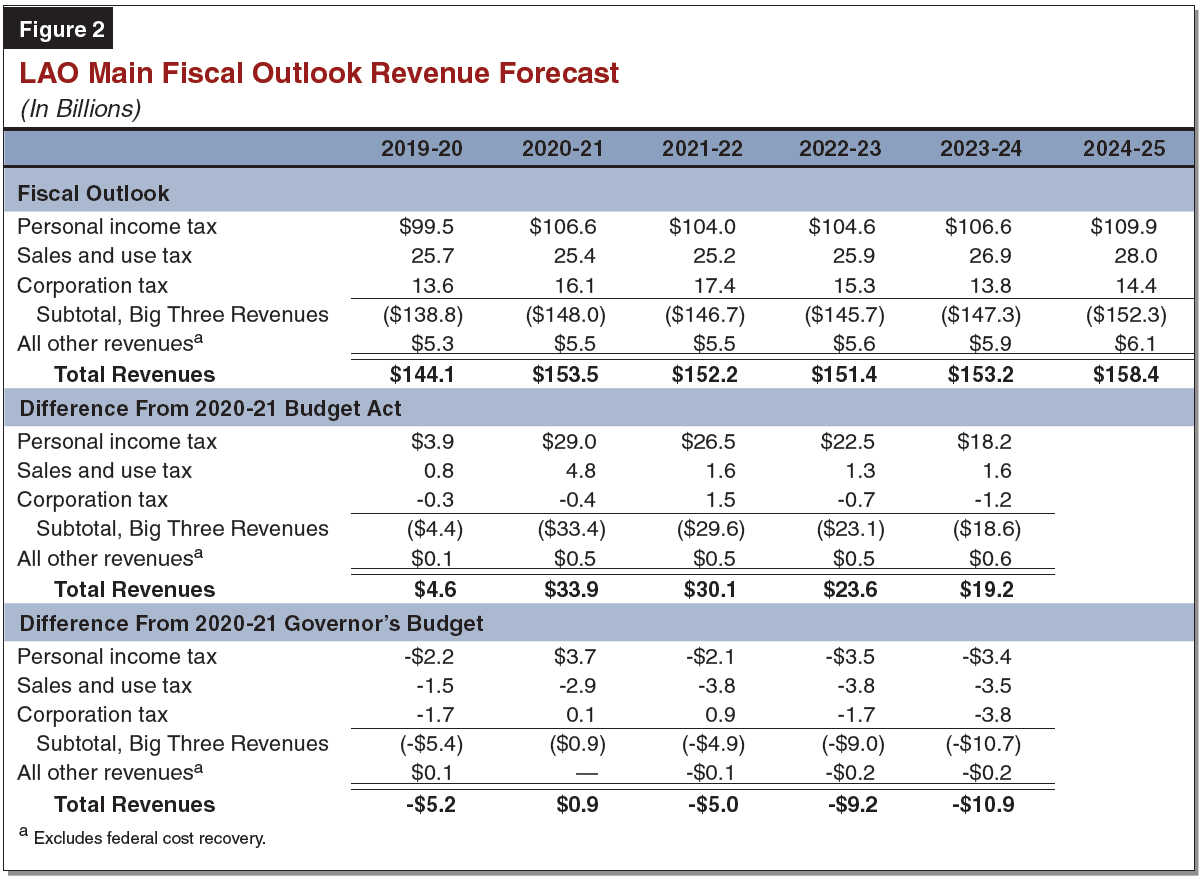
Revenues Now Expected to Be Well Above 2020-21 Budget Act. Our main forecast is higher than Budget Act revenue assumptions by $38.5 billion across 2019-20 and 2020-21. Further, our estimates are $30 billion above the Budget Act in 2021-22 and around $20 billion higher in 2022-23 and 2023-24.
Despite Improvements, Forecast Remains Below Pre-Pandemic Expectations. Our main forecast remains about $4 billion below 2020-21 Governor’s Budget revenue assumptions across 2019-20 and 2020-21. (The 2020-21 Governor’s Budget was developed before the global spread of COVID-19.) Further, our estimates are $5 billion below the Governor’s Budget in 2021-22 and around $10 billion below in 2022-23 and 2023-24.
Below we provide further detail on our main forecasts for the state’s “Big Three” taxes—personal income, corporation, and sales taxes.
Personal Income Tax
PIT Revenue Should Exceed 2019-20 Levels For Next Few Years. State revenue from the personal income tax (PIT) has held up well so far despite the severe economic recession. The current estimate for PIT revenue (General Fund only) in 2019-20 is $97.9 billion, barely 1 percent below the 2018-19 figure of $99.0 billion. We expect revenue to increase over the forecast period, as we detail below.
Projected PIT Revenue More Than a Third Above Budget Act Figures. The Budget Act projected that PIT revenue would be $77.6 billion in 2020-21 and $77.5 billion in 2021-22. Based on recent trends in revenue, incomes, and asset prices, we now project that the PIT will generate $106.6 billion in 2020-21 and $104.0 billion in 2021-22. We then forecast a gradual return to growth beginning in 2022-23, with PIT revenue reaching $110 billion by 2024-25.
Withholding Has Shown Surprising Strength. Employers are required to make regular income tax withholding payments on their employees’ wages and salaries, bonuses, and stock options. Withholding collections so far in 2020-21 have been 10 percent above the same period in 2019-20, reflecting strong income gains among high-earning workers especially in the tech sector. This, in turn, reflects a recent flurry of companies making initial public offerings, which typically create significant new income and wealth for employees of those companies. While we expect this pace to moderate, withholding should continue to outperform relative to job growth.
September Estimated Payments Exceeded 2019 Level. Upper-income taxpayers who have income from sources not subject to withholding (capital gains, business income, dividends, interest, rent) are required to file quarterly payments reflecting the income they expect to earn over the course of the year. April, June, September, and January usually are the biggest months for estimated payment collections, although this year the April and June payment deadlines were extended to July due to the pandemic. Estimated payments from February to August of this year (corresponding to the 2020 tax year) were 25 percent below the same months in 2019, but September collections were 11 percent above September 2019. We believe this reflects recent improvement in filers’ expected income from business activities and capital gains in particular. We expect this upward trend to continue.
Stock Prices Have Recovered From Winter Plunge. Stock prices are the key driver of revenue from capital gains, a large and highly volatile source of taxable income. The pandemic initially sent the Standard and Poor’s 500 Index (S&P) tumbling from a high of 3,380 in early February to a low of 2,305 in mid-March. When the Budget Act estimates were finalized, the S+P still sat below 3,000. It has since recovered to above 3,500 and we assume it will remain near or above 3,300 throughout the forecast period. Should that assumption hold, it would sustain a relatively high level of income from capital gains going forward.
Corporation Tax
Corporation Tax Revenues Higher in 2020-21. Corporation tax (CT) revenues for 2019-20 totaled an estimated $13.6 billion, about 3 percent lower than the previous fiscal year. Recently enacted limits to tax credits and net operating loss deductions (NOLs) will accelerate revenue from future years, boosting CT revenues higher to $16.1 billion in 2020-21 and $17.4 billion in 2021-22. CT revenues then decline steadily over the forecast period because of increased use of credits and NOLs after the limitations expire.
Budget Act Projected Large Decline in CT Revenues for 2021-22. Our forecast for 2021-22 is 24 percent higher than the Budget Act projection of $14.1 billion. Our forecast reflects a more positive outlook for corporate profits in 2021 and beyond. This improved outlook for profits is consistent with a better-than-expect bounced back in Gross Domestic Product in the third quarter of 2020 and also reflects the consensus among economic forecasters, as discussed below.
Corporate Profits Declined in 2020 but Expected to Recover in 2021. The consensus economic forecast (which reflects the average among various professional economists) projects that national corporate profits will decline by 13 percent in 2020 before fully recovering over 2021 and 2022. Corporate profits are then forecast to steadily increase over the following years by about 3 percent annually, or just slightly faster than inflation. Over the past several months, estimated corporate tax payments have been stronger than might be expected based on corporate profit forecasts. If actual corporate profits are weaker than recent tax collections suggest, corporations may file for larger than expected refunds in 2021.
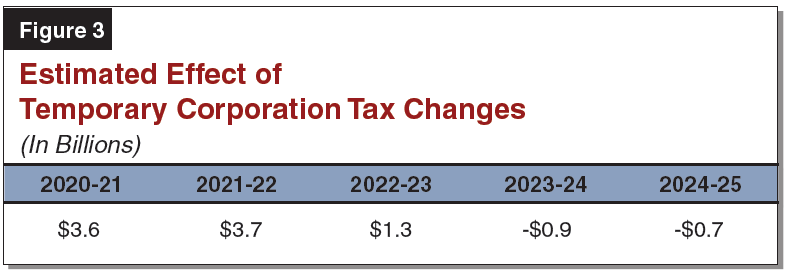
Temporary Limits on Credits and NOLs Accelerate CT Receipts. The 2020‑21 budget package limited for three years tax credit and NOL provisions that some corporations may otherwise use to reduce their taxes. Figure X shows our estimated fiscal year effects of these temporary limits over the forecast period. Our estimate of the impact of these limits is somewhat different from the administration’s, reflecting our higher estimate for corporate income. The limits on use of credits and NOLs expire in 2023. While the limits are in place, corporations will accumulate credits and NOLs to use beginning in 2023. The use of these accumulated credits and NOLs will reduce the net CT revenue gain in 2022-23. Further, we estimate that CT revenues will be nearly $1 billion lower beginning in 2023-24 than they would have been otherwise.
Sales and Use Tax
Slight Sales and Use Tax (SUT) Declines Through 2021-22. Current estimates indicate that General Fund SUT revenue declined slightly from $26.2 billion in 2018-19 to $25.7 billion in 2019-20. Our short-term forecast includes further slight declines, with revenues dropping to $25.4 billion in 2020-21 and $25.2 billion in 2021-22.
Growth in 2022-23 and Beyond. We project annual SUT growth of 2.8 percent in 2022-23, accelerating to 4 percent in 2023-24 and 2024-25.
SUT Forecast Higher Than Budget Act. In total, our SUT projections from 2019-20 through 2021-22 are $7.2 billion above the amount assumed in the Budget Act. Our projections for 2022-23 and 2023-24 are $1.3 billion and $1.6 billion higher than the Budget Act, respectively.
Monthly Revenue Data Higher Than Budget Act. The improved SUT outlook is due, in part, to better-than-expected monthly SUT collections. Total SUT collections from April through October 2020 were $2.7 billion higher than assumed in the Budget Act.
Card Data: Spring Drop in Spending Very Large But Short-Lived. Our forecast also draws upon data from credit and debit cards. These data suggest that spending on taxable goods declined precipitously early in the spring, dropping to 73 percent of pre-pandemic levels in April. Starting in May, however, spending grew for six straight months. By October, estimated spending on taxable goods had recovered to roughly 99 percent of pre-pandemic levels. The Budget Act did not anticipate such a rapid recovery. This rebound in taxable spending seems to be consistent with two economic observations. First, our forecast for personal income in the third quarter of 2020 is close to pre-pandemic levels. Second, consumers appear to have shifted some of their spending towards taxable goods and away from other purchases, such as travel.