
The Federal Reserve Bank of Philadelphia produces a monthly "coincident index" for each of the 50 U.S. states. As the bank describes on its website, the coincident index combines four state-level employment and wage indicators to summarize current economic conditions in a single statistic. "The trend for each state's index is set to the trend of its gross domestic product (GDP), so long-term growth in the state's index matches long-term growth in its GDP," the website notes. The model is consistent across the 50 states, so the state indexes are comparable to one another.
3-Month Index: California Remains in Top Tier of States. As shown below, the Philadelphia Fed's key cross-state display is its monthly map of the last three months' change in the coincident index by state. California is colored dark green on the map (indicating a three-month change of greater than 1%), the highest growth category, in today's March coincident index report. California has been in this highest-growth category since the beginning of 2015, an improvement from the under 1% growth shown in the map for almost all of 2014. Specifically, the Philadelphia Fed's detailed data shows that California's index is up 1.3 percentage points since December, trailing the growth rates in Oregon (3.0%), Michigan (2.3%), Idaho (2.1%), Maine (1.7%), Utah (1.6%), Montana (1.4%), and Vermont (1.4%). As shown in the map below, as of March, the three-month change in the coincident index was up in 46 states (shown in shades of green below), down in 3 states (West Virginia, Alaska, and Pennsylvania, shown in red or pink below), and unchanged (gray) in Oklahoma.
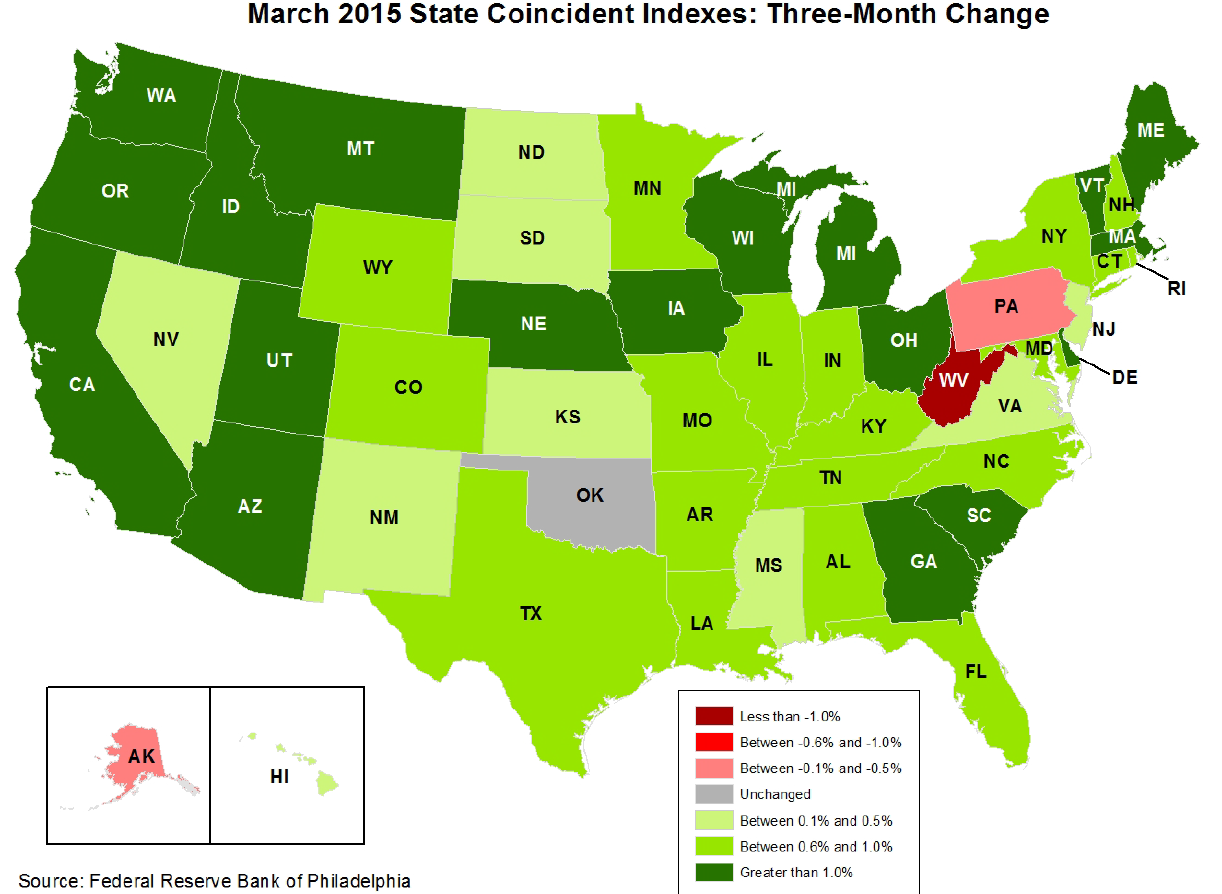
Weakness in Other Major Oil-Producing States? The Calculated Risk blog notes that "during the worst of the recession, the map [above] was all red," but now it "is almost all green again." (That blog includes a graphic showing the number of states with increasing coincident indexes on a monthly basis going back several decades.) Calculated Risk notes that weakness is now apparent in this data for "several oil producing states including Alaska and Oklahoma," adding "it wouldn't be surprising if North Dakota, Texas, and other oil producing states also turned red later this year." (We discussed the limited, but regionally focused, effects of lower oil prices on California's economy on this blog in January.)
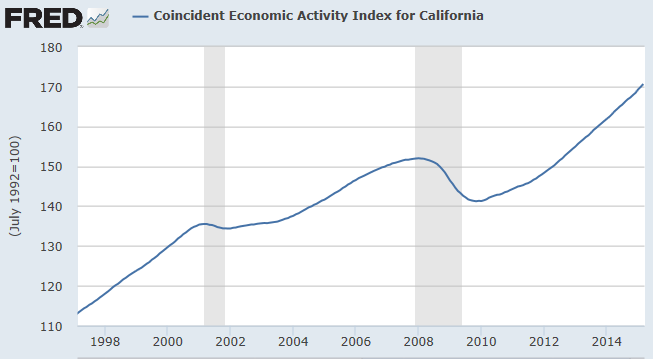
More Data. Below is a graphic showing the longer-term trend of California's Philadelphia Fed coincident index from the Federal Reserve Bank of St. Louis's FRED data page. Shaded areas indicate recession periods.